How Much to Bank on? When it Comes to Revenue Forecasting, Better Safe Than Sorry
According to current forecasts from outside analysts, New York City government will generate significant surplus revenue for the next four years, meaning the city will exceed the longest economic expansion in modern history in terms of tax revenue growth and match it in length.
If only the future were so predictable. Forecasting is inherently uncertain – one prominent economist opined “the only function of economic forecasting is to make astrology look respectable.”1 Therefore, fiscal discipline requires tax revenue forecasts that are not only rigorous but cautious because of ‘asymmetric risk’: prudent forecasts provide a margin of error in the event of revenue shortfall, while estimating optimistically can lead to spending that may not be sustainable when there is an economic downturn or merely slower growth than expected.
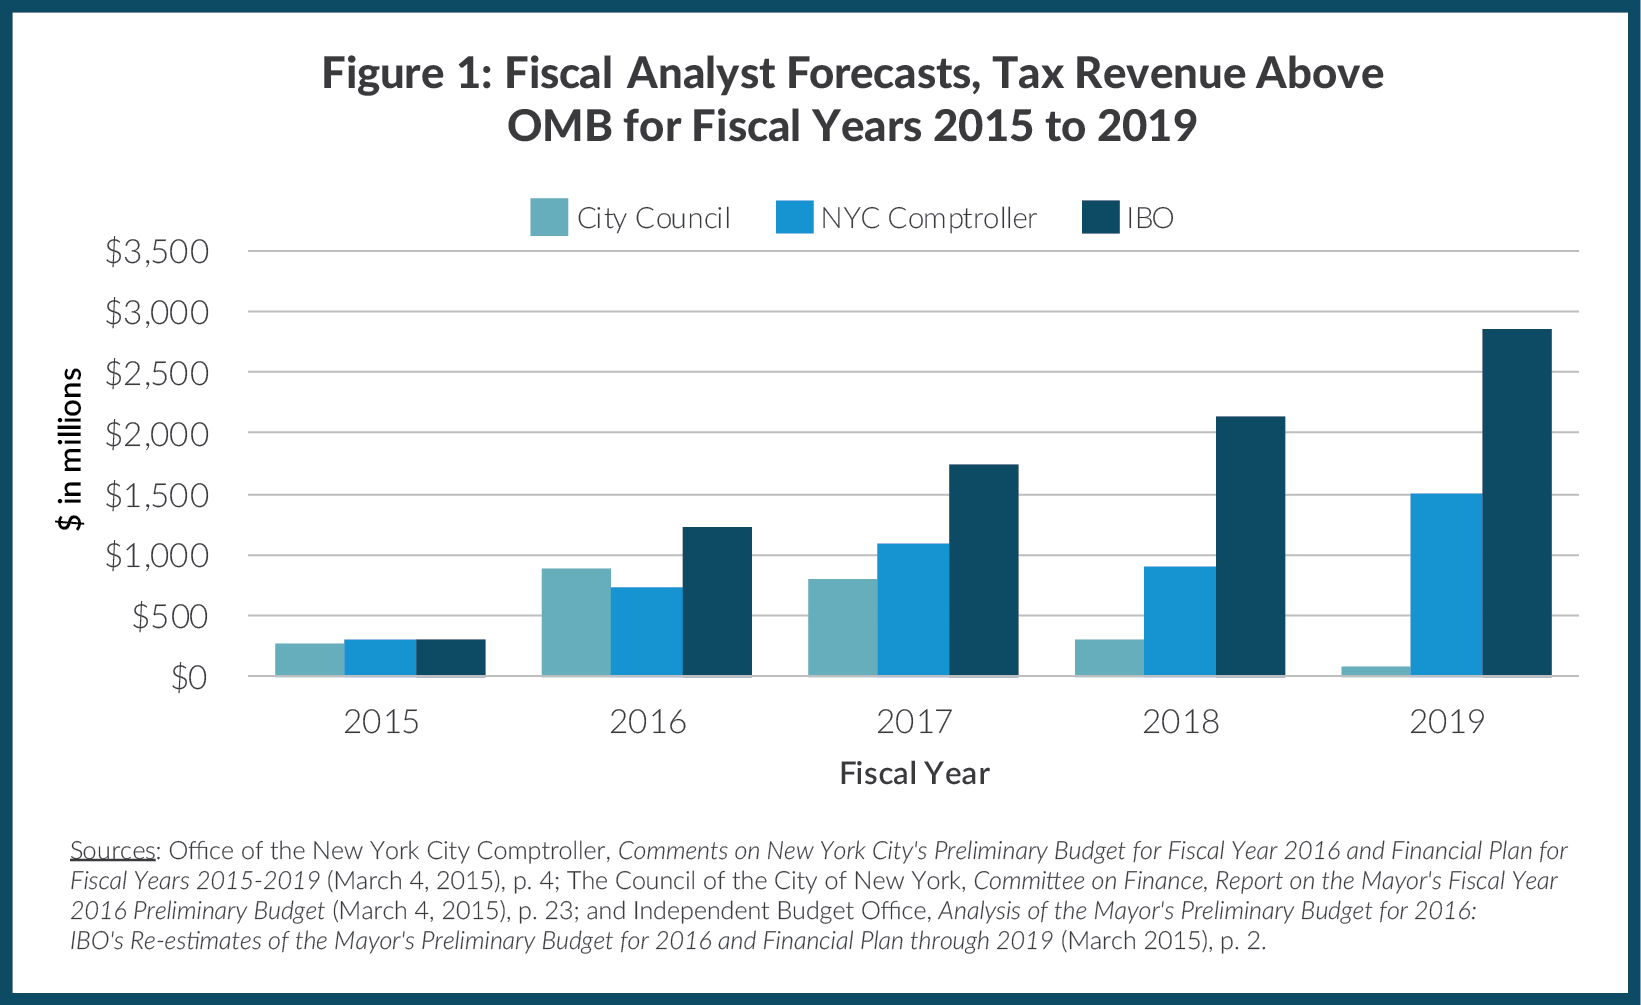
In early February the de Blasio Administration released its Preliminary Financial Plan for Fiscal Years 2015-2019. In it, the Office of Management and Budget (OMB) forecast tax revenue would grow $7.2 billion over that period, from $50.4 billion to $57.6 billion, cumulative growth of 3.4 percent per year. Other analysts have since prepared their own forecasts and, though significant differences exist among them, all expect more tax revenue than OMB, between $2.3 billion and $8.3 billion in cumulative additions. Those forecasts are routinely higher than the Administration’s, but this year the difference between the most optimistic and the City’s forecast is particularly wide. Figure 1 shows the difference between three analysts’ tax forecasts and OMB’s by fiscal year.
Forecasting is Hard and Getting Harder
As Figure 1 shows, the fiscal analysts’ forecasts differ among themselves as much as they differ from those of OMB. Each forecast starts with an econometric model of how the national economy will evolve over the next four years, and then each predicts those effects on the city’s economy and sources of City tax revenue.2
A recent study by The Pew Charitable Trusts examined errors in state revenue forecasting over the past three business cycles and found that errors are increasing due to rising volatility (year-to-year swings) and that corporate income taxes and capital gains are exceptionally hard to estimate.3 Those patterns hold true in New York City, where revenue swings in the past decade were very large and the largest peak-to-trough changes occurred in corporate and banking taxes (down 32 percent and 49 percent, respectively), real estate transaction taxes (down almost 70 percent), and personal income tax (down 21 percent, largely from capital gains).
Predicting tax revenue in New York City is even more difficult than elsewhere because of its heavy reliance on relatively few taxpayers for the bulk of its most volatile taxes. The exact proportions vary somewhat over the business cycle, but 1 percent of tax filers pay half of personal income taxes; about half of real estate transaction taxes come from 1.5 percent of payers; and two-thirds of business taxes come from less than 0.5 percent of business filers.4 In addition to the usual sources of error in revenue forecasting, this high degree of concentration adds further uncertainty because these taxpayers may behave differently than taxpayers as a whole, ways an econometric model may not predict well (or far enough in advance).
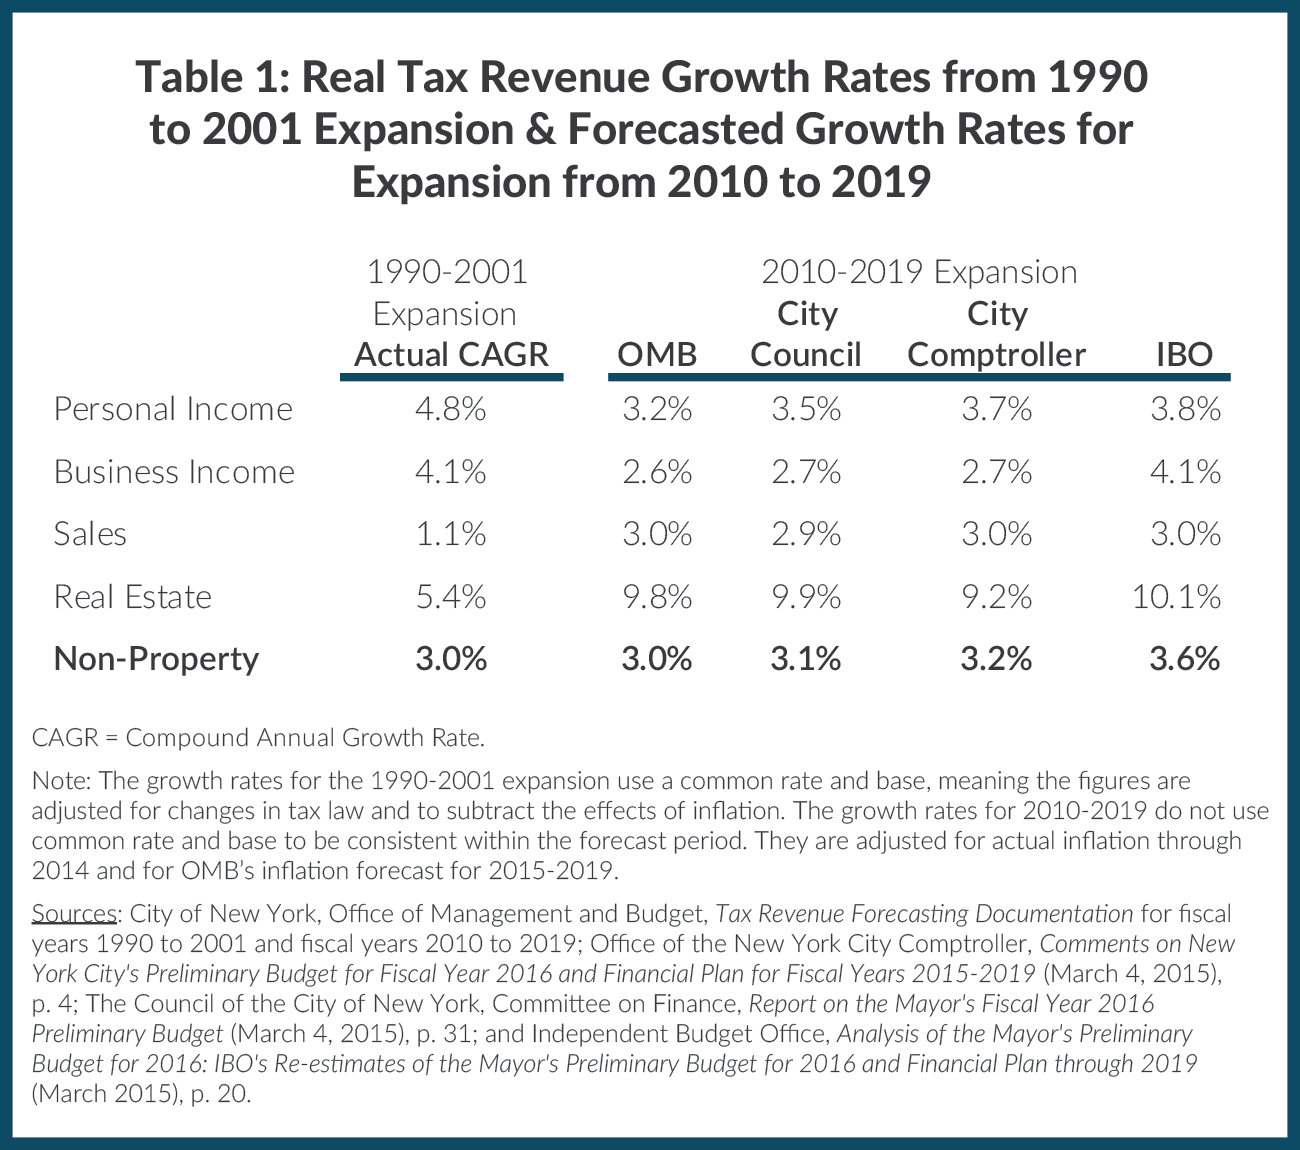
As the Mayor noted in his February budget presentation, the current economic expansion has been underway for more than five and a half years and will be tied with the 1990s for the longest expansion in modern history if it lasts until June 2019, as assumed by OMB and all of the fiscal analysts in their forecasts. Similar to the current recovery from the Great Recession, the 1990s were a time of very strong job growth, culminating with the Internet boom (and subsequent bust). Table 1 shows the compound annual growth rates (CAGR) for the main non-property taxes for the 1990s expansion and the implied rates for the current expansion through 2019 for each forecaster.5 The current OMB forecast predicts the same compound growth rate for 2010-2019 as was seen in the 1990s; the City Council and the Comptroller forecast slightly higher growth, with the Independent Budget Office (IBO) significantly higher than the others. The biggest differences arise in the personal and business income taxes which the Pew study and the City’s own experience have shown to be the most difficult to forecast accurately.
More Optimistic Forecasts Lead to Bigger Crises in Recessions
No one is predicting a recession at the moment, and growth in the U.S. economy has been solid enough for the Federal Reserve to consider raising interest rates. Absent an external shock of some sort, growth is likely to continue, although the strength of the dollar seems to have reduced the pace of tourism in the City, and many regard the stock market as overdue for a correction. Any one of several possible shocks, however, could hit the economy and tax revenue quite hard: a messy Greek exit from the Euro; a sharper slowdown in China; sudden failure of a large financial firm; or, another Russian military incursion into Europe. These are impossible to predict in advance, but recessions almost always come as a surprise.
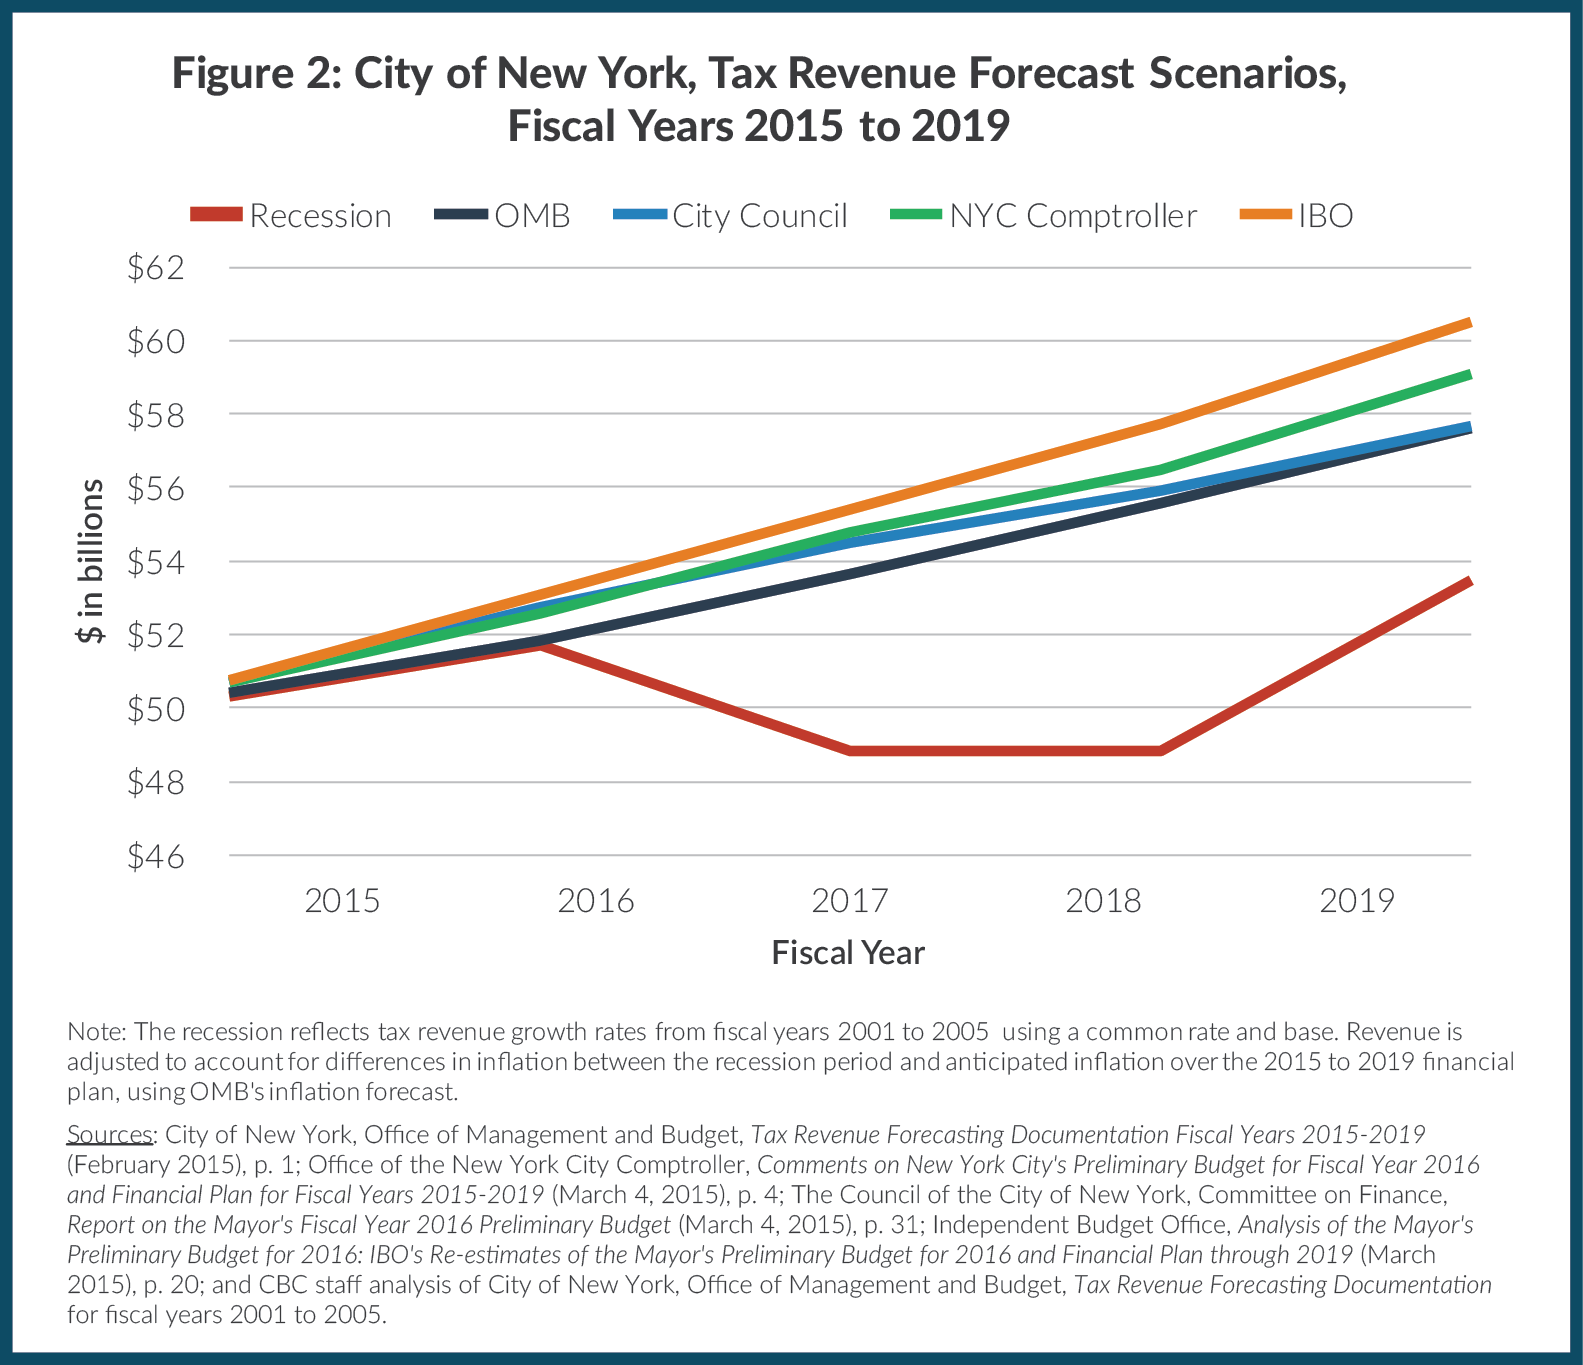
If a recession were to start during calendar year 2016, the revenue impact over the financial plan period would be substantial. Figure 2 shows the path of tax revenue if the annual changes that occurred in the 2001 recession (that immediately followed the 1990s expansion) were to begin in fiscal year 2017.6 Relative to OMB’s forecast there would be a cumulative shortfall of $15.8 billion. Relative to the IBO forecast – the most optimistic of the analysts – the shortfall would be $24.1 billion. Although each recession plays out differently, all lead to severe shortfalls: if the 1989 recession were repeated, tax revenue would fall $6.1 billion below OMB’s financial plan forecast, and a rerun of the most recent recession would reduce predicted revenue by $12.6 billion. Although the City maintains some reserves – the general reserve, now $750 million, is the largest– they would not cover the $2 billion to $4 billion in likely revenue losses in the first year of a recession.
Footnotes
- Quotation by Ezra Solomon in: Martin Wolf, “An Economist’s Advice to Astrologers,” Financial Times (January 6, 2015).
- The Office of the State Deputy Comptroller (OSDC) and the Financial Control Board (FCB) also monitor New York City budgets but do not produce economic outlooks or detailed revenue forecasts for each tax. Rather, they focus on assessing the City’s financial plan itself in some detail and estimate the upside or downside for a few key taxes. OSDC expects a total of $1.6 billion more revenue than OMB over the financial plan; FCB expects an additional $2.0 billion.
- The Pew Charitable Trusts and The Nelson A. Rockefeller Institute of Government, Managing Volatile Tax Collections in State Revenue Forecasts (March 2015), www.pewtrusts.org/~/media/Assets/2015/03/StateRevenueForecastingReportARTFINALv4web.pdf?la=en.
- Michael Dardia, Deputy Director, Office of Management and Budget, “Funding the Budget” (presentation to Coro New York Leadership Center Fellows, New York, NY, November 12, 2013).
- Non-property taxes are the most sensitive to economic fluctuations and are therefore the most volatile of tax revenue. The intricacies of the City’s property tax system, with multiyear phase-ins and caps on annual increases for various types of properties, smoothes out year-to-year changes in the amount of property tax collected, making it slow to respond to a downturn.
- Most tax revenue responses lag economic changes.