Why the Latest PEG Is Not Likely to Be the Last in NYC's Budget
Amid the extraordinary Hurricane Sandy recovery efforts, city officials continued with important fiscal activities. On November 9, an update to the current year budget and the financial plan for fiscal years 2013 to 2016 was released. The plan does not include any estimates of the fiscal impacts of the hurricane, but it features other important modifications. A recent court decision temporarily prevents the City from selling new taxi medallions, thereby opening a deficit in the current year budget and necessitating a renewed effort to contain expenditure growth to deal with future budget gaps.
The Mayor proposes a “program to eliminate the gap,” or PEG, that will save $1.5 billion over two years. This blog explains why the PEG is necessary, examines the savings from this program and offers a perspective on the PEG in terms of recent spending trends. It also cautions that additional PEGs are likely in order to cope with the City’s continuing fiscal challenges.
Why the PEG is Necessary
The PEG is an inevitable consequence of long-standing budget gaps the resolution of which was deferred in the current year with temporary measures.
Revenue growth is slow in the tepid economic recovery, and the source of the budget gaps is large and growing expenditure items. The big-ticket items include pension contributions ($8.0 billion), Medicaid ($6.3 billion), debt service ($6.2 billion) and health insurance ($5.2 billion), which cannot be reduced by the Mayor unilaterally. Changes to pension contributions require State approval; local Medicaid payments are mandated by the State; debt service payments are contractually obligated under bond agreements; and health insurance changes need to be negotiated with public employee unions or made legislatively. State actions have reduced future pension and Medicaid burdens[1], but the growth of debt service and health insurance continues to outpace all other spending and revenue growth, resulting in a structural budget deficit. Reducing the long-term trajectory of these costs by rightsizing capital investment and reforming health insurance premium arrangements have not been priorities for the Mayor and City Council in recent years.
In the face of this expenditure growth, the budget for fiscal year 2013, which began on July 1, was balanced with a heavy reliance on non-recurring resources: these “one-shots” constituted $4 billion of the $4.6 billion needed to close the fiscal year 2013 budget gap. The largest one-shot was the prepayment of $2.4 billion of 2013 expenses in fiscal year 2012; this “surplus roll” included $616 million in unexpected revenues from the CityTime and ING settlements. The City also withdrew $1 billion from the Retiree Health Insurance Trust, an account set up to deal with the City’s large and growing liability for retiree health insurance benefits. Finally, the budget included $635 million from the anticipated sale of taxi medallions, with an additional $365 million in fiscal year 2014 and $460 million in fiscal year 2015, for a total of $1.5 billion over three years.
Balancing the budget with these one-shots does not address the structural problems– notably, escalating health insurance and debt service costs—but masks the problem temporarily and delays the discourse needed to adopt more enduring, if politically tougher, solutions. In addition, one-shots can be unreliable; if something does not work as anticipated, the savings will not materialize. The taxi plan is a prime example: legal action is preventing the City from selling new medallions this year, opening a hole in the current-year budget.
The City expects to win the case on appeal and proceed with the sale next year. The November update maintains the same total revenues from the expected sale, $1.5 billion, but defers the revenues to fiscal years 2014 through 2016. To maintain a balanced budget in the current year and to begin to address the fiscal year 2014 budget gap of $2.5 billion, the Mayor proposed the current PEG. The following analysis evaluates the PEG, focusing on the proposals and savings planned in fiscal years 2013 to 2014, since they are the last two fiscal years for which this mayor is responsible for devising a budget.
The Nature of the November 2012 PEG
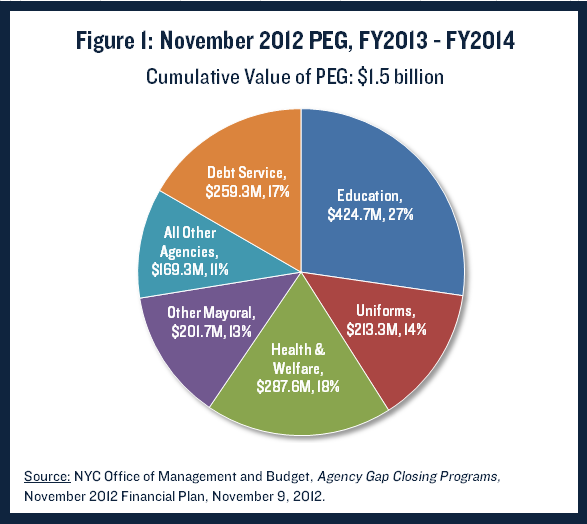
The November 2012 PEG totals $555 million in fiscal year 2013 and $1.0 billion in fiscal year 2014, for a total of $1.5 billion over two years. As shown in the accompanying pie chart, the Department of Education (DOE) accounts for the largest share of the PEG, more than one-quarter of all savings; given its $20 billion budget, the DOE’s share of the PEG is in line with its share of the total budget. Health and social welfare agencies [2] account for the second largest share, 18 percent or $287.6 million. Debt service savings are 17 percent, and the four uniformed agencies generate $213.3 million or about 14 percent. The remainder is divided among other mayoral agencies.
CBC has reviewed the agency initiatives proposed in the PEG and makes four important observations:
1. Overall, the PEG equals less than 2 percent of city-funded expenditures; savings vary among agencies with some doing relatively more than others.
The share of city funds saved by the PEG varies dramatically among agencies. (See Table 1.) At the low end, the Department of Parks and Recreation and the Health and Hospitals Corporation do not provide any savings. The Departments of Police, Fire, Social Services, and Environmental Protection generate savings of less than 1 percent of city-funded expenditures.
At the high end, the Administration for Children’s Services (ACS), Departments of Cultural Affairs, Housing, Finance, Transportation, and Citywide Administrative Services propose savings greater than 5 percent, with Transportation and Housing at 10 percent or more in fiscal year 2014. For both of these agencies, a substantial part of the PEG is shifting funding responsibilities to state and federal sources. In all six of these agencies, the PEG consists of a mixture of revenue and expenditure measures.

2. Less than half the PEG consists of recurring expenditure reductions, and most of those cuts do not require staff reductions.
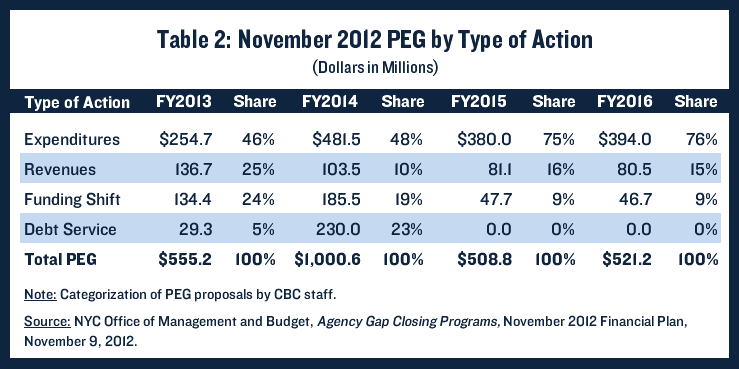
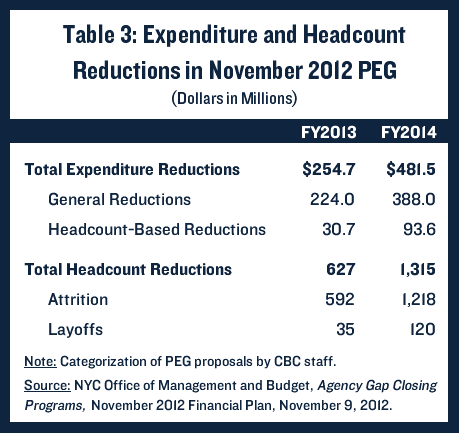
Expenditure reductions constitute $254.7 million in fiscal year 2013 and $481.5 million in fiscal year 2014, 46 percent and 48 percent of savings, respectively. This is a low proportion compared to earlier PEGs; a previous CBC analysis estimated two-thirds of the PEGs undertaken in the midst of the recession were expense cuts.[3]
Only $30.7 million in fiscal year 2013 and $93.6 million in fiscal year 2014 is saved by decreases in personnel. Some agencies, such as the Departments of Police, Fire, and Education and the ACS, do not lose any personnel. In other agencies, most of the reductions will occur through attrition, not layoffs. All but 35 of the 627 positions to be eliminated in fiscal year 2013 will be through attrition; in fiscal year 2014, 120 layoffs will occur in a total reduction of 1,218 positions. Among a workforce of almost 296,000, the two-year headcount reduction represents a contraction of less than 1 percent.
The largest headcount reduction, 385 positions, comes from a multi-year effort at the Human Resources Administration to use technology to improve services and reduce administrative costs. Another 240 positions will be eliminated due to the canceled re-opening of the Department of Correction’s Queens Detention Center, and 124 positions are not needed to staff a new marine transfer station because its opening is delayed beyond fiscal year 2014. Other positions eliminated are currently vacant, including 100 civilian positions at the Department of Corrections. Total “attrition” also includes approximately 165 positions that will be shifted from City funding to federal and state funding.
Layoffs are concentrated at the Departments of Health and Mental Hygiene (DOH) and Transportation (DOT). The 85 layoffs at the DOH include school health professionals, HIV immunization professionals, and administrative officials. The DOT will convert full-year to seasonal positions for bridge painters, resulting in a reduction the equivalent of 54 positions.
Most expenditure reductions involve non-personnel items. The largest such savings are at the DOE, which will renegotiate contracts related to special education for savings of approximately $100 million in each year. Libraries will lose $16.7 million in subsidies; funding for the Out-of-School-Time program will be reduced by $10 million; ACS will save $9.7 million through revised guidelines for post-transitional child care and reduced foster care enrollment; and Homeless Services will save $8.8 million from stricter reapplication requirements and better transitional employment opportunities. The remaining expenditure cuts are from contract renegotiations, hiring delays, and other efficiencies.
3. A significant component of the PEG program is debt service savings and funding shifts that do not negatively impact services; these items are also not expected to yield savings after fiscal year 2014.
Debt service has been an important source of savings in the last two years. Just as many homeowners refinance their mortgages to take advantage of low interest rates, the City refinances its debt obligations. Last year, it saved $257 million from lower debt costs, and a $228 million target in refinancing savings was approved for the current fiscal year. The November PEG includes additional savings of $29.2 million this year and $230 million in fiscal year 2014. These savings are not structured to produce recurring savings or reduce the long-term debt burden.
Funding shifts total $134.4 million in fiscal year 2013 and $186.3 million in fiscal year 2014, and generally consist of transferring certain costs to the state or federal government. One common shift is to seek greater state or federally reimbursement for selected positions or mandated responsibilities. Another is to obtain new intergovernmental grants.[4] The benefits of such funding shifts, however, are not necessarily recurring; their value falls to less than $50 million in fiscal years 2015 and 2016.
4. Revenue enhancements are the smallest element of the PEG over the two years, with most of the savings coming from increased enforcement, not new or increased fines and fees.
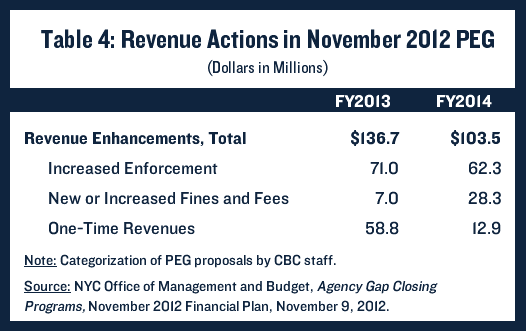
Revenue enhancements are $136.7 million in fiscal year 2013 and $103.5 million in fiscal year 2014. Most of the revenue increases are from increased enforcement of regulations already on the books. Examples include greater scrutiny by the Department of Finance of property tax exemptions, including those for non-profits and under the Industrial and Commercial Incentive Program; additional bus lane cameras to be installed by the DOT; updating cost estimates to reflect construction costs more accurately at the Department of Buildings; and additional collection of sidewalk café fees by the Department of Consumer Affairs.
New or increased fines generate $7.0 million in fiscal year 2013 and $28.3 million in fiscal year 2014. The largest new revenue generator is the DOT, raising $16 million from increased parking rates in Manhattan and at municipal garages, as well as expanded metered parking in Lower Manhattan. The DOE will increase the price of school lunches from $1.50 to $2.50 for $8.8 million.
Some additional revenues, $58.8 million in fiscal year 2013 and $12.9 million in fiscal year 2014, are from one-time sources, such as drawdowns of reserves and legal settlements.
The November 2012 PEG in Perspective
The November 2012 PEG is the 12th undertaken since the economic downturn in 2008. Cumulatively, these PEGs are estimated to produce $6.7 billion in savings in fiscal year 2013 and have been an important tool for managing the City’s finances through the recession.
While expenditure cuts constitute the majority of the cumulative PEG savings, not all agencies are working with reduced resources; in fact, some agencies’ budgets have grown during the fiscal year 2008 to 2013 period. For example, total spending growth at the Departments of Transportation (54 percent), Environmental Protection (33 percent), Homeless Services (24 percent), Fire (24 percent), Police (17 percent) and Education (15 percent) outpaced inflation between fiscal years 2008 and 2013. It should be noted that the Education and Police Departments did not participate in early rounds of PEGs.

Other agencies, particularly in health and social welfare, are making do with less after the successive rounds of cuts. Agencies like Youth and Community Development (-10 percent), Aging (-9 percent) and Children’s Services (-1 percent) have seen their budgets shrink. PEGs proposed this year for Libraries and Cultural Affairs will result in spending reductions, although these agencies routinely benefit from City Council restorations at the end of the year. Inflation has outpaced spending growth at the Departments of Social Services (7 percent), Health and Mental Hygiene (5 percent), Housing Preservation and Development (5 percent) and Parks (5 percent), signifying a decline in real resources since the recession began.
Overall, total agency spending has continued to grow each year. In fiscal year 2008, before any PEGs were adopted, the total budget was $60.6 billion[5]; in fiscal year 2013, after implementation of the PEG, it is projected to reach $72.3 billion, an increase of 19.8 percent, well above inflation, 9.6 percent, for the period. This growth is despite periodic hiring freezes during this time and a budgeted wage freeze for unionized city employees for fiscal years 2010 to 2012. The main explanation is that items such as health insurance and debt service have continued to grow unabated.
Looking Ahead
The Mayor must present a preliminary plan to balance the fiscal year 2014 budget in January 2013. If the PEG is implemented, the budget gap to be closed will be $1.2 billion. While this is small relative to prior years, significant risks will complicate the task.
First, the City is still relying on taxi medallion sale revenues, specifically $790 million in fiscal year 2014. If the City does not win the case on appeal, the gap will increase to $2.0 billion. It will also increase the fiscal year 2015 and 2016 deficits to $3.2 billion and $2.8 billion, respectively.
Second, the financial plan has yet to recognize any impact from Hurricane Sandy. The plan may show decreased tax revenues – due to lost economic activity and increased unemployment – and/or increased expenditures made necessary by the storm and subsequent recovery efforts. City leaders also recently approved an additional $500 million in borrowing for emergency capital expenditures for city schools and hospitals. State and City leaders have vowed to seek federal reimbursement aggressively, but how much federal aid will be made available to offset these expenses is as yet unclear.
Third, labor contracts have expired for the entire municipal workforce, and no labor reserve exists to pay wage increases for fiscal years 2010 through 2012.[6] If the City settles with any of the unions in the next few months, the budget gap will widen to the extent wage increases are not offset by concessions. If the City agrees to retroactive pay in these settlements as it has in the past, the potential budgetary impact would be $3 billion in the current fiscal year and an additional $2 billion in fiscal year 2014.
These risks are real and substantial. Given the sizeable gap even without any of these risks materializing, it is likely that the November 2012 PEG will not be the last. Another round, with larger recurring expenditure cuts, may be needed before fiscal year 2013 ends.
Footnotes
- In March 2012 State leaders enacted pension reforms that will reduce pension benefits for future employees and will produce savings for State and local governments over time. In 2005 the growth rate of local Medicaid expenditures was capped at 3 percent per year, and in March State leaders approved a freeze in local Medicaid expenditures that will take effect in 2015.
- Includes the Administration for Children's Services and the Departments of Social Services, Homeless Services, Youth and Community Development, and Health and Mental Hygiene.
- Courtney Wolf, “The New York City Budget Since the Recession: Seven Rounds of Cuts and the Deepest Still to Come,” Citizens Budget Commission Blog, February 7, 2011.
- Some of these funding shifts are routine, but some pose a risk that they will not be awarded or that they will not be renewed later in the future.
- Total budget calculated net of surplus roll and includes off-budget debt service for TFA, TSASC and STARC. Also subtracts debt retirement from fiscal year 2008 expenditures, adjusts for the impact of federal stimulus funding for Medicaid and adds drawdowns from the Retiree Health Insurance Trust Fund.
- The teacher contract has been expired since October 2009, and no reserve exists to pay for teacher raises for the 2008-2010 bargaining period.