New York State School Aid
A Big Increase, Badly Allocated Among Districts
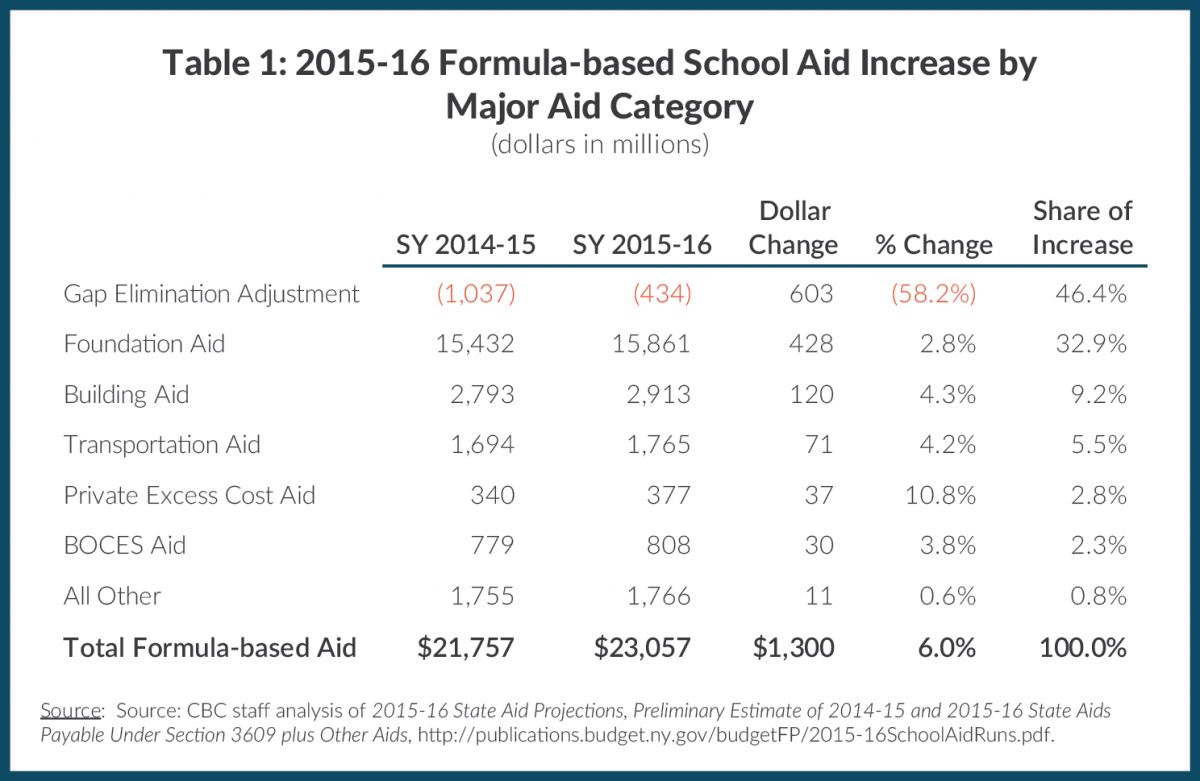
The fiscal year 2016 state budget enacted last week includes a 6.0 percent increase in annual formula-based aid to school districts from $21.8 billion to $23.1 billion. This is the third consecutive year in which the Governor and the legislature have busted the statutory growth cap they agreed upon in 2011. Under the cap, which is based on lagged annual personal income growth, school aid should have expanded $377 million; instead, it will grow $1.3 billion. This large infusion of resources, which further solidifies the State’s position as the top spender on K-12 public education in the nation, is not targeted to the neediest districts and perpetuates disparities in spending.1
Nearly half of the $1.3 billion school aid increase is allocated through restorations to the Gap Elimination Adjustment (GEA), the mechanism used to apply progressive cuts in school year 2010-11. Because the GEA was targeted to fall more heavily on wealthier districts, the $603 million restoration steers funding to them. Another one-fifth of the increase flows through expense-based reimbursement formulas, which also favor wealthier, higher-spending districts. (See Table 1.) Only one-third of the increase is distributed through Foundation Aid, New York’s primary mechanism for addressing resource disparities among districts.
In addition to the $1.3 billion increase in formula-based aid, the adopted budget includes $75 million for grants to “persistently failing schools,” $30 million in “bullet aid” to be allocated by resolutions approved in the Senate and the Assembly, and $8 million in line item grants for specific school districts, including $2 million for Yonkers and $1.5 million for New York City.<2
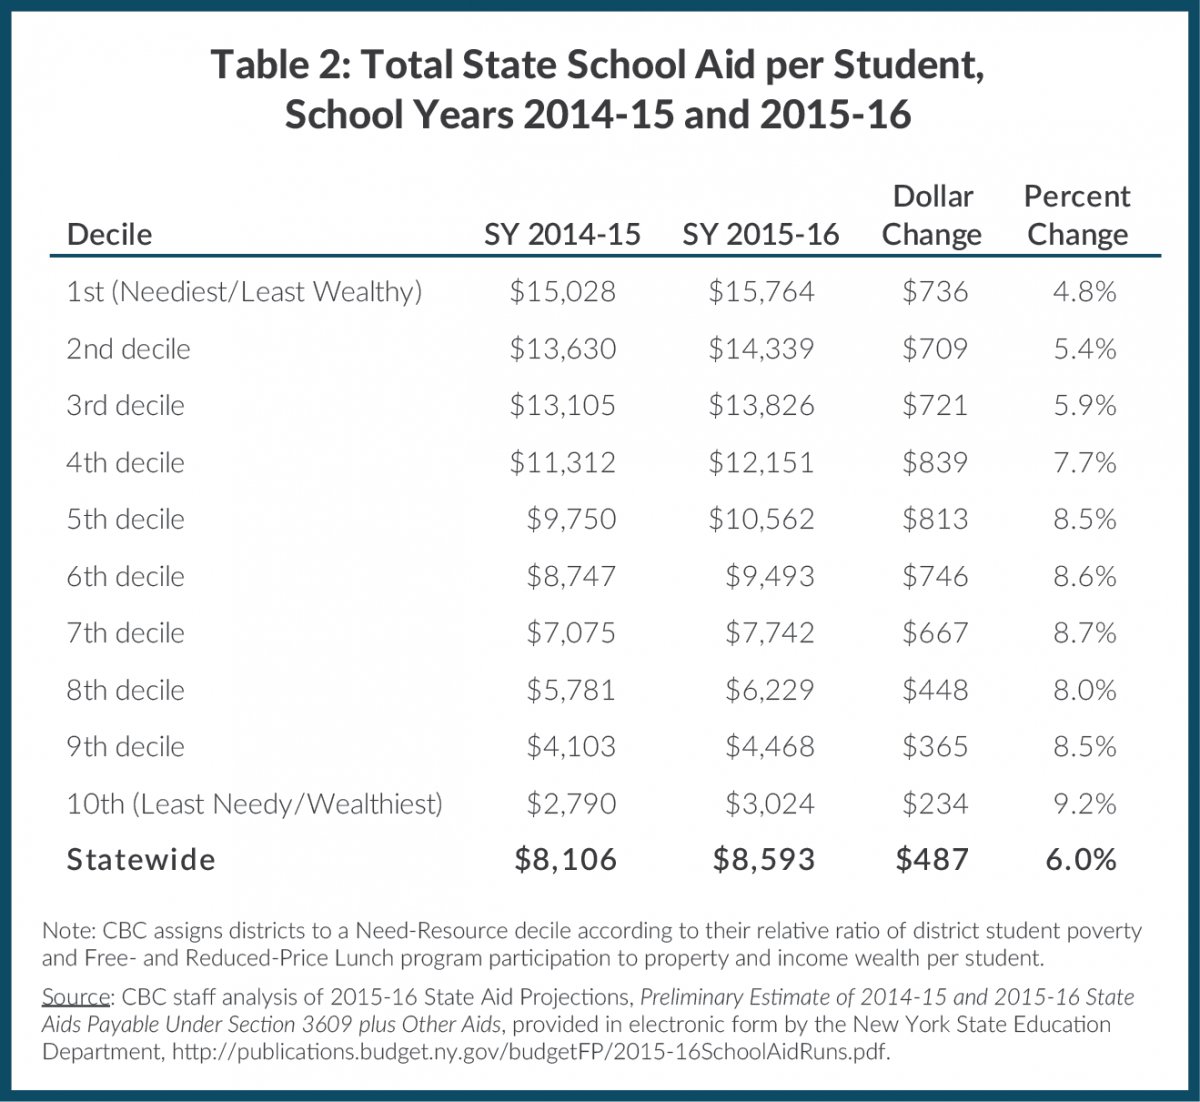
Because the legislature prioritized restorations to the GEA, the largest percent increases go to the most affluent districts, and the smallest increases go to the neediest districts. On average the most affluent 10 percent of New York school districts receive an aid increase of 9.2 percent per student, while the neediest 10 percent get average increases of 4.8 percent per student.3 Because wealthier districts receive smaller amounts of school aid from the State, the average increase is $234 per student for the wealthiest 10percent and $736 per student for the poorest. Districts in the middle of the wealth and need spectrum get average increases between $365 and $839 per student. (See Table 2.)
Beside differences over the size of the aid increase, the debate among elected leaders on school aid this year focused almost exclusively on Governor Andrew Cuomo’s proposals to change teacher evaluations, New York’s approach to failing schools, and other education reforms. The Legislature did not address long-standing problems with the distribution of school aid, such as hold harmless provisions and generous reimbursements for school transportation and construction expenses that misdirect aid. These fundamental issues with the aid formulas should be addressed in the coming year.
Footnotes
- As of school year 2013-14 (the most recent year for which State Education Department data is available), New York spent an average of $21,800 per student on K-12 public education; the adopted state budgets from the last two years have added another $850 per student. New York State Department of Education, Analysis of School Finances in New York State School Districts, 2012-13 (January 2015), p. 5, www.oms.nysed.gov/faru/PDFDocuments/2014_Analysis_a.pdf.
- The budget also appropriates $25 million to be allocated by the Senate in the 2016-17 school year. The full list of itemized grants to specific school districts is: $2 million to Yonkers; $1.5 million to New York City for the Community Learning Schools Initiative; $1.25 million in Valuation Impact Grants ($300,000 to the Liverpool Central School District; $450,000 to the North Rockland Central School District; and $500,000 to the Panama Central School District); $1.2 million to Rochester for health services grants; $1.2 million to Buffalo for health services grants; $903,000 to the Henry Viscardi school; and $200,000 to the Onondaga-Cortland-Madison BOCES for the New Technology School Initiative. New York State Legislation, A6720B/S4612B, www.assembly.state.ny.us/leg/?default_fld=&bn=A06720&term=2015&Summary=Y&Text=Y.
- CBC grouped New York’s 674 districts into deciles based on a Need-Resource Index. The index ranks districts according to local student need (based on the child poverty rate and participation in the Free- and Reduced-Price Lunch program) and local district wealth (based on property and income wealth per student). The 1st decile is the neediest/least wealthy and the 10th decile is the least needy/wealthiest.