Misplaced Priorities in the MTA's Capital Plan
Introduction
The Metropolitan Transportation Authority (MTA), which operates an extensive transportation network vital to the New York region’s economy, is preparing its capital investment plan for the next five years, 2015-2019. The investment plan is important because it determines the condition of the assets required for the mass transit system, everything from highly visible subway cars to hidden drainage pumps and ventilation fans in tunnels, and the nature of any improvements or expansions to the transportation system such as new subway routes or commuter railroad stations. The scale and content of the investment plan are policy decisions that deserve public attention and discussion.
Three core issues to be addressed in the plan are: How much should be invested? On what should it be spent? From where should the money come?
The first two issues are linked in the sense that the amount invested should, in part, be a function of the possible beneficial investments. But in the region’s transportation system the opportunities for beneficial investments generally exceed both the capacity of the MTA to manage projects and the willingness of elected leaders to allocate scarce public resources to transportation activities. Priorities should be set for how the available money is used, and plans should reflect established criteria for selecting among alternative investments. Once the first two decisions are reached, sources of funding should be identified.
On September 24, 2014 the MTA Board approved a capital plan for 2015-2019 for submission to the State’s Capital Program Review Board (CPRB), calling for $32 billion in investments over the next five years. Much of the discussion and controversy over this plan has focused on the fact that it omits specifics on how the proposed $32 billion in spending will be funded. The plan identifies $16.9 billion in available funding from federal, state, and local sources as well as the MTA’s own borrowing, but a gap of about $15.2 billion remains unfunded.1
Before the necessary and important debate over how to fund the plan continues, a prior question deserves careful deliberation: Does the MTA’s plan spend the money on the right things? Taxpayers and riders should not be asked to pay more for a misguided plan.
The proposed plan should be revised to address three serious shortcomings:
-
It does not make sufficient progress in bringing aged infrastructure to a state of good repair (SOGR). It will leave many features of the mass transit and commuter rail systems in need of repairs and renovations; the consequence could be less reliable and less safe service than the public needs.
-
It does not make sufficient progress in modernizing the signal and communication systems in the subways. The schedule for adopting Communications-Based Train Control (CBTC), currently available on the L line and being installed on the 7 line, is too slow; in the next five years work will begin on only two additional segments leaving the vast majority of the system with outdated components for at least the next 20 years.
-
It allocates substantial sums, and implicitly commits even larger sums in the future, to new projects that expand the transit network without analyzing their benefits relative to other possibilities and without identifying their total cost. Better planning and greater transparency should precede investments in such system expansions.
This policy brief provides background on the current plan and explains more fully the nature of these shortcomings.
Capital Plan Process and Status
The MTA’s 2015-2019 capital plan continues a practice of preparing five-year plans initiated in 1982. The process begins with a 20-year needs assessment to identify investment needs over that period and indicates what portion of those needs will be met in the next five-year plan. The MTA staff released the latest 20-year needs assessment in October 2013.
Drawing on the needs assessment, the MTA staff presents a proposed capital plan to the MTA board; the 2015-2019 plan was presented and approved at the September 2014 Board meeting. The MTA then submits the plan to a Capital Plan Review Board (CPRB) consisting of members appointed by State elected officials.2 The CPRB reviews and then approves or rejects the plan with any voting member empowered to veto. On October 2, 2014 the Governor’s representative on the CPRB, the State Transportation Commissioner, vetoed the plan. The veto was “without prejudice to any particular element or project that is contained in the proposal.”3 The MTA will now develop a revised plan.
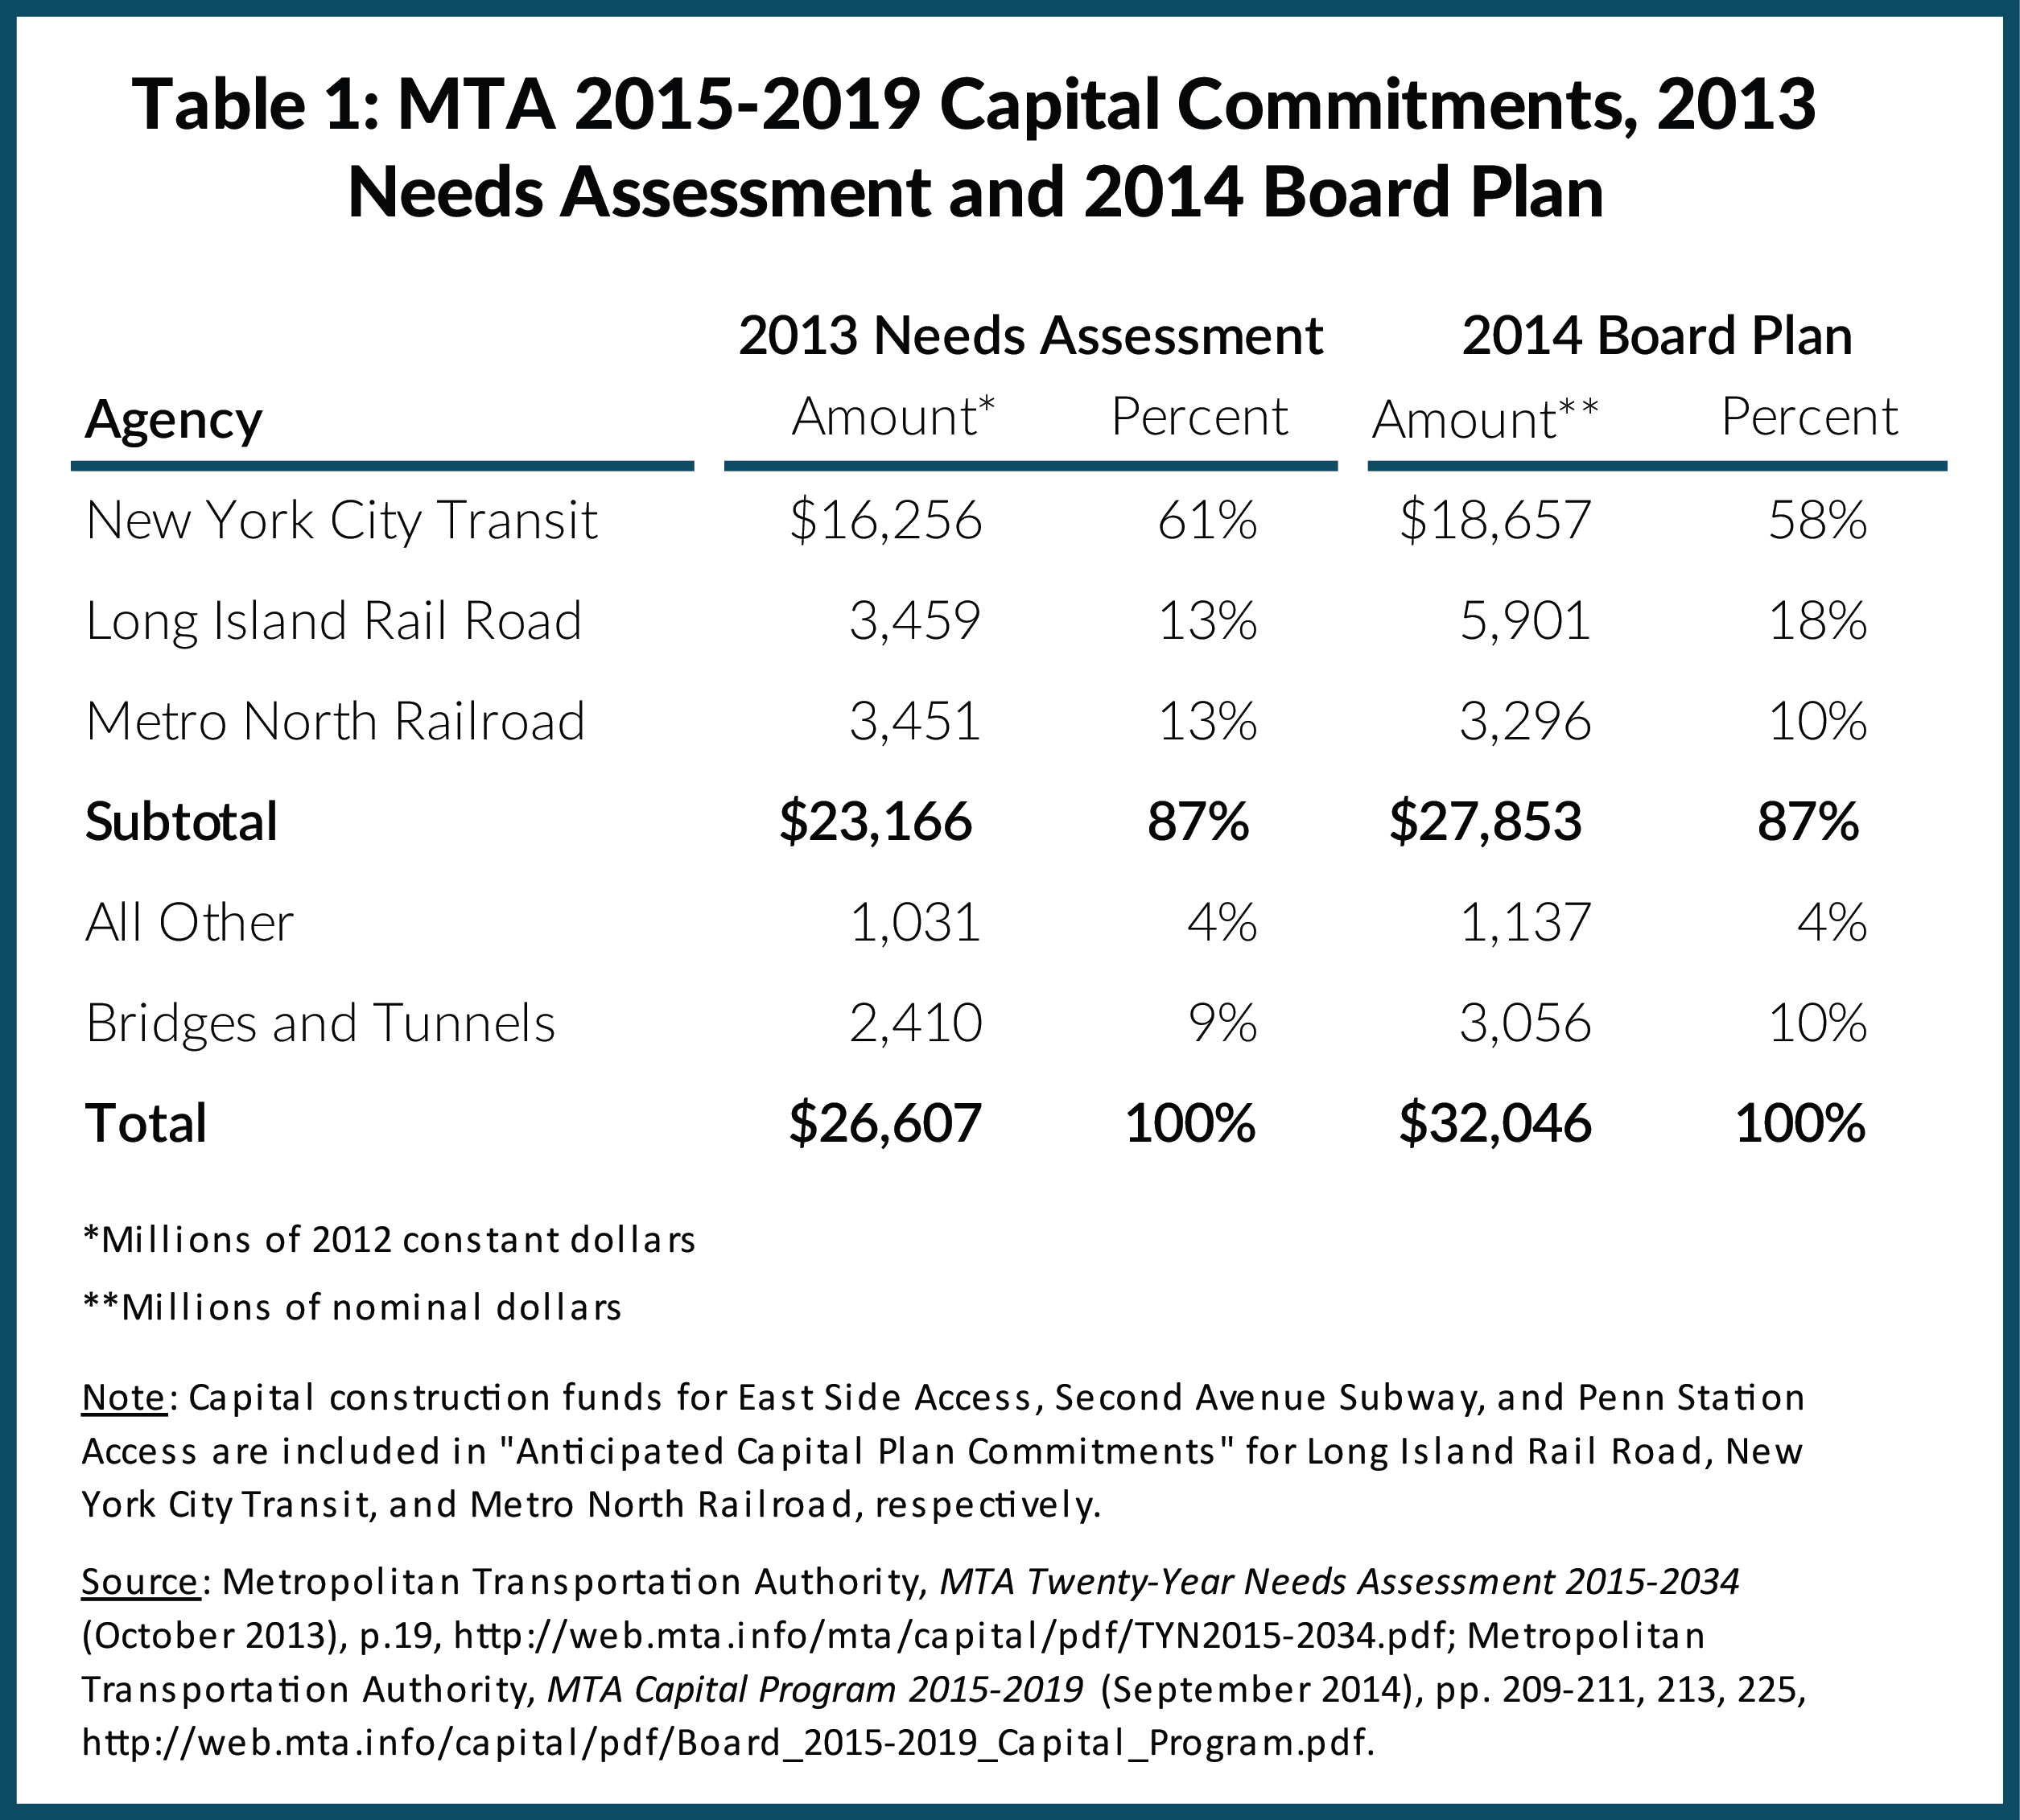
This analysis considers spending needs and plans for New York City Transit (NYCT), Metro-North Railroad (MNR) and Long Island Rail Road (LIRR). The needs assessment and capital plan include other entities within the MTA, but the three agencies included here comprise 87 percent of the total spending recommended in the needs assessment for 2015-2019 and the spending recommended in the Board-approved plan. (See Table 1.)
Insufficient Progress in Achieving and Sustaining SOGR
Although the MTA has been making substantial investments in its assets for more than 30 years, most of the facilities are not in a state of good repair. A long period of neglect prior to 1982 and constant wear and tear since then mean that many assets require additional investments for repairs or replacement in order to be considered in a state of good repair. While deficits from this status do not necessarily mean unsafe operations, they do indicate possible risk of service disruptions and potential safety concerns.
The MTA uses different approaches to reporting the condition of assets at NYCT, LIRR, and MNR. At NYCT assets are divided among 14 categories, and each category is assigned a percentage score indicating the share of assets or asset components in SOGR. Only two categories – subway cars and mainline track and switches – are rated 100 percent; buses are 91 percent in SOGR with 387 of 4,428 buses kept in operation with high maintenance needs despite exceeding their useful life of 12 years.4 The ratings for 10 other categories range from 46 percent for subway shops to 89 percent for the pumps and wells intended to keep the system dry; the category of line structures is not reported because the MTA is developing a new rating system for those assets, but in the 2009 needs assessment its score was 79 percent.5
At the LIRR assets are divided into seven categories – rolling stock, stations, track, line structures, communications and signals, shops and yards, and power. Six of the seven are considered at SOGR, and one category, line structures, is rated at 75 percent.6
At MNR assets are divided into eight investment categories, but asset conditions are not reported in the same categories. Grand Central Terminal (GCT), stations and parking facilities are three separate investment categories, but have one combined assessment rating of about 85 percent of SOGR; line structures and shops and yards have ratings of about 70 percent and 75 percent, respectively.
The needs assessment does not provide sufficient information about three MNR asset categories to determine whether they are in SOGR – rolling stock, communications and signals, and power facilities. The latest and other recent needs assessments do not refer to a useful life or replacement cycle for the MNR rolling stock, but the 2000-2019 needs assessment referred to “overage” rolling stock.7 The communications and signals systems on the Hudson Line and Harlem Line are both described as “safely operating beyond its useful life cycle,” and in need of the federally mandated Positive Train Control system.8 The description of the MNR power system does not indicate if it is in SOGR.
The concern that the MTA is not making sufficient investment and progress toward the goal of achieving SOGR rests on two facts: (1) The Board approved plan allocates less for most of the investment categories not in SOGR than was identified as needed in the 2013 needs assessment; (2) the sums identified as needed in the 2013 needs assessment are based on relatively unambitious goals in term of progress toward achieving SOGR. Restated, the needs assessment set a low bar, and the approved plan does not meet even that low bar.
Reductions from the Needs Assessment. Table 2 compares the amounts identified in the needs assessment with the amounts in the plan for the major asset categories at NYCT, LIRR, and MNR. The needs assessment presented the funding requirements in constant 2012 dollars, and the Board’s plan expressed requested amounts in current dollars during the five years of the plan. Table 2 shows the needs assessment amounts in both the original constant dollars and in nominal dollars equivalent to those used in the Board’s plan; the differences are measured in the nominal dollar amounts.
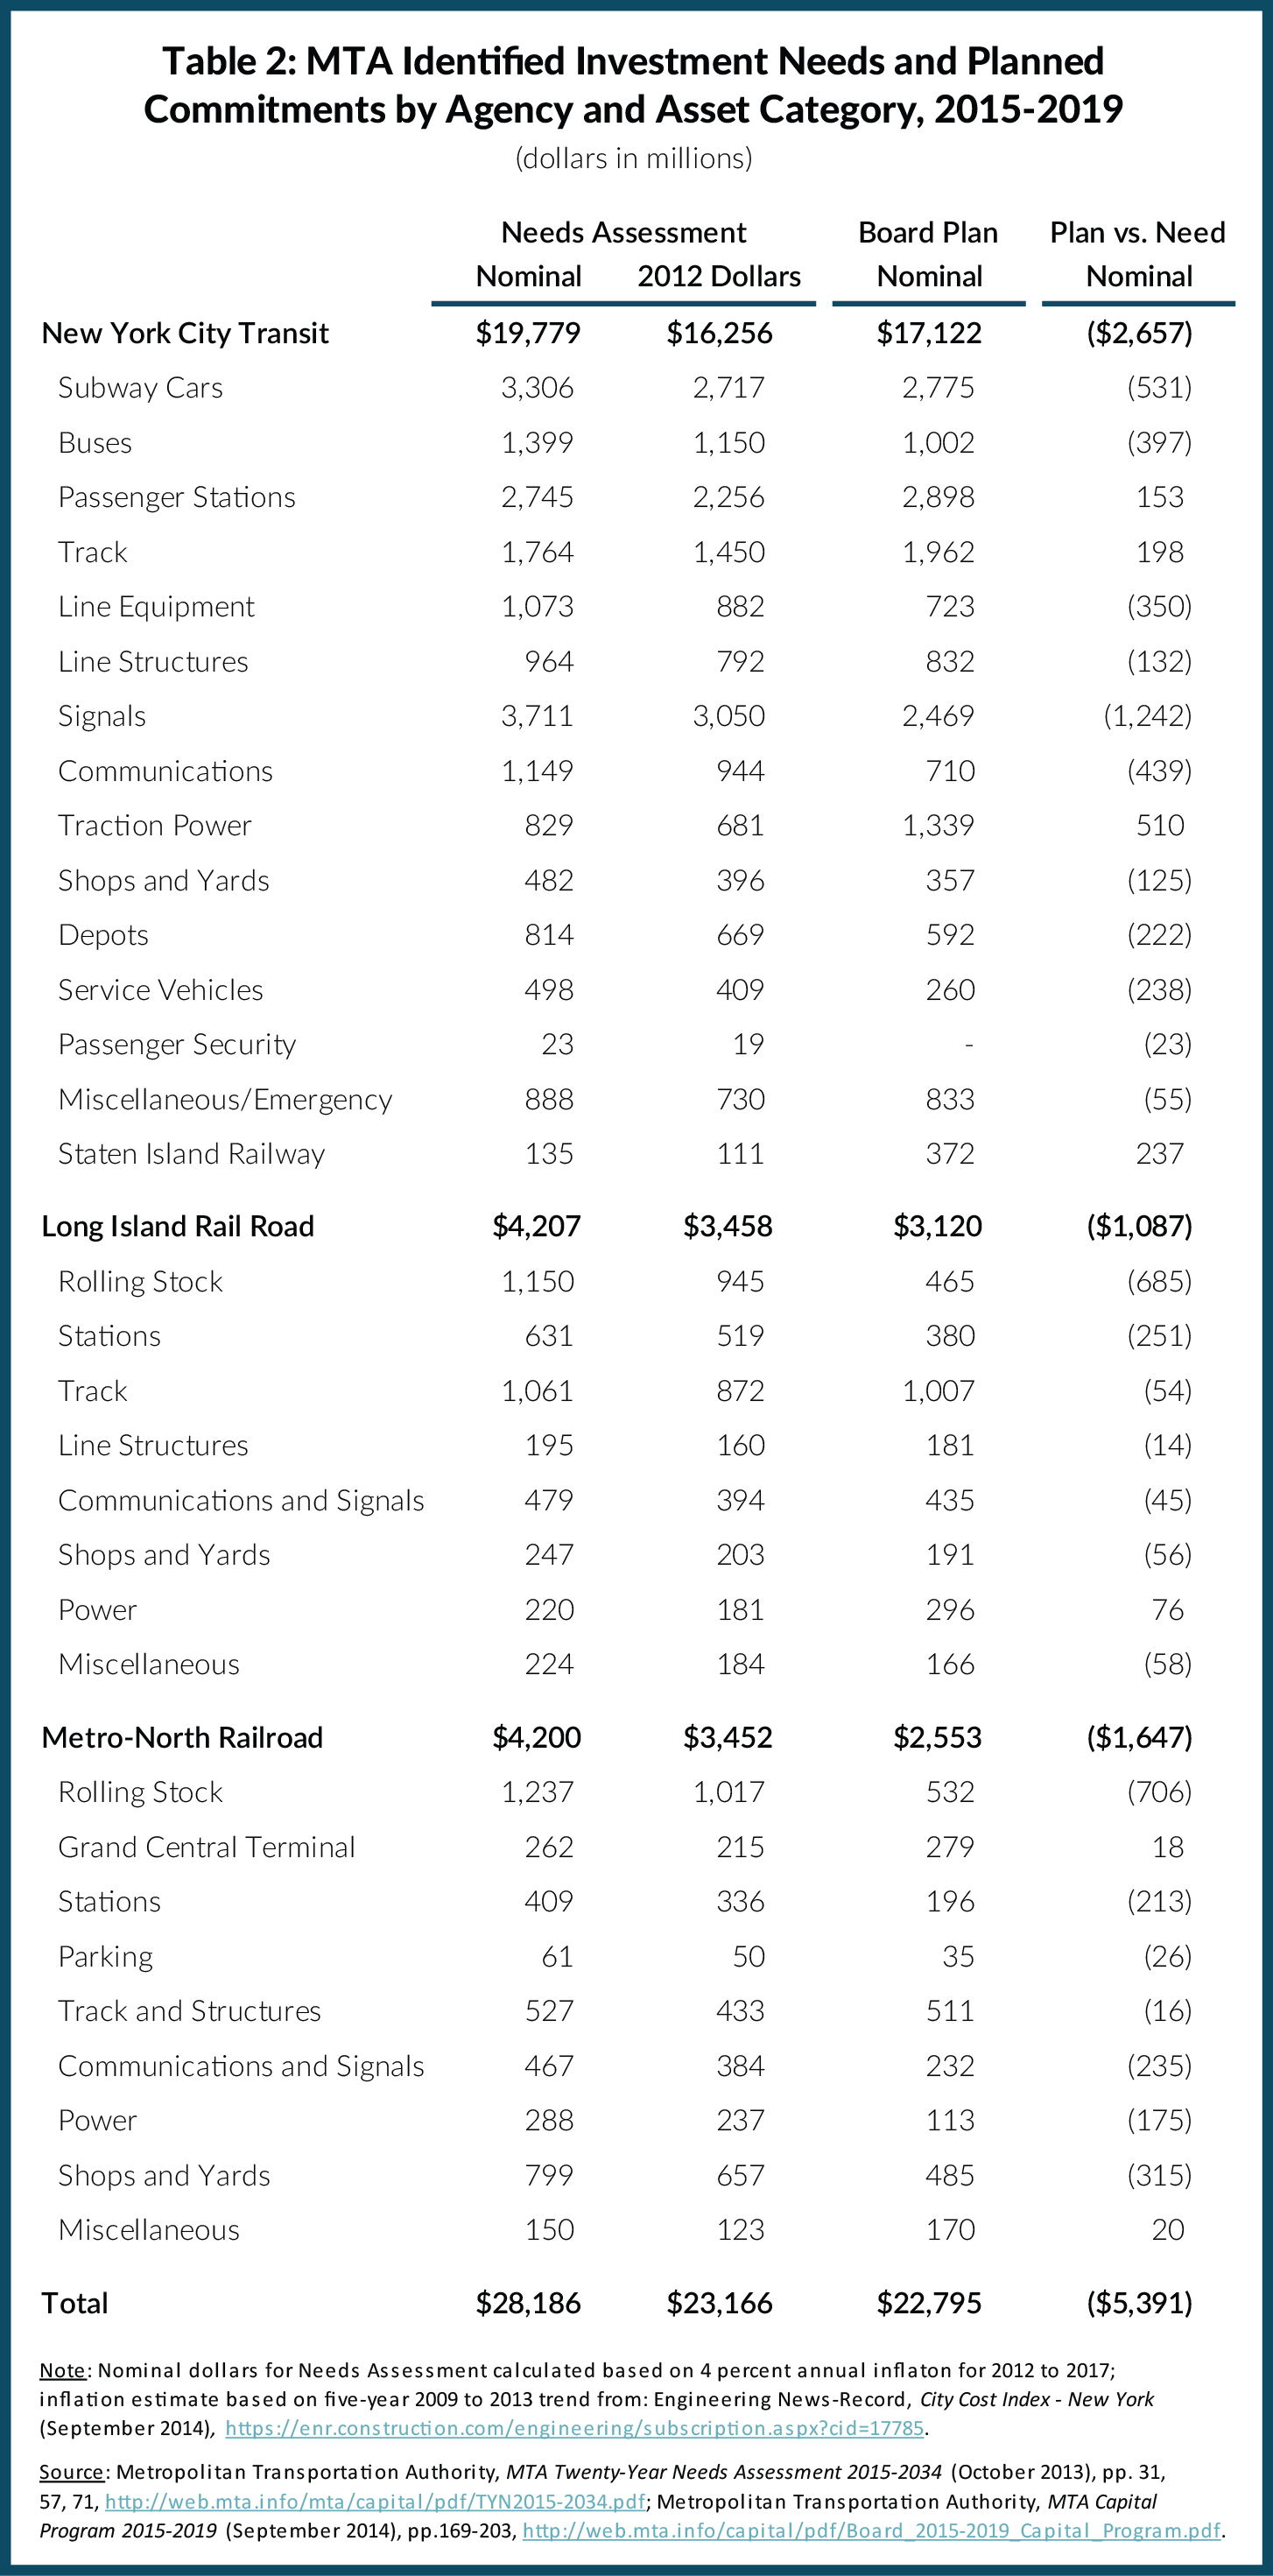
In total the shortfall is $5.4 billion or about 19 percent of the $28.2 billion in the needs assessment. The shortfall at NYCT is $2.7 billion or 13percent of the needs assessment total; the comparable figures for LIRR are $1.1 billion or 26 percent and for MNR are $1.6 billion or 39 percent.
At NYCT the biggest reductions are for communications and signals, an investment priority discussed below. The next largest reduction, $531 million, is in the allocation for the purchase of new subway cars. The major factor behind the reduction is a lower estimate of the cost per car for replacement. The MTA expects to obtain a reduced price for the purchase of smaller (60 foot versus 75 foot) cars; it expects to obtain the same capacity by buying 940 smaller cars instead of 752 larger cars, but at a significantly lower total cost.9 For most of the other NYCT asset categories it is not possible to describe the impact of funding reductions because the needs assessment does not provide specific information about the results of the expenditures it identifies. However, in a few cases this is possible. For example, in the category of line equipment, the plan calls for replacing 6.1 miles of tunnel lighting versus 32 miles in the needs assessment, and the plan calls for repairing 7 pump rooms versus 26 over the next 10 years (the equivalent of 13 in a five-year plan) in the needs assessment.10
At the commuter railroads, the largest reductions in funding from the needs assessment are for replacement of rolling stock - $685 million at the LIRR and $706 million at the MNR. In both cases the reduction is primarily attributable to an expected lower cost per car based on more recent procurement experience. However, for the LIRR the lower amount also reflects purchase of 72 fewer cars; the eliminated cars were to accommodate expanded ridership rather than to replace aged cars, and that growth capacity will now be accommodated in future capital plans.11 For the other asset categories at the commuter railroads sufficient information is not provided to allow an assessment of the impact of lower allocations.
Limited Goals in the Needs Assessment. The 2013 needs assessment allocations for the 2015-2019 plan represent a low level of ambition and slow pace of investment and activity toward the goal of achieving SOGR. A review of the SOGR scores in prior needs assessments reveals limited gains in the percentage ratings. They vary among asset categories but are generally not impressive. Since the 1999 assessment the percentages have declined for subway shops and yards and for bus shops and depots (and appear to have declined for power facilities). Little change is evident in signals and ventilation equipment; little gain was reported in the condition of line structures in the period for which data is available. Modest gains are reported for stations, but this may be related to the change in assessment approach. (See Table 3.)
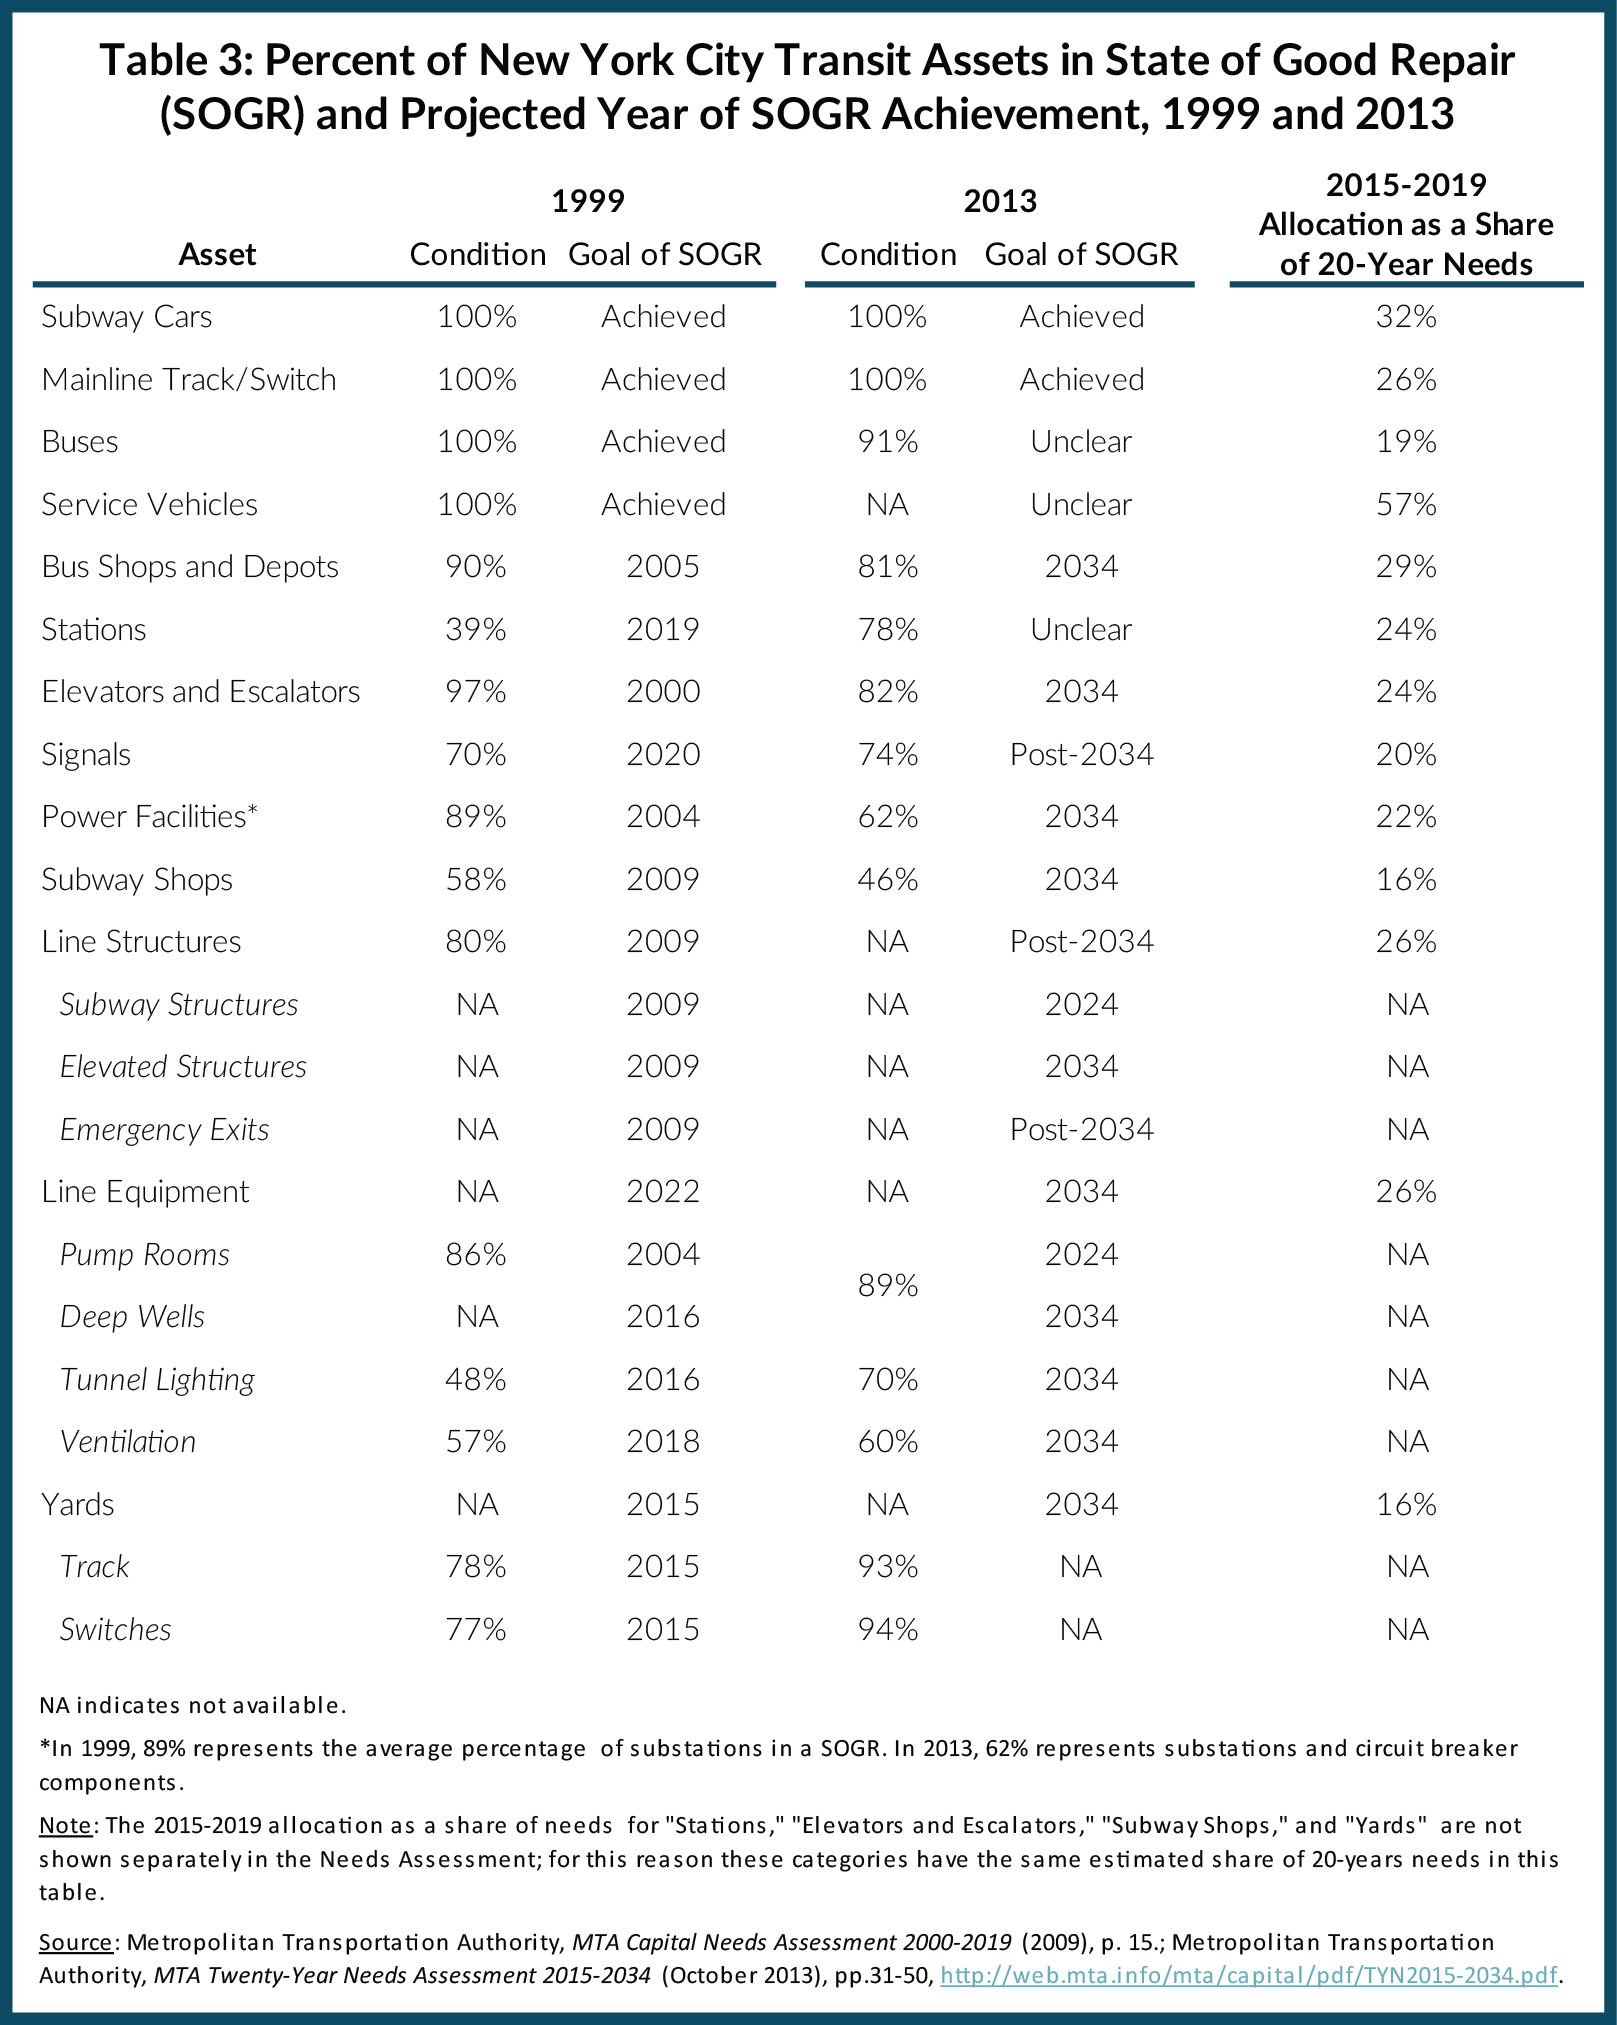
The declining ambition of the program to bring assets to SOGR is reflected in the changing target date for achieving SOGR in each subsequent needs assessment. For five of the asset categories the 2013 needs assessment sets a target of 2034 for SOGR, each case shows significant delay from the target in the 1999 needs assessment. Line structures moved to post-2034 from 2009; line equipment to 2034 from 2022, bus shops and depots from 2005, power facilities from 2004, subway shops from 2009, and yards from 2015.
The asset category of tunnel lighting provides a clear example of the seeming snail’s pace at which the MTA is bringing much of its asset base to SOGR. The subway tunnels have 432 miles of lighting. They were built with incandescent fixtures, and the SOGR work involves converting the outdated incandescent fixtures to fluorescent ones. In 1999 less than half the system had been upgraded, and the needs assessment for the 2000-2004 plan called for the work to be completed by 2016.12 That goal will not be met; the latest needs assessment indicates 130 miles of incandescent lighting remain and sets a goal of 2034, indicating it will have required 35 years to upgrade about 216 miles.13
The continuation of slow progress is reflected in the pattern of funding proposed in the latest needs assessment. If SOGR is to be achieved in 20 years, an even pace would have one-quarter of the total funding in each of the covered five-year plans; an accelerated pace would “front load” the spending and have a greater share in the earliest (2015-2019) five-year plan. The needs assessment proposes only a relatively even pace, rather than acceleration: the 2015-2019 plan has 26 percent of total spending for line structures, 26 percent for line equipment, 24 percent for stations, 22 percent for power facilities, 16 percent for subway shops and yards, and 29 percent for bus shops and depots. The reductions from the needs assessment in the adopted plan indicate the planned pace is becoming even slower.
A similar pattern is evident at the commuter railroads. At the LIRR the one asset category, line structures, not in SOGR has a 2013 SOGR rating of 75 percent and the need assessment sets a goal of achieving SOGR for 2024, a delay from the 1999 needs assessment goal of 2014. However, the current needs assessment allocates only 14 percent of the 20-year total funding for the next five-year plan, suggesting a faster pace might be possible.14 For MNR, as noted above, the current needs assessment provides limited information about the condition of most categories of assets. It is unclear what condition they are in and when they are targeted for SOGR. The one exception is track and structures; while they are reported to be at 70 percent of SOGR, the target for SOGR is beyond the 2034 end of the time frame for the current needs assessment. Fully $2.3 billion is allocated for this category in the 20-year period, but only 19 percent is scheduled for the next five-year plan.15
The slow pace of SOGR work may not be exclusively a function of priorities for investing scarce dollars. In setting the pace of work the MTA also considers the riding public’s tolerance of the associated delays or disruptions in service and the availability of qualified contractors to compete for and undertake the specialized work sometimes involved, as well as its own capacity to manage simultaneously multiple complex contracts. These are legitimate considerations, but such constraints can be lessened by public education, by outreach to the contracting sector, and by enhanced internal management staffing.
Insufficient Progress in Modernizing Signals and Communications Systems
The MTA subway lines were built, and in most cases continue to operate with, a “fixed block” signal system. When a train occupies a “block” or set area of track, then a trackside signal behind the train similar to a street traffic light with green, yellow, and red bulbs informs the operator of the next train whether it is safe to proceed. If a train tries to move past a red signal, the system automatically triggers the brakes of the train.
For more than two decades a goal of the MTA has been to replace this aged and outmoded system with newer technology known as Communications-Based Train Control (CBTC). This system allows the trains and their track routes to operate from a central facility and uses computers to control track switches and train speed and headways (the distance between trains). CBTC, which is a proven technology used on systems elsewhere, is superior to the current system because it is safer, increases capacity by allowing more trains to operate with narrower headways, and is more efficient due to potential one-person or “no-person” train operation. (Most MTA subways operate with two staff on board - a motorman and a conductor.) Since conversion to CBTC is complex and requires a relatively long period, the MTA’s simultaneous goal has been to keep the existing system safe and in SOGR during modernization.
Conversion to CBTC requires three steps. (1) Interlockings, switches that permit trains to change tracks and direction, must be in SOGR and ready to be operated by the CBTC system. (2) Communication links must be created between the track routes and a central control facility. (3) CBTC technology must be deployed along track routes and in subway cars.
Despite the goal of conversion to CBTC, the MTA has not developed a full, comprehensive and credible plan for this conversion. Instead it has proceeded slowly, and in piecemeal fashion, in each of the steps.
With respect to the system’s 183 interlockings, all on the A Division (the numbered subway lines) are currently in SOGR, but 40 on the B Division (the lettered lines) are not and require modernization. In addition, 34 interlockings currently in SOGR will require upgrades during the next 20 years to remain in SOGR and be compatible with CBTC. The needs assessment provides for these improvements over the 20-year period, but allocates funds in the first five years for only 13 interlockings with funding for 20 interlockings in each of the next three five-year plans.16 Thus all interlockings will not be ready for CBTC until after 2034. The adopted plan reduces the number of interlockings addressed in the next five years from 13 to 11, suggesting an even longer time frame may be required for complete upgrading.
Creating a central facility for monitoring train locations and controlling track routes has proven difficult and has encountered indefinite delays. Prior to the 1960s each interlocking was controlled by an independent tower operator. Subsequently, towers were consolidated into 30 “master towers,” and in the mid-1990s the consolidation of interlocking controls to one central point was initiated. The new system, known as Automatic Train Supervision (ATS), provides information on the location of trains and centralized control of the interlockings. The benefits of ATS include integrated voice communication, automatically developed train routing based on field conditions, centralized management for improved on-time performance, and improved safety.
ATS was planned for implementation in two stages: first, the A Division, followed by the B Division. Completing the A Division ATS required 11 years, from 1997 to 2008, with significant delays and cost overruns.17 Installation of a similar system on the B Division has been delayed indefinitely due in part to the aged condition of its interlockings and other signal equipment. No plan now exists for centralized interlocking control on the B Division; the B Division improvements now underway are sufficient communication capacity to support public address systems and customer information signs often referred to as “countdown clocks.” These limited improvements are partially funded in the 2010-2014 plan, and the needs assessment and adopted plan allocate funding to complete them in the 2015-2019 plan.
The installation of CBTC capacity is proceeding in stages, but the stages identified to date cover only part of the system and leave much of the conversion for after 2034 on an unspecified schedule. The first stage was conversion of the Canarsie (L) line, selected because it has no direct track connections with other lines and could be converted in relative isolation with no impact on other operations. The initial contract was awarded in late 1999 with completion scheduled for 2004. The work was not actually completed until 2009 with full operations hindered until 2011 due to delays in delivery of cars with CBTC capacity.18
The second stage, currently underway, is installation on the Flushing (7) line, also a route with no direct track connection to other lines. The project began in 2003, but phases were delayed during the 2005-2009 capital plan due to funding inadequacies.19 Additional funding was provided in the 2010-2014 plan; the most recent review indicates it will be completed in the second quarter of 2017 – an overall installation period of about 14 years.20
Because the Canarsie and Flushing lines are the only isolated routes, subsequent CBTC conversion will take place on routes that must be interoperable with other routes not equipped with CBTC. The first such section is the Queens Boulevard segment, the track running from the Kew Gardens station in Queens to the Seventh Avenue station in Manhattan. Initial funding was provided in the 2010-2014 plan, and additional funding is allocated in the needs assessment and the 2015-2019 plan. The contract is scheduled to be awarded in 2015, but no estimated completion date is specified yet.21
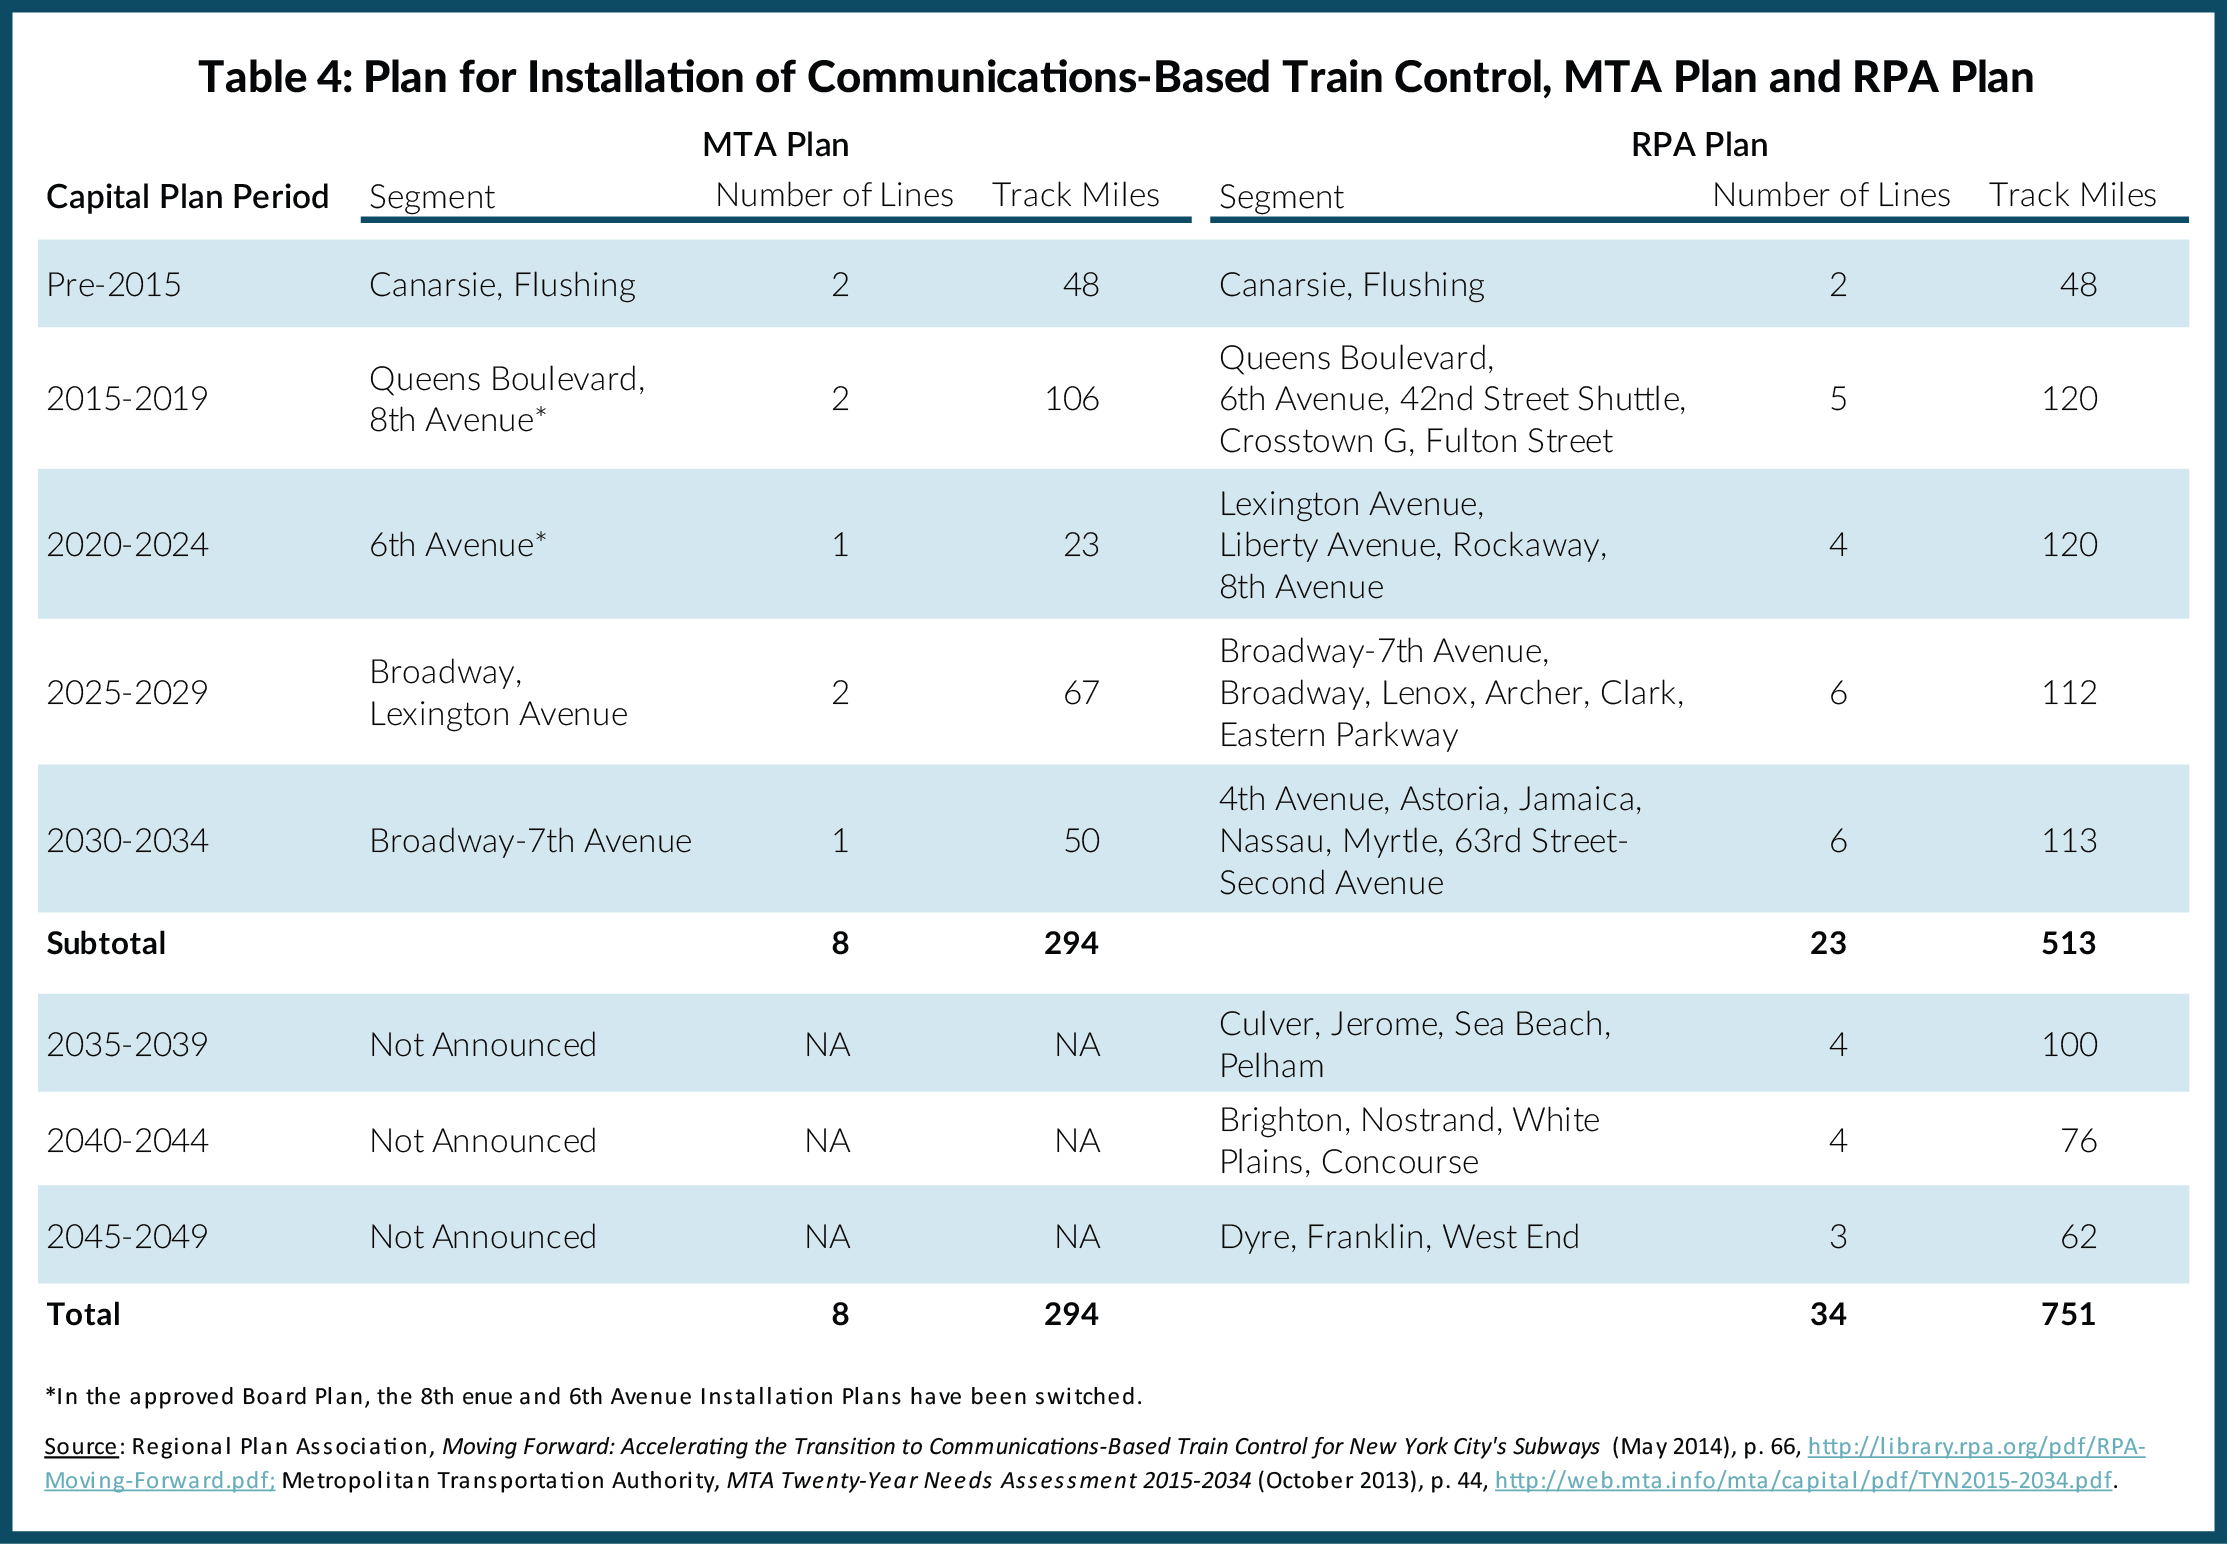
The needs assessment provides for faster progress in CBTC installation, but still at a measured pace. As shown in Table 4, full conversion can be planned in phases involving 34 segments of track routes. One of these segments (Canarsie Line) is completed and a second (Flushing Line) is nearly completed. The MTA needs assessment addresses 6 of 32 remaining segments; two (including Queens Boulevard) in the 2015-2019 plan, one in the 2020-2024 plan, two in the 2025-2029 plan, and one in the 2030-2034 plan. No schedule is identified for the remaining segments. Based on the Regional Plan Association’s (RPA) analysis, the historic pace of installation has been four track miles per year; the implicit planned pace in the needs assessment would be about 16 miles per year.22 However, even if that pace were continued beyond the 20-year period, complete conversion would not occur until 2057 – about 60 years after the project began. Moreover, the adopted plan revised the goal for 2015-2019, substituting a Sixth Avenue segment for an Eighth Avenue segment, lowering the track miles improved (including the Queens Boulevard segment) in the next five years from 106 to 54.23 The funds designated for communication and signals at NYCT were reduced $815 million from the needs assessment to the adopted plan.
A faster pace is highly desirable; RPA has identified a feasible and more rapid schedule. (See Table 4.) This plan would accomplish installation on 23 of the 32 remaining segments in the next 20 years, including five (as opposed to the MTA’s two) in the next five-year plan. By 2034 the RPA plan would convert 513 track miles to CBTC compared to 294 miles under the MTA plan. The MTA should embrace this more ambitious schedule and provide the necessary funding in the 2015-2019 plan.
As with SOGR work, the MTA’s pace of conversion to CBTC is a function of its leaders’ judgment about the riding public’s tolerance of disruptions in service, the availability of multiple qualified contractors to compete for the work, and its own capacity to manage contracts. Nonetheless, a faster pace seems feasible, and the MTA can work to overcome these factors.
Inadequate Planning and Management Capacity for Expansion Projects
Given the important role mass transit plays in the regional economy, some expansions and enhancements to the system are likely to have strong economic and environmental benefits. Local organizations and the MTA have identified several desirable large-scale projects. These include the second stage of the Second Avenue subway, a new station at Tenth Avenue of the 7 Line Extension, additional MNR stations in the Bronx and MNR access to Penn Station, and extension of the 7 Line to Secaucus, New Jersey.
The 2013 needs assessment focused on the needs of the current system and therefore did not include expansion projects; the adopted plan includes $5.5 billion for expansion projects including $2.8 billion for continued work on the East Side Access (ESA) project connecting the LIRR to Grand Central Terminal, $1.5 billion to begin work on phase two of the Second Avenue Subway, and $743 million to begin work on Penn Station Access, a project to build new stations for the MNR in the Bronx and have it serve Penn Station. In addition expansions of service for the LIRR are embedded in ongoing needs investments such as creation of a second track on portions of its mainline.
The MTA’s expansion efforts have two deficiencies – lack of clear priorities for selecting projects and weak capacity for implementing projects efficiently. Given the multiple possibilities for beneficial expansion of the transit system, explicit criteria should be established for selecting priority projects and evidence should be considered as to how well a range of potential investments meet these criteria. The MTA’s recent commitment to the second phase of the Second Avenue Subway and to the Penn Station Access project did not follow such a process. The commitment of $743 million to the Penn Station Access project seems particularly premature; its total cost has not been reported, its benefits have not been quantified, and it is not clear why it is preferred over other projects previously discussed.
The ESA project is a dramatic example of the MTA’s limited ability to implement projects efficiently. It was approved in 2000 at an estimated cost of $6.3 billion to be completed by August 2014.24 Multiple delays and re-estimates have pushed completion to 2023 and the cost to $10.8 billion. Although the project was expected to have been fully funded with its allocation in the 2010-2014 plan, an additional $2.6 billion had to be allocated in the 2015-2019 plan.
A prudent course for the MTA would be to postpone commitment to new expansion projects until an improved planning process is established and used to assess multiple potential projects. In addition attention should be given to rethinking the management of large-scale projects, especially those for expansion and for improvements in the signal and communication systems, to promote more effective implementation.
Download Report
Misplaced Priorities in the MTA's Capital PlanFootnotes
- Metropolitan Transportation Authority, MTA Capital Program 2015-2019 (September 2014), p. 40, http://web.mta.info/capital/pdf/Board_2015-2019_Capital_Program.pdf.
- The Capital Program Review Board (CPRB) has four voting members representing the governor, the majority leaders of the Assembly and Senate, and the mayor of New York City. Each has veto power. The Board also has two non-voting members representing the minority leaders of the Assembly and Senate.
- Joan McDonald, Letter to Thomas F. Prendergast, “Capital Program Veto Letter,” (October 2, 2014; accessed October 20, 2014), www.scribd.com/doc/241839626/Capital-Program-Veto-Letter.
- Metropolitan Transportation Authority, MTA Twenty–Year Capital Needs Assessment 2015-2034 (October 2013), p. 33, http://web.mta.info/mta/capital/pdf/TYN2015-2034.pdf.
- Metropolitan Transportation Authority, Twenty-Year Capital Needs Assessment 2010-2029 (August 2009), p. 25.
- Metropolitan Transportation Authority, MTA Twenty-Year Capital Needs Assessment 2015-2034 (October 2013), p. 58, http://web.mta.info/mta/capital/pdf/TYN2015-2034.pdf.
- Metropolitan Transportation Authority, MTA Capital Needs Assessment 2000-2019 (1999), p. 40.
- Metropolitan Transportation Authority, MTA Twenty-Year Capital Needs Assessment 2015-2034 (October 2013), p. 78, http://web.mta.info/mta/capital/pdf/TYN2015-2034.pdf.
- Metropolitan Transportation Authority, MTA Capital Program 2015-2019 (September 2014), p. 16, http://web.mta.info/capital/pdf/Board_2015-2019_Capital_Program.pdf; Metropolitan Transportation Authority, MTA Twenty-Year Capital Needs Assessment 2015-2034 (October 2013), p. 37, http://web.mta.info/mta/capital/pdf/TYN2015-2034.pdf; and telephone conversation with Stephan Berrang, Director of Capital Program Management, Metropolitan Transportation Authority, (October 15, 2014).
- Metropolitan Transportation Authority, MTA Capital Program 2015-2019 (September 2014), p. 58, http://web.mta.info/capital/pdf/Board_2015-2019_Capital_Program.pdf; Metropolitan Transportation Authority, MTA Twenty-Year Capital Needs Assessment 2015-2034 (October 2013), p. 41, http://web.mta.info/mta/capital/pdf/TYN2015-2034.pdf.
- Metropolitan Transportation Authority, MTA Capital Program 2015-2019 (September 2014), p. 77, http://web.mta.info/capital/pdf/Board_2015-2019_Capital_Program.pdf; Metropolitan Transportation Authority, MTA Twenty-Year Capital Needs Assessment 2015-2034 (October 2013), p. 62, http://web.mta.info/mta/capital/pdf/TYN2015-2034.pdf; and telephone conversation with Stephan Berrang, Director of Capital Program Management, Metropolitan Transportation Authority, (October 15, 2014).
- Metropolitan Transportation Authority, Capital Needs Assessment 2000-2019 (1999), p. 20.
- Metropolitan Transportation Authority, MTA Twenty–Year Capital Needs Assessment 2015-2034 (October 2013), p. 41, http://web.mta.info/mta/capital/pdf/TYN2015-2034.pdf.
- Metropolitan Transportation Authority, MTA Twenty-Year Capital Needs Assessment 2015-2034 (October 2013), p. 57, http://web.mta.info/mta/capital/pdf/TYN2015-2034.pdf. Of the $1.1 billion total, $160 million is allocated in 2015-2019.
- Metropolitan Transportation Authority, MTA Twenty-Year Capital Needs Assessment 2015-2034 (October 2013), p. 71, http://web.mta.info/mta/capital/pdf/TYN2015-2034.pdf. Of the $2.3 billion total, $433 million is allocated in 2015-2019.
- Metropolitan Transportation Authority, MTA Twenty-Year Capital Needs Assessment 2015-2034 (October 2013), p. 44, http://web.mta.info/mta/capital/pdf/TYN2015-2034.pdf.
- Citizens Budget Commission, Working in the Dark: Implementation of the Metropolitan Transportation Authority’s Capital Plan (October 2009), p. 21, www.cbcny,org/sites/default/files/report_mta_10202009.pdf.
- Regional Plan Association, Moving Forward: Accelerating the Transition to Communications-Based Train Control for New York City’s Subways (May 2014), p.45, http://library.rpa.org/pdf/RPA-Moving-Forward.pdf.
- Citizens Budget Commission, Working in the Dark: Implementation of the Metropolitan Transportation Authority’s Capital Plan (October 2009), p. 25, www.cbcny,org/sites/default/files/report_mta_10202009.pdf.
- Metropolitan Transportation Authority, Capital Program Oversight Committee Meeting Book (November 2013), p. 39, http://web.mta.info/mta/news/books/pdf/131112_1345_CPOC.pdf.
- Metropolitan Transportation Authority, Capital Program Oversight Committee Meeting Book (November 2013), p. 45, http://web.mta.info/mta/news/books/pdf/131112_1345_CPOC.pdf.
- Regional Plan Association, Moving Forward: Accelerating the Transition to Communications-Based Train Control for New York City’s Subways (May 2014), p.48, http://library.rpa.org/pdf/RPA-Moving-Forward.pdf.
- Metropolitan Transportation Authority, MTA Capital Program 2015-2019 (September 2014), p. 61, http://web.mta.info/capital/pdf/Board_2015-2019_Capital_Program.pdf.
- Citizens Budget Commission, Working in the Dark: Implementation of the Metropolitan Transportation Authority’s Capital Plan (October 2009), p. 29, www.cbcny,org/sites/default/files/report_mta_10202009.pdf.