New York City Capital Spending: A Retrospective
Yesterday, Mayor Michael Bloomberg released a three-year progress report on PLANYC, an infrastructure and sustainability agenda for the next twenty years. The report indicates that 56 percent of the short-term milestones identified in the plan for greening the City, expanding parks and housing, and improving transportation and water systems have been completed.
PLANYC is broad in scope and vision, and the Bloomberg Administration has been distinguished by its ambitious capital program: over $63 billion was committed to capital projects from fiscal year 2002 through fiscal year 2009. This blog presents a "progress report" on that capital spending. The record is mixed: the City's capital stock expanded substantially, and the condition of some assets improved; on the other hand, substantial infrastructure needs persist. As the Mayor and New Yorkers contemplate the next generation of capital investment, a review of past expenditures is instructive for guiding future priorities.
What did $63 billion buy?
Capital commitments are recorded when a contract to procure an asset or undertake work is registered. Under Mayor Bloomberg, New York City's capital commitments through the end of fiscal year 2009 totaled $63.4 billion - almost $8 billion a year on average. Most of this spending occurred in the last four years (fiscal years 2006-2009), as the City's capital program grew in response to improved economic conditions and initiatives described in PLANYC.
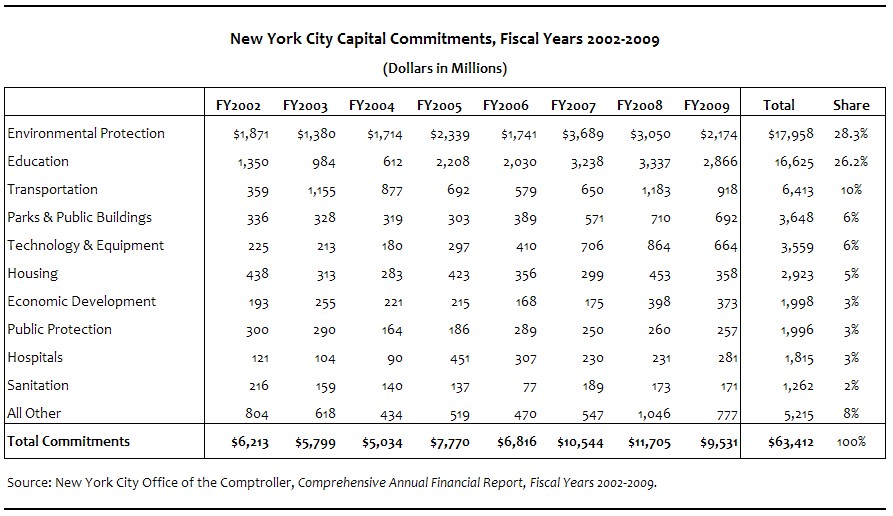
Two-thirds of this spending was concentrated in three areas: environmental protection (28 percent), education (26 percent) and transportation (10 percent). Environmental protection spending was directed toward the construction and upgrade of water and wastewater treatment facilities, the replacement of aged water mains, ongoing construction of the third water tunnel, and expansion of sewers. Increased investments in education were the result of a State agreement to match the City's financing for school construction, and were targeted toward renovating existing schools and increasing capacity to relieve crowding. Spending in transportation was devoted largely to repairing the City's roads and bridges.
While capital investment in these three areas reached record levels, all government functions benefited from increased spending. Total capital commitments between fiscal years 2002 and 2009 were one-third greater than total commitments for the prior eight years after adjusting for construction cost increases. The City spent approximately $3 billion or more to expand and enhance parks and recreational facilities, to upgrade technology and equipment citywide, and to create and preserve affordable housing. Almost $2 billion was spent on economic development projects, on correctional, police and fire facilities, and on hospitals and other health facilities.
This capital investment increased the value of the assets owned by New York City and its related authorities by almost 50 percent since 2002. New York City now owns $33.9 billion in capital assets compared to $18.7 billion in fiscal year 2002, an increase of over $15 billion and 80 percent. When including the value of land and other construction projects in progress, this total rises to almost $40 billion. In addition, public authorities under the City's control, which are also part of the City's capital portfolio, own $29.2 billion in assets, for a grand total of $69 billion - almost $22 billion more than in fiscal year 2002.
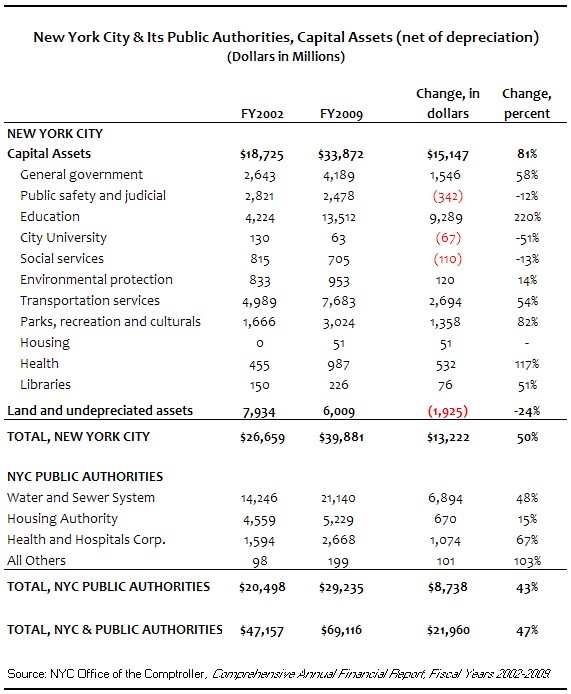
As would be expected, most of the increased asset value is in the three areas where the City spent most of its capital dollars. Investments to expand and improve primary and secondary school facilities have more than tripled the value of schools from $4.2 billion in 2002 to $13.5 billion in fiscal year 2009. As a result, education assets now comprise 40 percent of the value of the City's capital stock, compared to 23 percent in fiscal year 2002. The capital assets of the water and sewer system increased by $6.9 billion, or 48 percent, and improvements to the transportation networked added $2.7 billion in value.
The net value of the City's assets has not increased by the full amount of spending because their value is decreased annually to reflect depreciation, which is an accounting adjustment for the use and declining value of an asset over time. Depreciation is a significant expense: it was approximately $2.3 billion for City-owned assets in fiscal year 2009. Annual depreciation costs totaled $16.4 billion between fiscal years 2002 and 2009 for City-owned assets, significantly offsetting gains in asset value due to new projects.
Large infrastructure needs persist
While some capital spending is devoted to purchasing or constructing new assets, a large part is dedicated to repairing and upgrading current facilities - what is known as bringing assets to a "state of good repair." Achieving a state of good repair has been a central aim of the City's capital agenda for the past two decades and is a goal that Mayor Bloomberg explicitly endorsed for major infrastructure, i.e. transportation and water and sewer systems, in PLANYC. The City Charter requires that the City report yearly on the spending required to reach a state of good repair in the Asset Information Management System (AIMS) report. The AIMS report is incomplete - it excludes assets with a replacement value of less than $10 million and larger assets such as the water and sewer system - but it provides a useful indicator of the magnitude of spending necessary.
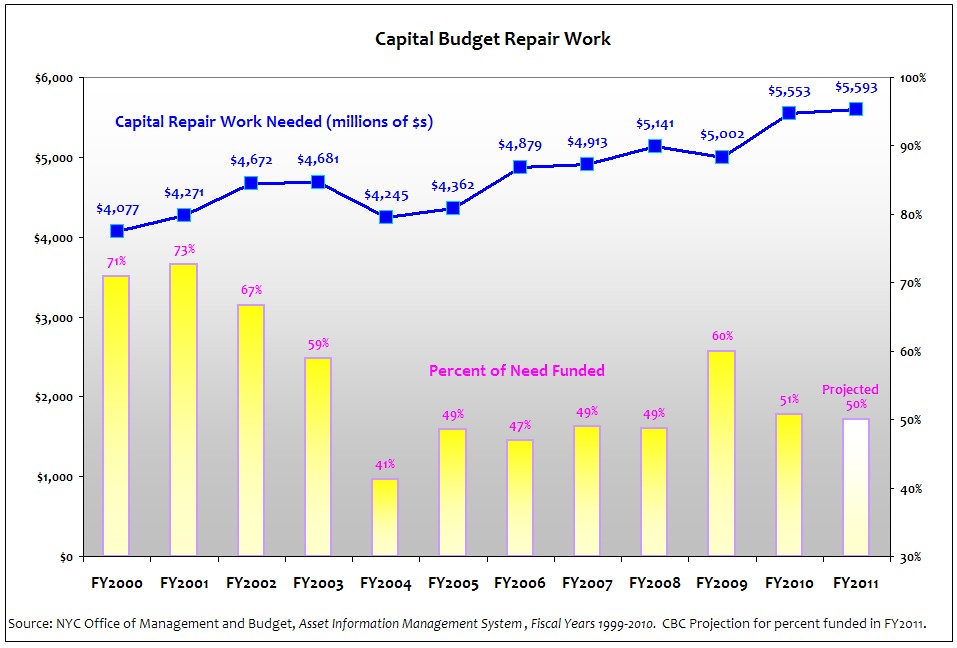
The most recent report, projecting needs for fiscal year 2011, was released in December 2009. It shows that the City has not made substantial progress in overcoming its maintenance backlog; in fact, it may be falling further behind. The AIMS report indicates that $5.6 billion of capital work is needed to bring the assets surveyed to a state of good repair. To put this in perspective, this amount is 16 percent of the net value of all City-owned assets and approximately 55 percent of the City's capital budget for the current fiscal year.
The amount required has increased from fiscal year 2000, when needed capital repairs totaled $4.1 billion. As the cost of needed repairs has increased by 36 percent, the funding devoted to addressing these requirements has decreased. In the last fiscal year, funding for AIMS capital work totaled $2.8 billion - approximately half of what was required. Reluctance to fully fund AIMS requirements has resulted in a funding gap that has grown from 29 percent to 49 percent of the needed work over time. Agency reports describing how much state of good repair work will be undertaken in fiscal year 2011 are due to be released at the time of the Executive Budget; if recent trends are any indication, only half of the necessary work will be funded.
Assessing Outcomes
What do these figures mean to the average New Yorker? The City does not do extensive reporting on the outcomes of capital spending, and few performance indicators related to capital assets are presented in the Mayor's Management Report (many were eliminated after last year's restructuring of the MMR). The City also does not routinely collect data from citizens on their satisfaction with infrastructure or services provided; however, a Citywide Customer Survey was conducted in 2008. The following summarizes available data to make three points about the impact of capital investments under Mayor Bloomberg.
1. There has been progress in improving some assets, notably bridges, schools and parks.
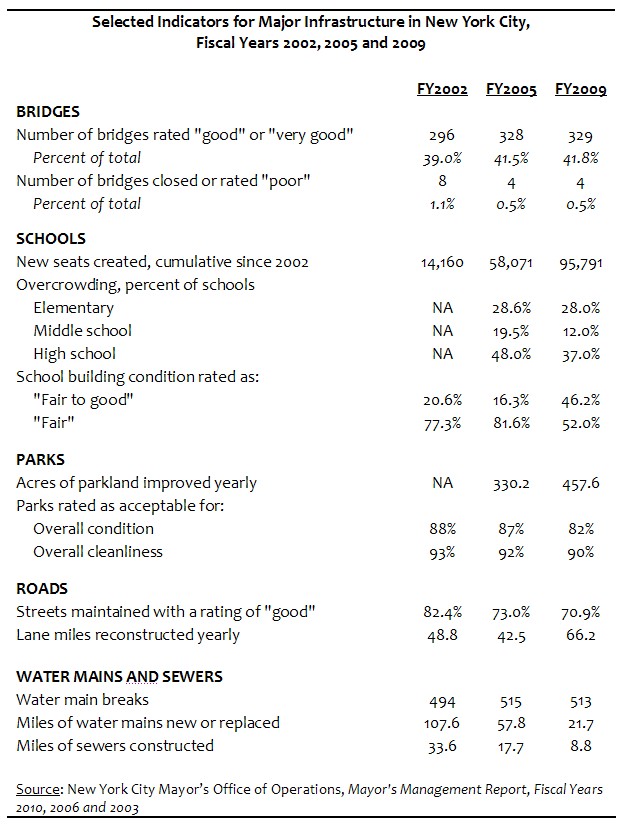
- Bridges - The number bridges rated by engineers as in poor condition decreased from 8 to 3 since 2002; however, one bridge has been closed since 2007, two have partial lane closures, and seventeen operate with weight restrictions. The economic downturn has resulted in an 18 percent decrease in bridge maintenance and repairs.[1] Nevertheless, the overall condition of bridges has improved; the number of bridges rated "good" or "very good" condition increased from 296 in 2002 to 329 - about 42 percent - in 2008.[2]
- Schools - Approximately 100 new schools and additional facilities[3] were constructed between fiscal years 2002 and 2009, producing an estimated 95,800 new seats and alleviating crowding at intermediate and high schools. Nevertheless, crowding persists in 38 percent of high schools, 28 percent of elementary schools and 12 percent of intermediate schools. The condition of existing school buildings has also been improved. In 2002, more than three-quarters of all school facilities were rated in "fair" condition, meaning substantial repairs were needed; by 2009, only 52 percent remained in fair condition. The percentage of buildings in "fair to good" condition increased from 20 percent in 2002 to 46.2 in 2009. The backlog of hazardous building violations decreased dramatically from 2,200 to 163 in the same time period.[4]
- Parks - Increasing parkland and recreational space was a key initiative under the PLANYC agenda. The number of acres of parkland improved increased from 322.6 in fiscal year 2004 to 457.6 in fiscal year 2009, peaking at 739.8 in fiscal year 2007. The percentage of parks rated as "acceptable" by departmental inspectors has averaged 86 percent for overall condition and 91 percent for overall cleanliness since fiscal year 2002. The percentage of monuments receiving annual maintenance increased from 16 percent in fiscal year 2002 to 71 percent in fiscal year 2009. The City also continued to add miles of greenways and increased its efforts to plant trees.[5]
2. The condition of some infrastructure, including roads, water mains and sewers, has not improved significantly - or has actually deteriorated - despite additional spending.
- Roads - In contrast to bridges, the percentage of streets maintained with a rating of "good" decreased from 82.4 percent in fiscal year 2002 to 70.9 percent in fiscal year 2009. The number of lane miles reconstructed increased from 48.8 in fiscal year 2002 to a high of 75.8 in fiscal year 2007, but fell to 66.2 in fiscal year 2009 and are down to an estimated 34.3 in fiscal year 2010.[6] Even though more than 2 million potholes have been filled during the Mayor's tenure, citizens remain highly dissatisfied with the condition of roads: in the 2008 survey, only 39 percent of respondents considered the maintenance of streets and roads in their neighborhoods "good" or better. [7]
- Water mains and sewers - Despite increased investment, improvements of two key components of the water and sewer system have lagged. The number of water main breaks increased from 494 in fiscal year 2002 to 513 in fiscal year 2009. The number of miles of water mains that are new or have been replaced plummeted to an estimated 21.7 in fiscal year 2009 from 107.6 in fiscal year 2002. Sewers are also being reconstructed and replaced at a slower pace. Whereas 33.6 miles of sewers were constructed and 38.5 miles were reconstructed in fiscal year 2002, only 8.8 miles and 7.5 miles were constructed and reconstructed in fiscal year 2009.[8]
3. The impact of other investments cannot be determined.
- Economic development - Spending on economic development totaled $2 billion between fiscal years 2002 and 2009 and the pace of spending is expected to increase, with close to an additional $2 billion slated for spending in the next four fiscal years. These investments include large projects like the development of Willets Point and Coney Island, as well as less ambitious projects to upgrade landscaping and infrastructure in specific local areas. The rationale for making such investments is that they will generate new economic activity in the city; however, little or no analytic evidence of such benefits is publicly available. This is especially true of smaller projects, which are sometimes undertaken at the behest of elected officials and are often lumped together under a larger appropriation, making tracking the costs and benefits of individual projects difficult.
In sum, the investments of the last decade have produced some noteworthy results in terms of expanding the City's infrastructure and improving the condition of key capital assets; nevertheless, administrative data and citizen sentiment indicate that more work is needed. Despite an unprecedented level of spending, the investments necessary to fix and maintain all our infrastructure properly have not been made.
Footnotes
- PLANYC. PLANYC Progress Report 2010. April 2010. See page 43.
- New York City Department of Transportation. 2008 Bridges and Tunnels Annual Condition Report.
- New schools and additions as reported in the Preliminary Mayor's Management Report, Fiscal Year 2010.
- New York City Mayor's Office of Operations. Preliminary Mayor's Management Report, Fiscal Year 2010.
- New York City Mayor's Office of Operations. Preliminary Mayor's Management Report, Fiscal Year 2010.
- New York City Mayor's Office of Operations. Preliminary Mayor's Management Report, Fiscal Year 2010.
- New York City Mayor's Office of Operations.NYC Feedback: Citywide Customer Survey.December 2008.
- New York City Mayor's Office of Operations. Preliminary Mayor's Management Report, Fiscal Year 2010.