Getting the Facts Straight on Metropolitan Transportation Authority Fare Ratios
In recent weeks transit analysts and advocates have referred to the share of expenses for subway, bus or commuter train rides covered by the relevant fares (called “fare ratios”) to comment on and critique the MTA’s proposed fare increase options. Fare ratios as low as 36 percent and as high as 76 percent have been cited.
What the ratio ought to be is an important policy decision about which reasonable people can disagree. But confusion over what the current ratio actually is clouds the conversation. The purpose of this blog post is to provide a common set of facts to inform the debate. It describes the different ways of calculating MTA fare ratios and of comparing the MTA ratios to those of other systems.
Multiple Measures for the MTA
Table 1 summarizes calculations of fare ratios for 2011 by three organizations – the MTA, the Citizens Budget Commission (CBC), and the National Transit Database (NTD) maintained by the U.S. Department of Transportation. The MTA data are presented by staff to the MTA Board at monthly meetings. The NTD collects figures from the MTA (and other major transit operators in the U.S.) and makes data available at their website. The CBC data are calculated by CBC staff from audited financial statements of transit operators; they have been used in CBC publications but are not otherwise generally obtainable. For any specific service, up to four different ratios are available.
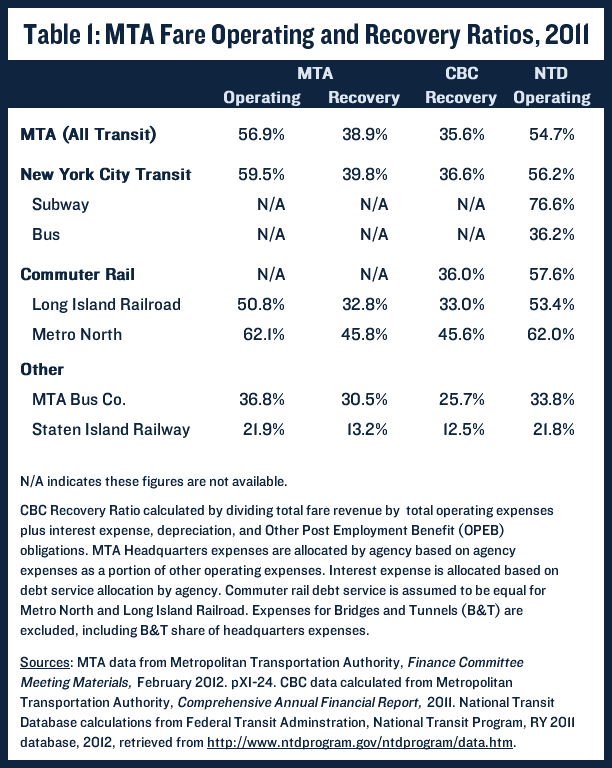
The four different ratios use virtually identical numbers for the fare component. (Minor differences may exist because the CBC uses audited data released after the year ends, while the MTA reports estimates during the year.) The NTD provides separate ratios for New York City Transit (NYCT) subway and bus services; the CBC and MTA ratios do not separate these services. The MTA and CBC treat the NYCT services as a single system with one fare that permits transfers among multiple subway lines and bus routes; the fare is viewed as earned by the system rather than a particular subway or bus service. However, to comply with the NTD request that participating transit agencies allocate fare revenues between subway and bus services, the MTA calculates an average fare revenue per trip for the combined system, and then allocates the revenue using the average fare and the number of trips on subways and buses. (In counting trips by subways and buses, the MTA defines a trip as a Metrocard swipe; that is, transfers among subway lines are not counted as separate trips, but transfers between subways and buses are counted as separate trips.) Since the allocation uses the same average revenue per trip for subways and buses, the difference in the fare ratios between the two modes is a function of the expenses per trip and not the revenue per trip. Since operating costs per trip are much higher on the buses than on subways, the NTD ratio for subways is much higher than for buses despite the common fare policy.
The ratios differ significantly in the expense figures used as the denominator. The “operating ratios” (OR) calculated by the MTA and the NTD use only expenses defined as direct operating expenses. These include cost of personnel, supplies, energy and other similar items; they exclude two substantial categories of expenses – those related to capital and those accrued for retiree health insurance. The capital costs are depreciation and interest on long-term debt under GAAP or debt service (principal and interest payments) using cash accounting methods. The retiree health insurance costs, defined in accounting terms as Other Post Employment Benefits or OPEB, have been required to be reported as an expense under Generally Accepted Accounting Principles (GAAP) since 2007, and the MTA complies with this requirement. (The MTA budgets uses cash accounting, but prepares financial plans and has audited financial statements using GAAP.) Both the CBC and MTA “recovery ratios” (RR) define expenses using the GAAP approach and include OPEB and capital expenses along with operating expenses; however, the CBC expense figures are from the audited financial statement and are higher for OPEB and interest expense than the MTA’s budget figures. Neither the MTA nor the CBC calculates separate RRs for NYCT subway and bus services for the reason explained above.
This explanation of the various measures suggests two important caveats for users of the data.
- Be aware of whether the indicator is an OR or an RR. ORs will be notably higher than RRs, because they do not include all expenses related to providing services.
- Be cautious in using separate ratios for NYCT subways and buses. The unusually high subway OR (77 percent) is accompanied by an unusually low bus OR (36 percent), due to the way fares are allocated between those services and the higher per trip operating costs for buses. The more meaningful figures are the combined NYCT OR of 56 percent and RR of no more than 40 percent.
The Comparative Data
The NTD has long been the standard source for comparative data about transit systems. Its information about ridership, staffing, performance and equipment are widely accepted as the best available source for the nation’s transportation agencies. However, some limitations apply to its financial data, particularly expenditures data. These limitations stem, in part, from the variety of types of agencies that operate transit facilities. Some are agencies of general governments such as state or county transportation departments; others are independent public authorities. The financing and accounting systems for these types of agencies vary, primarily with respect to sources of capital. Some, notably the authorities, have independent borrowing capacity and raise much of their capital investment funds by issuing their own bonds. Others, typically agencies of general governments, get their capital investment funds through appropriations from the general government. Given these variations, the NTD has not collected data about capital investments and related capital expenditures such as depreciation and debt service. The NTD also has not requested data relating to unfunded OPEB obligations.
Given these limitations, the NTD can only provide ORs; it cannot provide RRs. There is no single, comprehensive source of data to support calculation of RRs for multiple systems nationwide. However, the CBC has analyzed the audited financial reports of the five largest heavy rail systems in addition to the MTA. In each case the systems are operated by public authorities, and the financial statements provide data comparable to that of the MTA, including the capital and OPEB expenses needed for calculating RRs. The NTD ORs and the CBC RRs for the MTA and these five systems are shown in Table 2.
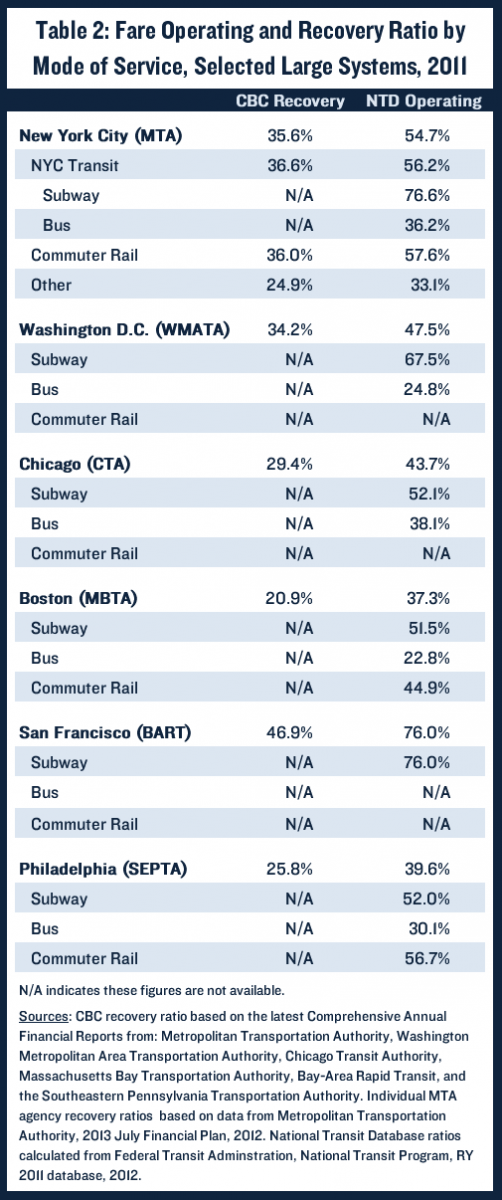
Analysis of NTD ORs has generally led to the conclusion that the MTA’s OR is higher than that of other systems. The most meaningful NTD figure, the NYCT combined subway and bus OR of 56 percent, is higher than the comparable combined bus and subway figure in Washington, DC (48 percent) and in Chicago (44 percent). The combined figure for MTA transit and commuter rail systems of 55 percent is higher than the figure for the Boston (37 percent) and Philadelphia (40 percent) systems which also includes commuter lines. However, for the San Francisco BART system, which only operates heavy rail, the OR of 76 percent is higher than the NYCT figure of 56 percent and comparable to the problematic NYCT subway figure, at 77 percent.
The CBC RRs point in a similar direction, but do not support the conclusion as strongly as the ORs. The BART RR of 47 percent is higher than the figure for NYCT of 37 percent, although a figure for NYCT subways only is not available. The NYCT figure is only slightly higher than Washington, DC (34 percent) but notably higher than Chicago (21 percent). For comparisons of systems with transit and commuter rail services, the MTA figure, at 36 percent is higher than the Philadelphia (26 percent) and Boston (21 percent) figures.
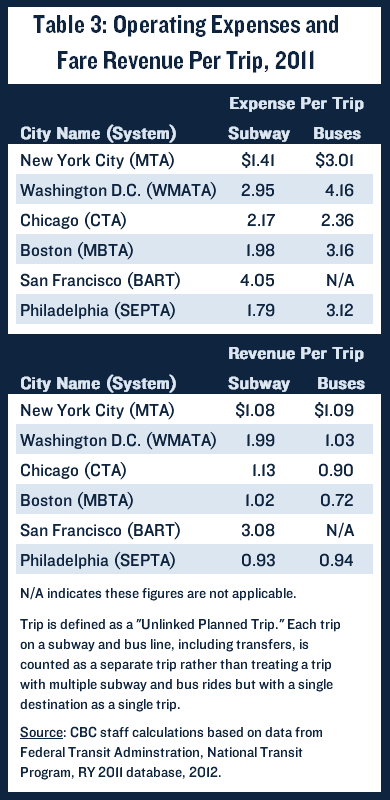
It is important to observe the MTA’s relatively high ratios are related primarily to relatively low operating expenditures rather than to relatively high fare revenue. The high volume on MTA services helps makes its operating costs per trip comparatively low. Table 3 presents the average operating expense per trip using NTD data for operating expenses and trips for subways and buses for the six systems for which the CBC calculated RRs. It is important to note that the NTD uses a common definition of trip for all systems, the “unlinked planned trip,” and that definition differs from the MTA definition described above. The NTD counts each trip on a different subway and bus line as a separate trip. For example, a passenger transferring from one subway line to another would have the ride counted as two NTD trips, while the MTA counts it is as just one trip because it requires only one swipe of a Metrocard. Accordingly, the number of trips reported for the New York system by NTD is substantially greater than reported by the MTA, and the NTD reported cost per trip and revenue per trip is also lower than reported by the MTA. While the NTD definition of trips differs from the MTA definition, the NTD data are the only reliable basis for comparative statistics. Based on the NTD common definitions, the operating cost per subway trip in New York is well below that in all the other systems, and the cost per bus trip is below that of three other systems. The comparative revenue per trip figures from NTD in Table 3, based on the same problematic allocation of revenue to subways and buses described earlier, as well as the NTD definition of an unlinked trip, suggest that the revenue generated by fares per subway trip is actually lower in New York than in three of the other five systems despite the lower NTD ORs for those systems.
In sum, data relating fare revenue to expenditures can help inform policy debates about future fares at the MTA. But it is important in citing such data to be clear about what is being measured and how the figures might be misinterpreted. Avoiding squabbles over the “correct” figures can facilitate the more important discussion about the appropriate role of fares in financing mass transit.