Economic Development Reporting in New York City: What’s Missing?
The bidding war between New York and New Jersey over the relocation of FreshDirect recently ended with New York City and State putting together a “winning” $125 million incentive package for the firm to move and expand into the Harlem River Yards in the Bronx.[1] The battle over FreshDirect is an example of unsound “race to the bottom” economic development policies, pitting states against one another with the eventual outcome benefiting the pursued firm rather than taxpayers in either jurisdiction. Economic development officials defend these types of incentive packages on the basis that benefits from the firm’s retention and/or expansion outweigh the costs. Efforts to hold these officials and companies accountable take the form of reporting requirements capturing the anticipated costs and benefits. In New York City, current reporting requirements fall short of capturing the full amount of spending in the name of economic development.
Current Reporting Requirements
The City’s efforts to enhance reporting on economic development spending began in 1993 with Local Law 69 (LL69). It required that development corporations issuing local tax incentives and other benefits publish an Annual Investment Projects Report identifying the costs and benefits of each project that received more than $250,000 in city-provided benefits or was expected to result in retention or creation of 25 or more jobs. The New York City Economic Development Corporation (EDC), a quasi-governmental organization that operates under a contract with the Department of Business Services as the city’s economic development vehicle, is responsible for filing this report.
LL69 required the Annual Investment Projects Report include information on the type, length, and amount of assistance for an eight-year period after the initiation of the project. Types of assistance included in the report are property tax exemptions net of Payments in Lieu of Taxes (PILOTs)[2], property and local sales tax abatements and exemptions, and the local interest subsidy on tax-exempt bonds. Reported benefits in the Annual Investment Projects Report include jobs created or retained and a projection of additional tax revenue to the city. The report represented a step in the right direction, but suffered from limitations in how benefits were calculated and in the duration of costs to the city included in the analysis.[3]
In 2005, in response to deficiencies in the annual report, Local Law 48 (LL48) was enacted. LL48 enhanced the Annual Investment Projects Report by extending the period for calculating assistance to all years in which firms receive benefits, more clearly identifying costs and benefits to be reported for each project, and reducing the calculated tax revenue benefits to the city from retained tenants. Local Law 62 (LL62), enacted in November of 2010, is the most recent effort to enhance the Annual Investment Projects Report by increasing the availability of reported information through a required non-proprietary database available for public use.
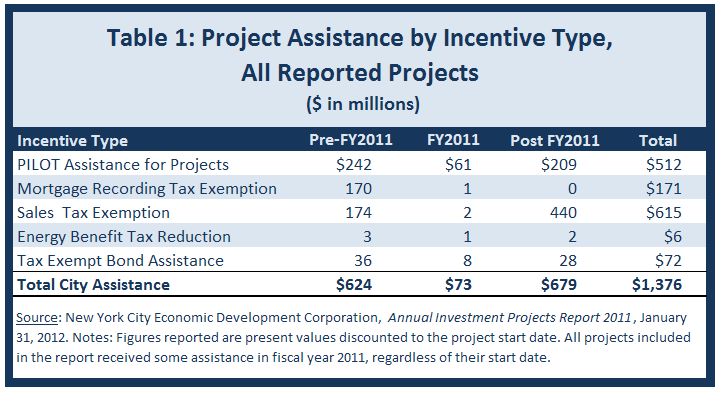
The most recent and comprehensive annual report, covering 2011, outlines nearly $1.4 billion in assistance provided to more than 620 development projects over their lifespans. Nearly $73 million of this assistance was given out in fiscal year 2011, about $624 million was awarded in previous fiscal years, and more than $675 million is expected to be awarded in fiscal year 2012 and beyond[4]. The sources of these incentives are shown in Table 1.EDC estimates the city has received more than $20 billion in direct tax revenue from projects receiving assistance through fiscal year 2011 and will receive more than $9 billion in direct tax revenue in fiscal year 2012 and beyond. In fiscal year 2011 the ratio of direct tax revenue to reported city assistance was nearly 38 to 1. The report does not include a figure for the number of jobs created per year, but rather the number of jobs at application and the current number of jobs related to the projects assisted. Just over 90,000 new full time equivalent jobs have been created at these projects according to EDC. Given that close to $700 million in assistance has been provided by EDC on behalf of the city through 2011, each job created cost $8,000 according to their analysis.
So What’s Missing?
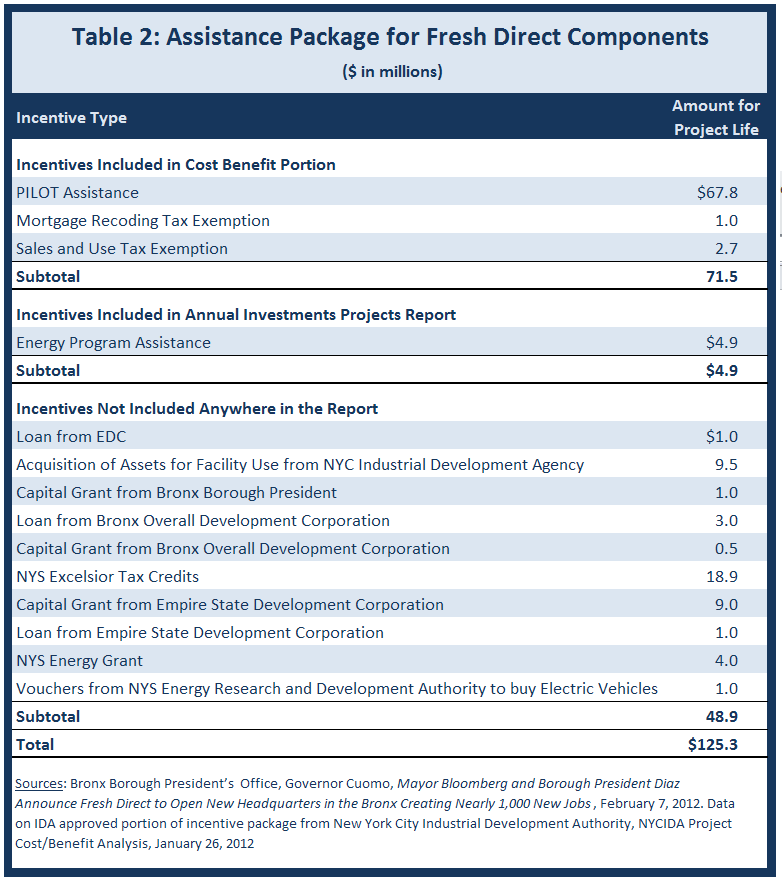
The problem with the report is best illustrated by looking at the recent FreshDirect incentive package, a project that will be included in next year’s report. Table 2 depicts the costs that will be included in the cost-benefit section of the report, costs that will be included in the report separate from the cost-benefit analysis, and costs that will not be included at all. Of the $125 million in incentives, only $71.5 million will be included in the cost-benefit analysis that should determine whether a project is worth supporting. Reporting requirements for the Annual Investment Projects Report are limited in three important ways.
First, several types of city assistance are missing from the cost-benefit analysis. The amount for energy benefits received for the project through EDC administered energy discount programs are included in the report, but not included in the cost-benefit analysis. Similarly, EDC includes two Department of Finance program costs in the report, but not the cost-benefit analysis. EDC explains that these programs - the Relocation and Employment Assistance Program (REAP) and the Commercial Expansion Program (CEP) - are not included in the cost-benefit analysis because they are not directly provided by EDC. Other sources of funding, such as EDC loans, asset acquisition by the Industrial Development Authority (IDA), City capital grants, and abatements for real property taxes through the Industrial and Commercial Abatement Program (ICAP), are not included in the report at all. These exclusions total $16.4 million, or 13 percent, of FreshDirect’s incentive package.
Second, EDC does not include state or federal assistance in their reporting of costs on grounds the analysis is limited to impacts on the City budget. The report does not include state benefits, such as state sales tax and mortgage recording tax exemptions, state tax credits from programs like Excelsior, capital grants and loans from the state development agency, state energy grants, and/or state interest subsidies from tax exempt bonds. In the FreshDirect example, these forms of assistance add up to $33.9 million, or 27 percent, of the total incentive package.
The third flaw is that City capital commitments are entirely excluded from the annual report. EDC averaged approximately $265 million a year in capital commitments over the past decade, a figure that dwarfs the $73 million in reported incentives in fiscal year 2011.[5] Despite the size of this figure, little is known about the analysis that goes into allocating City capital for EDC projects. These funds are allocated to EDC through the contract with the Department of Business Services.[6]
The nature of capital spending, which may impact multiple projects or neighborhoods simultaneously, makes a project based reporting format difficult. Still, there are projects that directly gain from capital commitments for site development, design, and construction; many revitalization projects or infrastructure enhancements are also undertaken with the purpose of enhancing the surroundings of large businesses or institutions or to redevelop commercial, industrial, or cultural spaces that serve several smaller institutions. These projects gain from capital commitments, but the lack of reporting on capital in the cost-benefit analyses in the annual report understates the full costs to the City in undertaking economic development activities.
One way the EDC can and should include these costs is to include in its cost-benefit analysis the debt service associated with project-related capital commitments, in the same way it includes the costs of PILOTs, sales tax exemptions, and other incentives. These changes and other relevant adjustments should be discussed by the methodology recommendation committee, created as part of Local Law 48. The committee, jointly selected by the Mayor and the City Council Speaker, was scheduled to meet biennially prior to March 1st and present its recommendations to the Mayor and Speaker; however, the committee has not been appointed nor convened since the law was enacted and represents a missed opportunity to enhance reporting measures.
Efforts to make the costs and benefits of the City’s economic development projects more transparent would help achieve better accountability and promote the extension of government funded benefits where they can be justified. EDC has made noteworthy strides in its reporting; more comprehensive reporting will enhance the quality of projects New York City funds as well as the mission of EDC: “Make the City Stronger.”
Footnotes
- Bronx Borough President’s Office, Governor Cuomo, Mayor Bloomberg and Borough President Diaz Announce FreshDirect to Open New Headquarters in the Bronx Creating Nearly 1,000 New Jobs, February 7, 2012, http://bronxboropres.nyc.gov/press/releases/2012-02-07.html.
- Payments in Lieu of Taxes are payments to New York City made by a firm in place of their exempt property tax liability.
- In 2001, an IBO report identified these deficiencies in the LL69 report: the use of an eight-year reporting period for incentives that last up to 20 years, no reporting on exemptions of interest income on IDA bonds, and including all real estate tax revenue from assisted projects on the assumption that no other economic activity would take place at the location. Source: New York City Independent Budget Office. Full Disclosure? Assessing City Reporting on Business Retention Deals, June 2001, www.ibo.nyc.ny.us/iboreports/locallaw69.pdf.
- Incentive periods range in length but can extend for up to 25 years for some tax abatement programs. Dollar projections are in present value terms for figures after the fiscal year in which the project began.
- This figure assumes that all capital spending categorized as “Economic Development” in the City’s capital commitment report over the past ten years has been overseen by EDC. Source: CBC analysis of capital commitments reported in the New York City Office of Management and Budget, Executive Budget, Fiscal Years 2003-2012.
- The data available show the agency receives its capital funds from the City, as EDC has not issued any bonds or notes for capital spending in fiscal year 2010 or 2011.