Righting the Ship
A Course Toward Fiscal Sustainability for the Region's Maritime Ports
This report analyzes the financial performance and outlook of the Port Authority of New York and New Jersey’s (PANYNJ) maritime ports and makes recommendations for “righting the ship” by mitigating recurring annual losses. This goal is important because the maritime ports play a vital role in the region’s economy; because current losses are substantial, about $100 million annually; and because losses will persist absent policy changes.
The report is divided into four major sections. The first provides historical background, explaining the role of the Port Authority and how its facilities fit in the broader scope of maritime activity in New York Harbor. The second describes the share of waterborne trade in the United States flowing through New York-New Jersey and identifies the reasons behind New York’s success. The third presents the financial performance of PANYNJ’s Port Commerce business line and projects future losses if current arrangements are not changed.
The final section recommends strategies to improve financial performance:
- “Rightsize” port capacity by closing underutilized facilities not needed to meet likely future demand, and
- Increasing revenue opportunities by supporting more competitive and productive terminal operations.
Background
Since the arrival of Dutch colonists in the 1600s, New York Harbor has been considered one of the greatest natural harbors in the world. Its orientation to the Atlantic Ocean, Hudson River, and later the Erie Canal, enabled New York to become the United States’ busiest shipping hub; by 1851 New York moved more goods by water than Boston, Baltimore, and New Orleans combined.1 Today it remains one of the largest ports in the United States.
Although economically successful, port activities were decentralized and disorganized. Most piers, docks, and wharves were built and operated privately. Manufacturers crowded the waterfront to minimize the distance between production and transportation. Public docks in Manhattan, Brooklyn, and New Jersey municipalities were staffed with political supporters, many who drew salaries without working. In the mid-1800s Manhattan and Brooklyn combined had more than 200 piers radiating from their shores.2
As part of a revised city charter, the City created the Department of Docks in 1870 to impose order on the harbor.3 The department’s comprehensive plan called for municipal construction and ownership of all new waterfront facilities, but a tepid commitment to harness development undermined its ability to run an efficient, reliable port. By the 1920s commissioners would lament City facilities’ inadequacy as their development did not keep pace with commerce in the region.4 In spite of these inefficiencies, the industry continued to flourish, fed by high demand for New York exports abroad and foreign goods in the city.
The Impact of Railroads
The development of the region’s maritime ports was shaped by the advent of the railroad and subsequent creation of privately-owned but publicly-regulated railroad networks. Railroads enabled goods to move over land relatively quickly and cheaply, and proximity to rail connections became an important competitive feature of maritime ports.
Docks in Manhattan and Brooklyn were not well-served by rail connections. The Long Island Rail Road (LIRR) had terminals along the East River and Long Island Sound, but its lines carried freight to Long Island and New England, not to destinations west of the Hudson River. Manhattan’s Hudson River piers were served by the West Side Line of the New York Central Railroad, which ran along the eastern bank of the Hudson River but did not cross the river until it reached Albany.5 Railroads connecting the rest of the country terminated in northern New Jersey. In order to take advantage of these railroads, shippers using docks in Manhattan and Brooklyn relied on railroad-owned barges—called “lighters”—to ferry cargo across the harbor, a considerable logistical undertaking.6
Limited freight rail service in New York could have shifted maritime activity to the New Jersey side of the Hudson, but federal regulatory policy mitigated its impact. The Interstate Commerce Commission (ICC) established freight rates, and for rail routes to and from both sides of the Hudson, ICC rates reflected the cost of barging the goods across New York Harbor. The common rate neutralized any price advantage to forgo barging by using a marine terminal on the New Jersey side of the Hudson River.
For many years New Jersey’s leaders were reluctant to seek a separate, lower rate. Because differential rates would increase the cost of shipping to New York, and because New Jersey’s maritime facilities were underdeveloped compared to New York’s, they feared shippers would bypass the region altogether, hurting both states. After decades of envying New York’s prosperous maritime trade, civic and business leaders in New Jersey sought a different deal. In 1916 the State of New Jersey petitioned the ICC for a lower freight rate for northern New Jersey.7
The ICC rejected New Jersey’s case; however, the commission urged leaders from both states to collaborate to remedy the region’s freight mobility limitations.8 This cooperation, counseled by the ICC, was a major factor leading to the creation in 1921 of what is now the Port Authority of New York and New Jersey (PANYNJ). The Authority’s initial charge was not to control marine terminals or manage the existing system. Rather, PANYNJ sought the efficient movement of freight across the harbor.
The Authority’s leadership addressed the railroad problem with a railroad solution. PANYNJ’s comprehensive plan included a network of beltways, spurs, and cross-harbor tunnels shared by all carriers. The plan appealed to Trenton and to Albany but failed to gain the support of the railroads. According to the railroads surrendering operation to a central coordinator—a primary tenet of PANYNJ’s plan—“undermined pressures for efficient delivery which were an important part of industry’s vitality.”9 Unable to stitch together a coordinated cross-harbor freight system without the cooperation of private railroads, the Port Authority shifted its attention to the construction of trans-Hudson automobile tunnels and bridges.10
While the Authority’s comprehensive rail plan did not survive, portions, particularly the cross-harbor rail connections, have captured the imaginations of policymakers for more than 90 years.11 The City of New York attempted to connect Brooklyn and Staten Island with a 10-mile tunnel underneath the Narrows in the 1920s. The City spent millions excavating shafts at either end of the tunnel in 1925, but the project lost momentum after its political champion, Mayor John Hylan, lost his bid for reelection.12 Rail tunnels returned to vogue in the 1980s after the only freight railroad span of the Hudson River south of Albany, the Poughkeepsie Bridge, closed in 1979. This forced freight trains to travel 132 miles north of New York City to cross the Hudson.
Then state legislator Jerry Nadler proposed a New York Harbor rail tunnel to avoid this detour and better connect Brooklyn’s waterfront to the rest of the port’s rail network. The latest iteration of this effort has been released in the form of a draft environmental statement by the Federal Highway Administration (FHS) and PANYNJ. The study examines 10 alternatives for improving the movement of freight across the harbor. The least expensive rail tunnel alternative is expected to cost $7 billion in 2012 dollars and require 10 years to complete. That rail tunnel would divert 8.1 million tons per year from Hudson crossings. Assuming all diverted traffic by weight goes by rail, the tunnel will move 221 rail cars per day, requiring more than $4,500 per car to cover the tunnel’s debt service.13 The plan will be discussed in public meetings before the Port Authority and FHA identify alternatives for further study in summer 2015.
PANYNJ and Marine Terminals
As previously noted, PANYNJ was not created with the intention of operating marine terminals. Rather, the Port Authority’s entry into the marine terminal business has largely been a story of takeovers of failing operations and a buildup of more successful operations at new sites in New Jersey. The Port Authority would craft and abandon plans for facilities in Hoboken and Jersey City in New Jersey and Jamaica Bay in Brooklyn during the 1920s and 1930s; however, the agency’s first foray in marine terminals began in 1944 when the State of New York asked the Authority to assume control of a grain terminal and adjoining pier near the Gowanus Canal. The dilapidated facility was bleeding cash, but leaders at the Authority were confident they could salvage the operation and prove the agency’s competence as a maritime terminal operator. In its first year under PANYNJ management, the facility generated a profit.14
At the same time Authority officials began making overtures to cities across the Port District to take over public seaports, meeting little enthusiasm. Municipalities were unwilling to cede control of their ports, which remained a source of civic pride—and perhaps more importantly—hundreds of patronage positions. Years of poor management had left most of these facilities in dire need of physical and managerial overhaul. Business leaders sensed New Jersey’s underperforming public docks were hurting the region’s competitiveness, and they lobbied the Port Authority to intervene. Resulting studies showed the costs to modernize the terminals dwarfed the sums available to municipalities, and pressure mounted on local officials to surrender control of the waterfront. In 1947 Newark became the first city to lease its seaport to PANYNJ. In exchange, the Authority promised to refurbish the facility and attract new business to the western shore of New York Harbor.15
Port Authority Excluded From New York City's Docks
In 1948, after studying the City of New York’s maritime portfolio, the Port Authority offered to pay $5 million per year in rent and spend more than $100 million on new berths and a produce terminal, in exchange for control of City docks. The City, smarting from losing control of its airports in 1947 and reinforced by labor leaders fearing the docks’ closure, rejected the proposal. PANYNJ ended negotiations after the City turned down a revised offer in 1949.16
Instead, in 1955 the Authority purchased two miles of privately-owned waterfront in Brooklyn. Stretching from the Brooklyn Bridge to the Atlantic Basin, these facilities were the antecedents of what Port Commerce now refers to as its “Brooklyn” facility. During the late 1950s the Port Authority replaced 27 obsolete piers with 12 modern piers. The upgrades partly balanced the Authority’s investments in New Jersey and were designed to recover the cost of acquisition; however, unlike Newark, the facilities in Brooklyn were never expected to gain a significant share of port traffic, especially as a fundamental shift in maritime trade was luring shipping lines to New Jersey. Container shipping was the future, and the Authority was pouring millions into improving its New Jersey facilities to meet its demands.17
The City’s decision to retain control of its maritime facilities created challenges and opportunities as the competitive advantage of these facilities declined. Limited road and rail connectivity and lack of available space inland to handle the emerging containerization of freight made Manhattan piers essentially obsolete and left Brooklyn piers with limited traffic. Abandoned and dilapidated piers plagued the New York side of the harbor for years as new uses emerged slowly. Construction of the World Trade Center created a landfill, replacing lower Manhattan west side piers with the Battery Park City development. On the East River, piers were converted to recreational and retail use with the creation—and current rebuilding—of the South Street Seaport. Chelsea Piers was converted for recreational use, and new uses are still being developed for the stretch of waterfront now known as Hudson River Park. In Brooklyn, some piers have become Brooklyn Bridge Park, and the former Brooklyn Navy Yard has been developed for commercial tenants by a municipal authority. The City’s remaining maritime facilities include passenger cruise ship terminals in western Manhattan and Brooklyn at Pier 12—leased from the Port Authority—ferry terminals, and transfer stations for trash being exported via barge.
The City’s remaining freight facility is the South Brooklyn Marine Terminal (SBMT), a waterfront property on Second Avenue between 29th Street and 39th Street in Sunset Park. The approximately 88-acre terminal was originally modernized by the City in the 1960s to compete with Port Authority facilities in New Jersey and handled a variety of containerized and non-containerized cargoes. SBMT closed in the 1980s and was converted to a tow-pound facility for the New York City Police Department. Today, New York City Economic Development Corporation (EDC) has reactivated SBMT, offering a rail connection along First Avenue in Sunset Park that connects the marine terminal with Long Island via the New York Atlantic’s Bay Ridge Line—a freight railroad operating on LIRR track—and New England via the CSX service across the Hell Gate Bridge. The facility has the capability to process breakbulk cargo but is no longer a container port.18 While a recycling center currently operates, an auto processor tenant has left the terminal.
Container Shipping and the Rise of New Jersey Ports
The factors behind the decline of New York’s docks were also responsible for the growth of New Jersey’s port facilities. Port Newark, on the brink of disintegration before the Port Authority takeover, received $11 million for dredging and wharf reconstruction from 1948 to 1952.19 Port Newark’s reconstruction and additional Port Authority investment convinced several major steamship lines to move from Brooklyn to Newark. In 1953 Malcom McLean, visionary of container shipping, agreed to rent waterfront space at Port Newark. From there McLean Trucking would conduct its experiment of moving goods by ship in sealed containers.20
At its inception containerization included the movement of truck trailers aboard ships. Freight could be picked up by trucks at port in order to reach its final destination. This system limited the time and labor needed to stow and unload cargo from a ship, but required larger marshaling areas. Port Newark, with its large area and proximity to the New Jersey Turnpike, was a more favorable location for McLean than New York’s cramped facilities. As shippers eventually agreed on a standard size and shape, containers could be loaded, unloaded, stacked, and transported efficiently, switching between ships and trucks or trains with limited interruption. Leaders at PANYNJ anticipated containerization as the future of shipping, and invested accordingly. By 1955 PANYNJ announced it would expand facilities adjacent Newark Bay, using dredged materials to create Elizabeth-Port Authority Marine Terminal. The facility opened in 1962 as the first port in the United States built specifically to support container operations.21
PANYNJ facilities in New Jersey were not the only marine terminals serving containerships. While space constraints restricted the growth of container shipping in Manhattan and Brooklyn, American Export Lines built a container port in the 1970s on City-owned land on the northwestern shore of Staten Island known as Howland Hook. The facility changed hands before experiencing financial difficulties in the mid-1980s. The next year PANYNJ began leasing the site from the City.22
In 1979 as part of a joint venture with the City and New York State, PANYNJ submitted plans to the Federal Maritime Commission to open a container terminal in the Red Hook neighborhood of Brooklyn. The 66-acre facility opened in 1981 and was expanded, beginning in 1982, reaching 80 acres by the mid-1980s. Today, Red Hook operates six container cranes and moved an estimated 50,000 containers per year in 2013, less than 2 percent of the Port’s total.x
PANYNJ further expanded its holdings in New Jersey by purchasing parcels in the Port Jersey Industrial and Marine Center in the late 1980s.23 By 1989 PANYNJ had completed Port Jersey-Port Authority Marine Terminal, an automobile import and export terminal in Jersey City and Bayonne. With the exception of a small area reserved for BMW’s import operation, the facility has since been converted to a container terminal. In 2010 the agency purchased an adjacent portion of the former Military Ocean Terminal at Bayonne (MOTBY) from the Bayonne Local Redevelopment Authority (BLRA), which was later folded into the City of Bayonne. While the sale has come under scrutiny as payments have been used by the City of Bayonne to supplement its operating budget, the peninsula is available for further development by PANYNJ.24
Port Commerce Today
Today PANYNJ maritime facilities, known in the agency as Port Commerce, consist of eight assets. Six are maritime ports; three in New Jersey—Port Newark, Elizabeth-Port Authority Marine Terminal, and Port Jersey-Port Authority Marine Terminal—and three in New York—Brooklyn, Red Hook, and Howland Hook. While most of the maritime trade at Port Authority facilities is conducted by private terminal operators who lease space, PANYNJ operates public berths at Port Newark and Red Hook. Revenue generated from operating public berths accounts for a small share of total revenue—estimated to be 5 percent in 2014. As container terminal operators have grown, PANYNJ has repurposed facility acreage once dedicated to public operations, warehousing, distribution, and other uses to container terminals.25
The other two Port Commerce assets are New York New Jersey Rail LLC (NYNJR) and Greenville Yard. NYNJR is a cross-harbor railcar float system, moving train cars by barge between Greenville Yard—a rail yard adjacent to Port Jersey-Port Authority Marine Terminal—and 65th Street in Brooklyn.26
The Authority is not the only landlord in the port. The City of New York still owns a 20-acre portion of the Red Hook facility, as well as Howland Hook, leasing both to PANYNJ. The City also owns the SBMT, operating it through the EDC, and the Brooklyn Army Terminal and 65th Street Yard where NYNJR railcar floats terminate.27
Other non-PANYNJ maritime terminals serve the port district, processing domestic bulk and breakbulk cargos. These private facilities typically specialize in a single cargo or type of cargo, particularly petroleum. An estimated 71 million tons of bulk and breakbulk entered or exited the port through more than 150 private terminals in 2013, while Port Authority facilities processed 3.7 million tons, or 5 percent of total bulk cargo by weight.28
Figure 1 shows the geographic distribution of the major maritime facilities in the port region. PANYNJ facilities are shaded in green and SBMT is shaded in orange. The figure also includes ExpressRail connections at Port Authority maritime facilities and their integration with the region’s major freight rail connections, as well as the rail car float system operated by NYNJR. ExpressRail facilities are owned and operated by the Port Authority to move containers by rail. An ExpressRail facility is currently under development to serve Port Jersey-Port Authority Marine Terminal as part of the Greenville Yard project included in PANYNJ’s 2014-2023 Capital Plan.
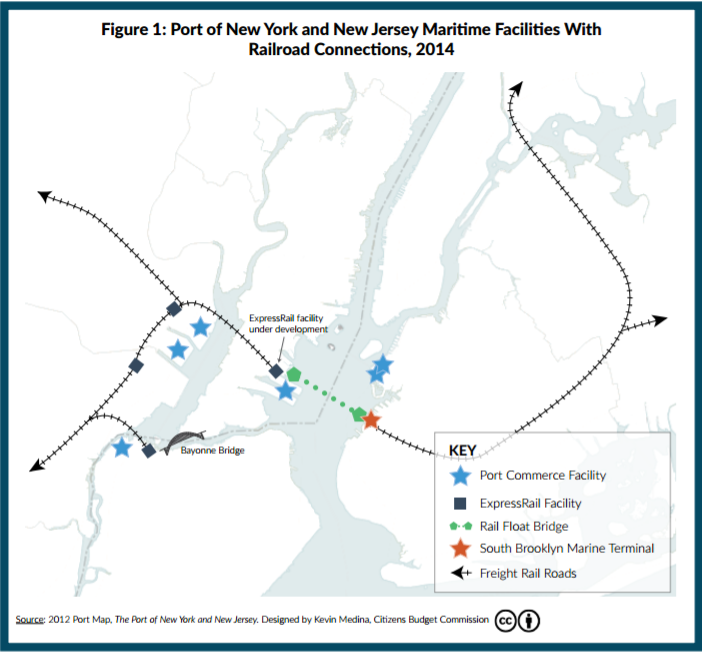
Port Newark, Elizabeth-Port Authority Marine Terminal, Howland Hook, and Port Jersey-Port Authority Marine Terminal are located on the western shore of New York Harbor, with Port Jersey-Port Authority Marine Terminal, and the adjacent Greenville Yard, located on Upper New York Bay and the others on Newark Bay. Reaching the facilities on Newark Bay requires ships to move through the Kill van Kull and beneath the Bayonne Bridge. Red Hook and Brooklyn are on the eastern shore of the harbor on the Buttermilk Channel opposite Governor’s Island. SBMT is south of Brooklyn and Red Hook and to the west of Sunset Park. NYNJR’s connection is at 65th Street.
Trade and the Port of New York and New Jersey
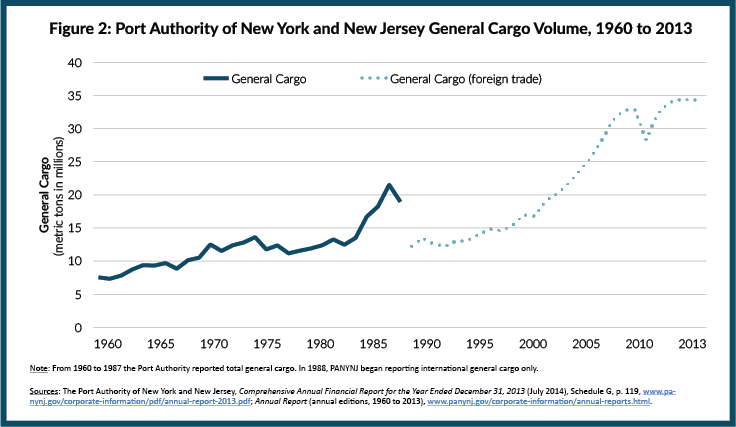
Despite cyclical variations, trade activity at Port Commerce facilities has grown since the 1960s. In 1960 the port processed 7.5 million metric tons of general cargo; by 1987 general cargo reached 19 million metric tons, an average annual growth rate of 3.5 percent. In 1988 the Port Authority began reporting imported and exported general cargo only. Since then volume has increased from 12.3 million metric tons to 34.2 million metric tons in 2013, an average annual increase of 4.2 percent.29 (See Figure 2.)
As shippers increasingly turn to containers, and as the Port Authority actively competes with other container ports in the United States, growth since 1980 is better measured by the number of containers, or 20-foot equivalents (TEUs) moving through the port.30 In 1980 PANYNJ and its tenants processed 1.9 million TEUs in container cargo; by 2013 they processed 5.5 million TEUs, an average annual growth of 3.1 percent.31 (See Figure 3.)
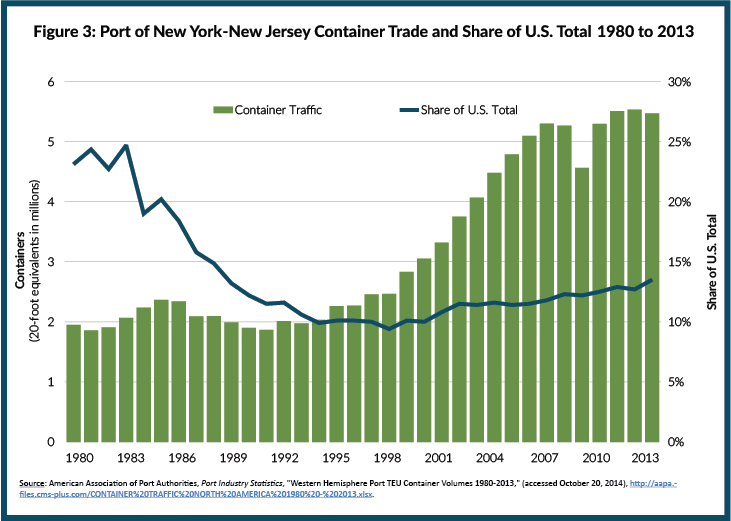
Even as PANYNJ tenants have processed more containers, the port’s total share of U.S. container traffic has decreased. In 1980 PANYNJ and its tenants accounted for 23.1 percent of U.S. container traffic; by 1998 that figure had fallen to 9.4 percent. Since 1998 the port has partially recovered this share. In 2013 PANYNJ and its tenants accounted for 13.9 percent of all U.S. container trade.32
Whether focusing on all general cargo or containers, two fundamental trends underlie the long-term growth in maritime trade in the port. First, waterborne trade has grown steadily over time, with rapid increases from 1999 to 2007. Second, Port Commerce facilities have sustained competitive advantages enabling them to keep growing trade volume; however as other ports have embraced containerization, New York-New Jersey has seen its share of total trade shrink.
Competition Between Coasts
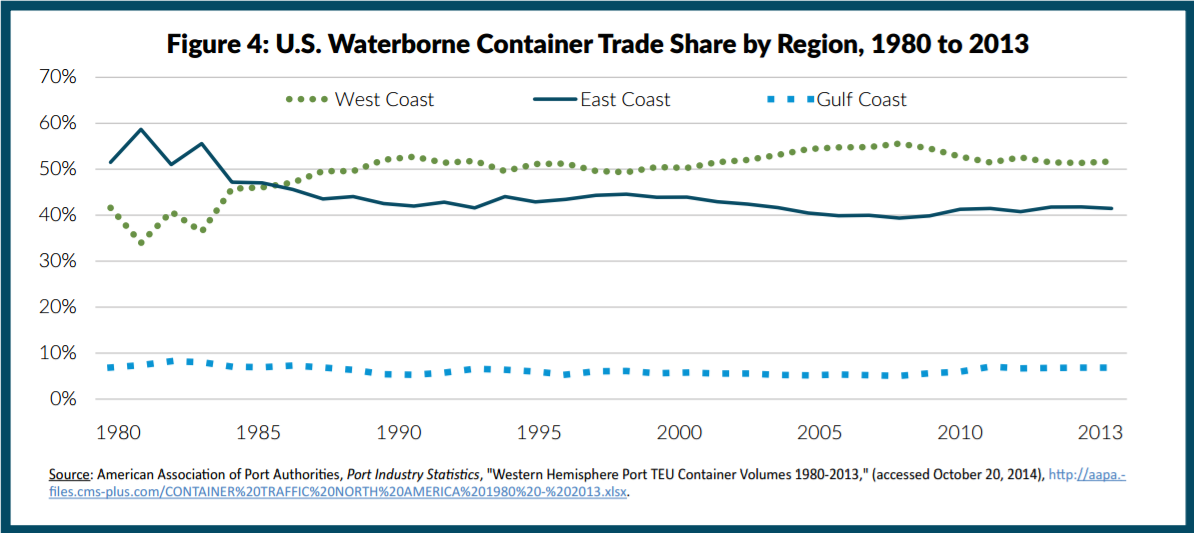
One critical dimension of the competition for maritime activity is the division of trade among the three major coasts of the United States.33 (See Figure 4.) In 1980 East Coast ports accounted for 52 percent of the nation’s container trade, and the West Coast only 42 percent. By 2013 West Coast ports had surpassed East Coast ports, accounting for 52 percent of all container trade in the United States versus; the East Coast’s 41 percent. This trend appears to be reversing since 2005. Since then, East Coast ports have increased their share slightly from 40 percent to 41 percent. Much of the West Coast activity is concentrated in the two largest container ports in the United States—Los Angeles and Long Beach. These two ports, adjacent to one another and well-connected to rail routes, moved 14.6 million TEUs in 2013, or 63 percent of the West Coast total and 33 percent of the U.S. total.34
Competition Among East Coast Ports
Since the 19th century New York-New Jersey has been the East Coast’s dominant port. Its competitive advantages include proximity to a large, wealthy consumer market; robust rail service from Norfolk Southern and CSX; and accessibility to concentrations of export goods producers. Moreover, the port is geographically closer to major northern European ports such as Rotterdam, Hamburg, and Antwerp than its competitors to the south. This synergy fueled the port’s growth through the 1950s; however, as demographics changed and containerization altered the freight transportation paradigm, other ports along the East Coast began attracting trade at New York’s expense. (See Figure 5.)
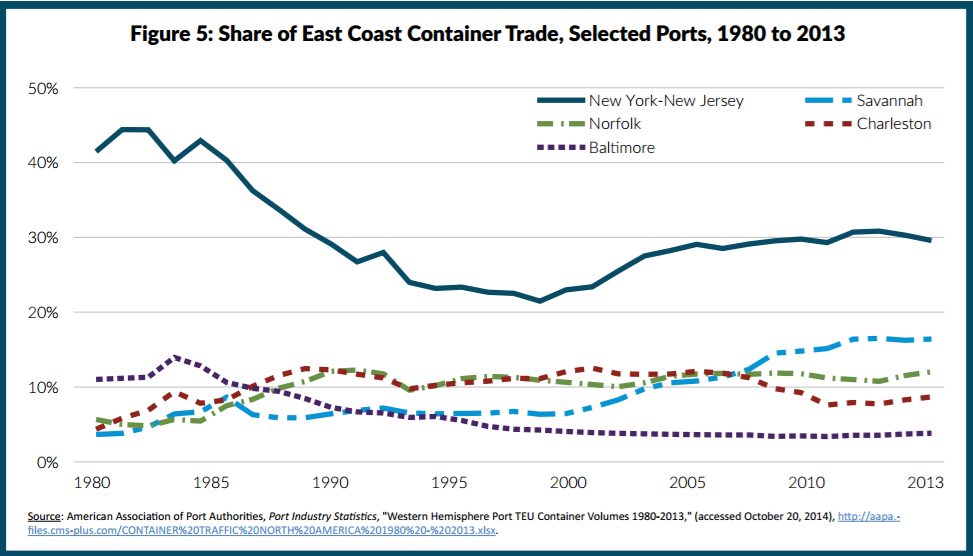
Other studies and this analysis consider New York-New Jersey to have four East Coast competitors: Savannah, Norfolk, Charleston, and Baltimore. Together with New York-New Jersey, they represented 71 percent of all container trade on the East Coast in 2013.35 From 1980 to 2000, New York-New Jersey increased its total volume, but saw smaller shares of the East Coast total. Since 2000 New York-New Jersey has begun to win back its share of the market, largely on the strength of its local regional consumer market. According to PANYNJ officials, 85 percent of cargo leaving the port goes by truck, suggesting it is headed to nearby markets, and not destinations further inland better reached by rail.36
While demographics play a key role in the port’s competitiveness, other features of the port including capacity and efficiency are also important. Improving these features requires cooperation between PANYNJ and terminal operators. As landlord, the Authority works with tenants—private terminal operators—to operate the port. Under this arrangement PANYNJ shapes the size of the port and the ability of ships, trains, and trucks to reach the terminals, but private terminal operators must be relied on to operate efficiently. They provide and maintain equipment to facilitate the movement of containers including ship-to-shore cranes and vehicles or gantries designed to move cargo across the terminal. Terminal operators, through their trade association, also negotiate collective bargaining agreements with skilled laborers needed to operate the port.
Table 1 compares selected features of New York-New Jersey’s East Coast competitors. Channel depth restricts the size of ships reaching a port. Norfolk and Baltimore already have sufficient depth to serve the largest ships in use; Charleston and Savannah both require dredging programs to accommodate these ships. Baltimore is further encumbered by its location, which is farther from open water than its competitors. PANYNJ is completing a dredging program to bring channel depth to 50 feet for all facilities on the western side of New York Harbor. Elizabeth-Port Authority Marine Terminal, Port Newark, and Howland Hook will not be able to serve the largest ships in the worldwide fleet until air draft restrictions are lifted by raising the road deck of the Bayonne Bridge; however, Port Jersey-Port Authority Marine Terminal sits outside this impediment and may service these large ships right now. The current 151-foot air draft restriction will be removed by summer 2016.
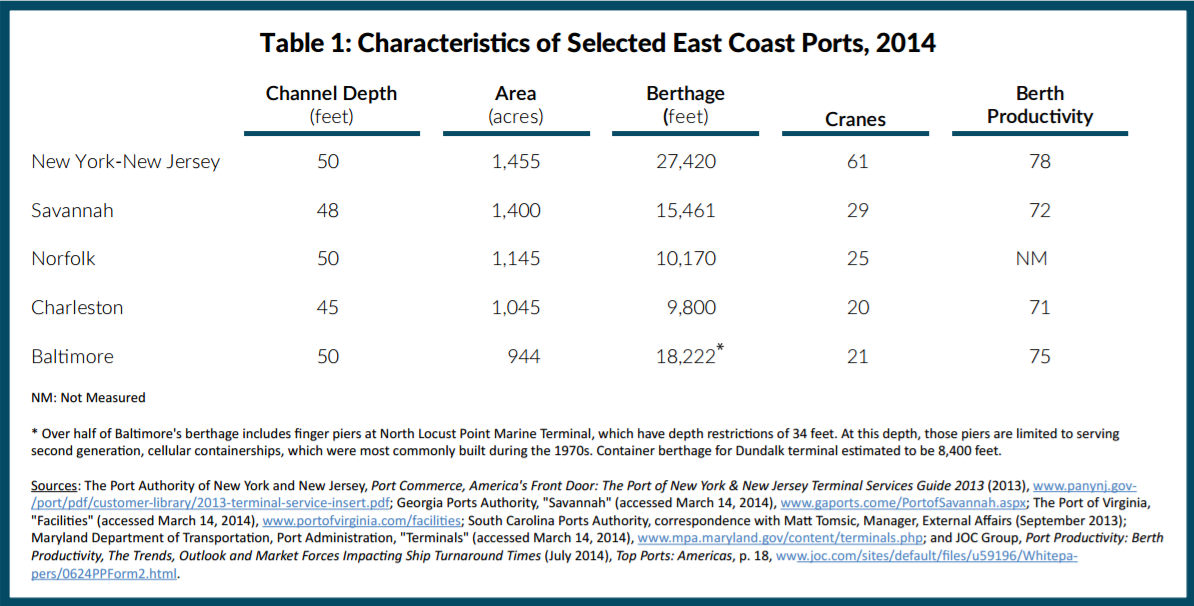
In terms of size and capacity, New York-New Jersey is the largest East Coast container port. Its terminals have the largest aggregate terminal area with 1,455 acres compared to 1,224 acres at second place Norfolk.39 New York-New Jersey terminals have 27,420 feet of berth length, a measure that relates to the size and number of ships that may call at any one time, versus 11,209 feet at second place Baltimore. Baltimore is also second to New York-New Jersey in the number of cranes, 61 versus 21.40
In an attempt to quantify a terminal’s ability to move cargo, the Journal of Commerce has rated various terminals around the world by berth productivity. This rating measures the average number of containers moved on or off a vessel in an hour. New York-New Jersey was rated as having a berth productivity of 78. Under this measure, PANYNJ facilities ranked first among East Coast competitors and fifth among all North and South American ports behind Balboa, Panama; Long Beach; Los Angeles; and Lazaro Cardenas, Mexico. It should be noted this is not necessarily a measure of efficiency: a terminal may increase its berth productivity by employing additional labor and capital to move cargo, even if doing so is less cost-efficient.41
Another measure of container port productivity examines the number of moves an individual crane makes in an hour. This measures efficiency at a more granular level, controlling for the number of cranes working on a vessel. In this measure, Charleston and Savannah, whose crane productivities are 40 and 37, respectively, represent the highest productivity on the East Coast.42 The latest publicly available data on crane productivities at Baltimore and Norfolk show that these ports range between 32 and 35 moves per hour.43 PANYNJ facilities do not publicly share their crane productivities; however, current collective bargaining agreements signed in 2013 mandate a minimum of 30 crane moves per hour, increasing by at least one move per hour per year through the end of the agreement in 2018.44 This measure is just a guideline, and operators lack a mechanism for ensuring this productivity level is being met.
Investments to Enhance Competitiveness
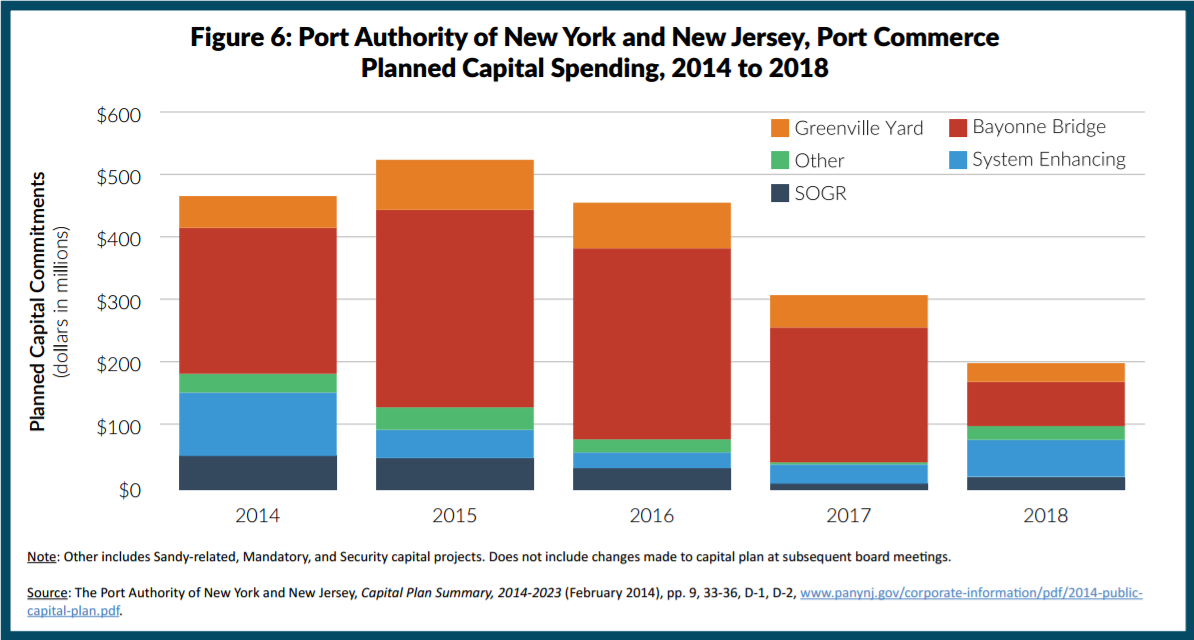
In order to remain competitive PANYNJ is investing in its facilities. The 2014-2023 PANYNJ capital plan commits $2.8 billion for projects affecting Port Commerce, of which nearly $2.1 billion is scheduled for the first five years. (See Figure 6.) The investments focus on three areas:
- Enabling the port to accommodate the largest ships in the worldwide fleet;
- Improving road and rail access to terminals; and
Enhancing resiliency in response to events like Superstorm Sandy in 2012.
Making Way for Larger Ships. PANYNJ is readying the port for a new generation of large cargo ships in two ways. First, with assistance from the U.S. Army Corps of Engineers, the Authority has deepened the channels serving its facilities, allowing larger vessels, which are more efficient movers of cargo, to access the port. This project will end in spring 2015, when all channels are expected to have depths of at least 50 feet.45
Second, PANYNJ is raising the road deck of the Bayonne Bridge so larger ships laden with containers may pass beneath it. The Bayonne Bridge Navigational Clearance Program (BBNCP) will replace and raise the existing main span deck and both approaches to the bridge. As of 2013 PANYNJ had spent $105 million on the project, and it has authorized $1.3 billion for the project. BBNCP’s estimated completion date is 2017, but the air draft restriction will be removed by summer 2016.46
Improved Inland Access. Port Commerce will also spend more than $320 million over the next five years to improve rail and road access to terminals. One project creates new rail access at Port Jersey-Port Authority Marine Terminal via Greenville Yard. It is expected to cost $356 million, $320 million of which will be paid by the Authority with the balance funded by other stakeholders.47 Other related projects include $259 million for roadway improvements—$52 million over the first five years—to ease congestion for trucks using Port Commerce facilities.48
Storm Repair and Resiliency. Flooding and wind from Superstorm Sandy closed the port’s marine terminals for several days. While the damage was not extensive, the capital plan includes nearly $100 million for related work. Much of the money is being used to raise electrical systems above flood lines so that port systems, rail signals, and traffic lights will maintain power in the event of future flooding. The Port Authority expects most of the costs associated with these projects to be funded with insurance proceeds and federal grants.49
Financial Performance and Outlook
Two points emerge from an analysis of Port Commerce’s finances. First, since the Authority began publishing the financial performance of individual business lines and facilities in 1992, Port Commerce has incurred a deficit every year.50 Second, based on reasonable assumptions about trends in trade, the outlook for Port Commerce is an enduring deficit. This means that port activity has been and will continue to be subsidized by other PANYNJ activities unless changes are identified and implemented.
Recent Financial Performance
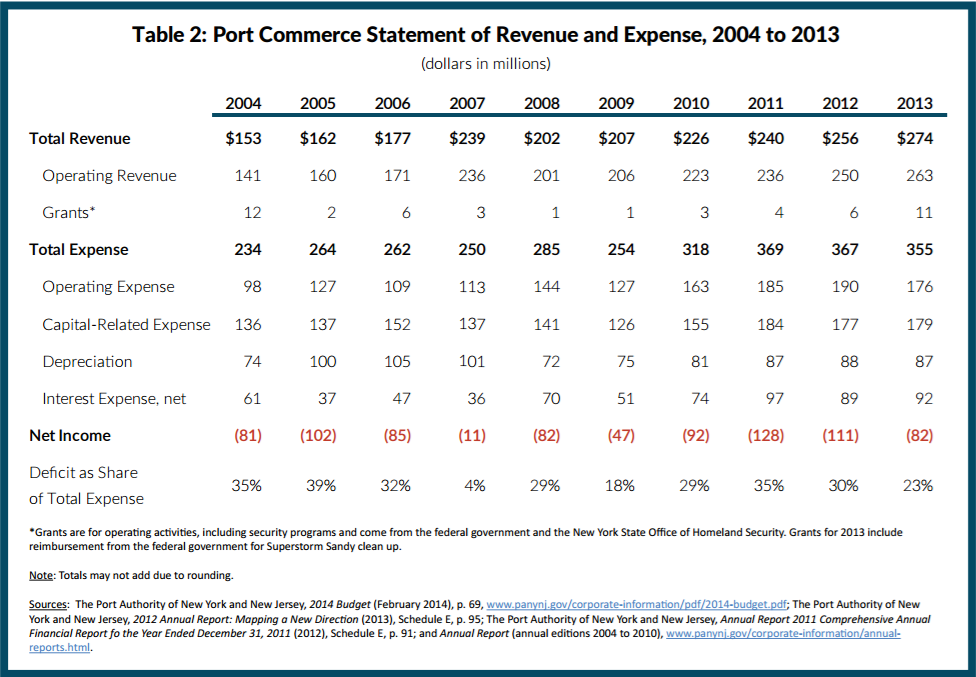
Table 2 summarizes the financial performance of Port Commerce over the past decade. Annual deficits have ranged from $11 million to $128 million or as low as 4 percent and as high as 39 percent of total expenses. The variation in deficit size is related to trends in revenues and expenses.51
Revenues
As previously noted, PANYNJ primarily serves as a landlord of its Port Commerce facilities, renting to terminal operators, warehouses, and other firms. Rent from tenants accounts for most operating revenue. For private terminal operators rent is both fixed and variable, variable rent being a function of throughput.52 For 2014 Port Commerce expects 69 percent of all revenue to come from fixed rent and 13 percent of revenue to come from variable rent.
A second and smaller source of operating revenue—12 percent of the projected total for 2014—consists of fees charged by the Port Authority to shippers using the port.53 Until 2011 these fees were split between an intermodal lift fee charged for containers loaded onto rail cars and a volume-based fee paid by container terminal operators to the Port Authority to defray costs associated with integration and regular updating of port databases.54 In 2011 these fees were replaced with a single Cargo Facility Charge (CFC) of $4.95 per TEU.55
Port Commerce also earns revenue from operating public berths, open to all ships, collecting fees for berthing, loading, unloading, and storing cargo. Furthermore, the agency collects some miscellaneous fees. These two components together are expected to account for 6 percent of all revenue in 2014.
Given the rent structure, revenue tends to track with trade volume. Operating revenue rose significantly in 2007, an unusual year both because of the volume increase and one-time payments totaling $48 million to PANYNJ in connection with tenant ownership changes at Elizabeth-Port Authority Marine Terminal.56 Operating revenue fell 15 percent in 2008, mostly due to absence of these one-time payments; however, a recession slowed international trade as well, as operational revenues only increased 6.5 percent as opposed to 10 percent the previous year. In 2009 operating revenue increased less than 2.5 percent. Since 2008 operating revenue has grown at an average annual rate of 5.5 percent reaching $263 million in 2013.
A much smaller component of total revenue consists of operating grants from both states and the federal government. Over the studied period, grants accounted for as much as $12 million in 2002 and as little as less than $1 million in 2008. In 2013 Port Commerce facilities received $11 million in operating-related grants owing to increased federal funds in response to Superstorm Sandy.
Expenses
Port Commerce expenses include operating expense and capital-related expense—depreciation and interest on long-term debt. Operating expense includes security, maintenance, marketing, and management services as well as rent to the City of New York and the City of Newark. In addition the Port Authority allocates a portion of its centralized headquarters expense to each business line. According to the 2014 Budget, the 2013 estimate for these centralized costs was $15 million or 8 percent of Port Commerce’s 2013 operating expense.57
Higher one-time operating expenses in 2008 included the cost of dredging in New York Harbor; however, operating expense increased significantly in 2010 after the Port Authority’s purchase of MOTBY.58 The $22 million increase in operating expense in 2011 includes a $12 million increase in contract service costs owing to new terminal operating agreements at Port Newark and Red Hook.59 In 2012 operating expense increased $5 million as Port Commerce increased contract service costs again, this time $26 million for operating agreements at Brooklyn and Port Newark. Partially offsetting this increase were lower costs due to milder winter weather and a $13 million decrease in bad debt expense.60 Operating expense decreased $14 million in 2013 partially due to the Authority’s completed commitments to Brooklyn Bridge Park Development Corporation.61
Depreciation increased from $74 million in 2004 to $100 million in 2005 and remained as high or higher through 2007 owing to the accelerated retirement of investments at Red Hook and Brooklyn in anticipation of their transfer to the Brooklyn Bridge Park Development Corporation.62 Since 2008 depreciation has grown at a slower average annual rate of 3.9 percent. Growth in depreciation reflects increased capital investment at Port Newark and Port Jersey-Port Authority Marine Terminal above historical levels.
Net interest expense includes financial income. According to the Consolidated Bond Resolution, net revenues generated by all business lines are used to pay debt service on consolidated bonds. Interest expense and financial income are allocated to all facilities on the basis of unamortized investment in use—that is, completed construction less accumulated depreciation. For this reason, trends behind interest expense changes are a product of change in interest expense, financial income, and changes to the basis of allocation, and thus are difficult to pinpoint.63 For example interest expense for Port Commerce doubled in 2008; however, this was driven by a 109 percent decrease in financial income from the previous year.64 Interest on bonds has increased each year for the period studied with the exceptions of 2007 and 2010.65
Variability by Facility
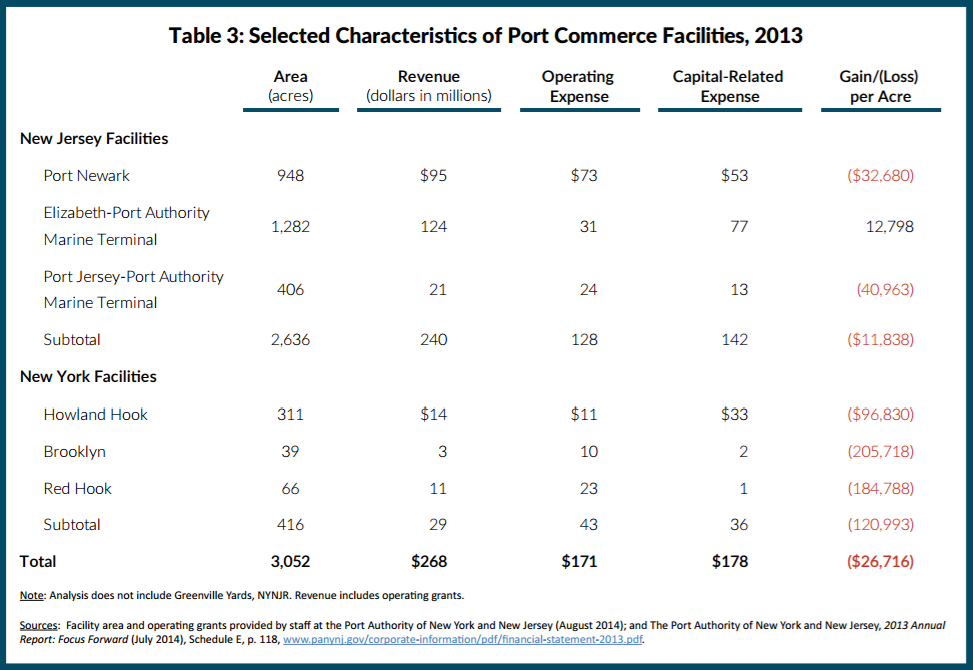
Although Port Commerce loses money, this is not the case for each facility. (See Table 3.) Most notably, Elizabeth-Port Authority Marine Terminal is a profitable operation with a net profit in 2013 of about $16 million or $12,798 per acre. The losses per acre at the other facilities ranged from $205,718 at Brooklyn to $32,680 at Port Newark.
Financial Outlook
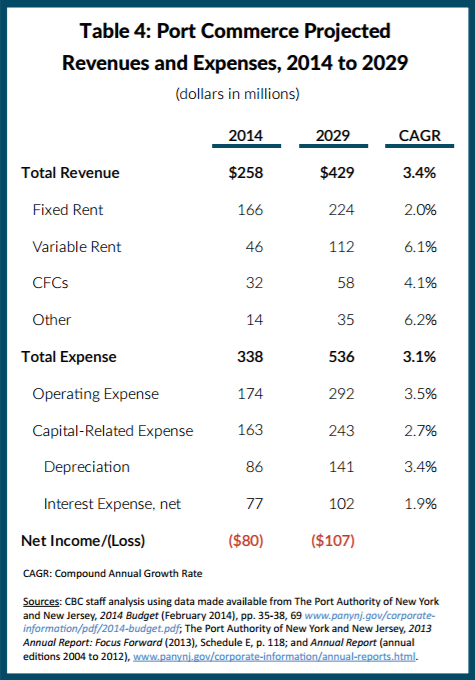
What is the outlook for Port Commerce revenue and expenses? PANYNJ makes limited long-term financial projections available to the public. A 2014 presentation to the Board covering the period 2014 to 2023 did not expect positive net income in any year in that period.66 This report uses reasonable assumptions to create an independent projection to 2029. (See Table 4.)
Revenue. As previously discussed, Port Commerce revenue is a function of fixed rent, variable rent and CFCs based on throughput, and other revenue. Leases with terminal operators provide for fixed rent growth of 2 percent compounded annually, a rate applied to total fixed rent in the projections.67
Volume at the facilities is projected to grow 4.1 percent annually.68 Variable rent grows faster than overall volume due to the two-tiered rate system; in addition, leases include triennial increases in variable rates. Accordingly, the projections assume variable rent will grow 4.5 percent annually, with additional increases of 5 percent in 2016, 2019, 2022, 2025, and 2028 to reflect rate increases.69 This yields variable rent average annual increases over the period of 6.1 percent. The analysis also assumes the CFC will remain at the current rate and that revenue from the CFC will grow 4.1 percent annually due to volume increases.
This analysis uses Port Commerce’s own projections for other revenue. This includes dockage, wharfage, and miscellaneous charges the business line levies. While dockage and wharfage are expected to grow 6.2 percent annually over the studied period, miscellaneous charges are expected to increase significantly from $14.2 million in 2014 to $30.4 million in 2020. For the years 2021 through 2023 the agency expects this segment to grow between 1 and 2 percent. For this analysis, this segment is projected to grow 1.5 percent annually for years 2024 through 2029. In total, these assumptions lead to average annual revenue growth of 3.4 percent.
Expense. Operating expense and capital-related expense are projected separately. For operating expense, past trends are not reliable indicators. From 2004 to 2013 Port Commerce operating expense grew at an average annual rate of 6.2 percent; however, this includes several substantial, one-time expenses for the purchase of MOTBY and higher spending associated with terminal operating agreements.70 For this reason, it is more realistic to use the 2014 budgeted amount as a base, and project growth at a lower annual average of 3.5 percent.
Interest and depreciation expense projections are based on 2014 budgeted levels with additions for planned spending under the 2014-2023 capital plan. For the years beyond the current capital plan, from 2024 to 2029, this analysis assumes annual capital spending is held flat.71 Interest expense associated with the Bayonne Bridge is allocated to Port Commerce, as opposed to Tunnels, Bridges, and Terminals (TB&T), because the project primarily benefits maritime tenants; however, depreciation of the investment is still allocated to TB&T. Port Commerce’s budgeted depreciation for 2014 is $86 million; added depreciation due to the capital plan assumes commitments are completed in stages over seven years. Capital will depreciate the year following its completion on a straight-line basis over 30 years with no salvage value.72 Port Commerce’s budgeted interest expense for 2014 is $77 million. Added interest expense from the 2014-2023 capital plan assumes 40 percent of capital spending is funded by debt. Debt is issued over seven years beginning from the date of the capital commitment. All new debt is bonded with 30-year terms and a 4.5 percent interest rate.<73 The combined effect of the capital-related assumptions is that this spending grows at an annual average rate of 2.7 percent.
The net result of the expense assumption is that total expense increase at an average of 3.1 percent annually. Revenue growth (3.4 percent) exceeds expense growth (3.1 percent) due to some economies of scale; however, this projection is based on unimpeded growth in trade at a rate higher than the average growth rate since 1980. In 2029 the projected net annual loss is $107 million or 20 percent of expense, compared to $80 million or 24 percent of expense in 2014. Absent other changes, the size of the loss grows over the studied period despite anticipated growth in trade volume.
Policy Options
The Port Authority absorbs annual losses while East Coast competitors—notably Savannah and Charleston—generate net revenues.74 Though Port Commerce deficits are small in the context of PANYNJ total operations—2013’s loss of $82 million is less than 2 percent of the agency’s total revenue—their persistence ought to prompt consideration of policy alternatives.75
Port Commerce can be more financially viable. One strategy, more timely, involves identifying excess capacity at terminals with low productivity and converting them to more socially rewarding uses. A second strategy supports the port’s competitiveness and strengthens the Port Authority’s bargaining position to improve income from terminal leases as they come up for renewal.
Neither strategy can be implemented quickly; however, neither should be postponed nor ignored. Like turning a large ship, changing fiscal policies at Port Commerce will have to be done slowly and thoughtfully.
Right Sizing Port Capacity
Capacity can be thought of in three dimensions: acreage capacity, berth capacity, and gate capacity. Acreage capacity gauges the amount of space a terminal has available to store and move cargo in and out of the facility. Berth capacity indicates how many vessels may call at one time, as well as the size of those vessels. Gate capacity refers to a terminal’s ability to serve land-side vehicles that move cargo to and from the terminal.
Acreage capacity is partially limited by the size of a terminal; however, it can also be expanded through the use of technologies that allow for denser alignment of containers. For example, terminals configured for the exclusive use of rail-mounted gantry cranes to move containers can typically service more than twice as many containers per acre than terminals configured for straddle carriers.76 If used efficiently, Port Authority facilities’ acreage can accommodate expected growth.
Berth capacity is limited by the shape of the terminal and its position on the waterfront, as well as the equipment used to move cargo to and from vessels. All container terminals at PANYNJ facilities have berth capacities to serve the largest ships in the worldwide fleet. Moreover, APM Terminal and Maher Terminal at Elizabeth-Port Authority Marine Terminal and Port Newark Container Terminal at Port Newark can serve multiple container ships simultaneously. Like acreage capacity, berth capacity is not a constraint on growth for Port Authority facilities.77
Gate capacity measures a terminal’s ability to process cargo moving to and from the facility. This dimension of capacity is the most likely to limit the port’s growth in the future. For example, in 2013 the port experienced severe congestion stemming from computer systems failures, chassis availability, and bottlenecks at the gate.78 In response the Port Authority formed a task force to address congestion in the port. The Port Performance Task Force issued a report in June 2014 with recommendations to improve some of these factors and formed a Council on Port Performance to implement these recommendations.79
Capacity to Absorb Future Growth
Considering these limitations PANYNJ still has capacity to handle additional cargo. Under current technological constraints Port Commerce terminals can process an estimated 6.5 million containers per year, or 4,500 containers per acre. This is more than twice the 2013 throughput of 3.2 million containers.80
Many ports even have higher capacities. Terminals at the Port of Los Angeles have capacities as high as 7,000 containers per acre per year and ports in East Asia and South America have moved more than 8,000 containers per acre per year.81 The local nature of the New York-New Jersey market and associated reliance on trucks leads to more delays, which keeps its throughput capacity lower than other ports that move large shares of cargo by rail. Nevertheless, the port is finding ways to increase capacity. The recent expansion of Global Container Terminal at Port Jersey-Port Authority Marine Terminal to install semi-automated rail mounted gantries to shift containers for storage and delivery is one example. The $325 million project has doubled the terminal’s annual throughput capacity and increased the number of containers that can be moved from ship to shore by 48 percent.82 Furthermore, the Port Authority has committed to competing for more rail traffic by developing additional ExpressRail capacity and may be in a position to increase its share of rail cargo as more post-Panamex ships call at New York-New Jersey, further boosting capacity.
Assuming the port’s terminals can reach a capacity of 8,000 containers per acre per year by 2044—which would require an average annual increase of capacity of 2 percent—the facilities could accommodate more than 11.6 million containers by 2044.83 PANYNJ’s expected growth in volume is 4.1 percent annually. Even if such unimpeded long-term growth may be optimistic, 8,000 containers per acre per year would be sufficient to accommodate projected growth past 2044.
Given the port can realistically expect to handle additional throughput, PANYNJ can save money by repurposing its least productive port facilities. As shown earlier in Table 5, the ports in New York are the least profitable. Brooklyn loses $205,718 per acre annually, Red Hook $184,788, and Howland Hook $96,830.
Repurposing Brooklyn Facilities
Brooklyn and Red Hook are strong candidates for closure and repurposing. Neither is vital to the port’s future; both could be closed with relatively little loss of capacity. Together in 2014 they account for only 5 percent of total Port Commerce acreage, and expansion is not realistic. Moreover, a portion of cargo entering the port through these facilities is barged across the harbor bound for warehouses in New Jersey or destinations west of the Hudson River.84 Brooklyn is home to a cruise terminal operated by the EDC, and the container terminal at Red Hook is operated as a PANYNJ public berth, with the day-to-day operations performed by contractors.85
If Brooklyn and Red Hook were closed and the property made available for development, the amount of vacant land in New York City’s Community Board 6—including Red Hook, Gowanus, Carroll Gardens and portions of Cobble Hill and Park Slope—would increase more than 175 percent. Indeed it would increase vacant land in the Borough of Brooklyn by 10 percent.86 As property values increase in the surrounding neighborhoods, sale of this land could generate additional revenue for the Port Authority.87
Three development uses—housing, commercial, and parks—may be preferable to continuing to devote the land to marine terminals. Other Brooklyn waterfront properties have been repurposed successfully, and best practices may be helpful in rethinking Brooklyn and Red Hook. By inviting other stakeholders, public and private, to help craft a vision for use of the site, the Port Authority may divest itself of the facilities in a way that generates benefits for the agency and the regional economy that far outweigh any associated costs.
Housing. Mayor Bill de Blasio has crafted a plan to address the City’s housing shortage. The Mayor hopes to encourage additional housing—affordable and market rate—and mixed-use development to help meet the goal of adding 80,000 affordable housing units on underused sites in the city. If Brooklyn and Red Hook were closed and an agreement reached to transfer ownership of the site to a developer, the city would gain 105 acres of available land.
Using recent housing development adjacent to Brooklyn Bridge as an example, rezoning all 105 acres of the Port Commerce facilities would yield a significant number of housing units. Nearby parcels have been zoned as medium residential with floor area ratios (FAR) from 2.0 to 4.0. Conservative assumptions regarding the amount of buildable land—half of the 105 acres are buildable parcels—indicate these sites could yield between 3,811 and 7,623 housing units.88
Commercial Development. Commercial and light manufacturing operations may also make sense for the site. The Brooklyn Navy Yard Development Corporation’s success in northern Brooklyn indicates that reutilization as a modern industrial park may encourage new and relocating companies to choose Brooklyn when determining where to place their operations.
The Brooklyn Navy Yard’s development entity was formed in 1981 and the 300-acre site diversified its portfolio, moving away from maritime tenants to accommodate smaller industrial enterprises. Today the Brooklyn Navy Yard leases all but 1 percent of 280 acres of usable parcels. More than 330 businesses employ 7,000 people, more than 25 jobs per acre.89 A similar job per acre ratio at Port Authority facilities in Brooklyn would yield more than 2,500 jobs, more than three times the number of direct jobs the current facilities are estimated to support.90
Parks. In the past, PANYNJ ceded former portions of the Brooklyn facility for the development of Brooklyn Bridge Park. By shuttering the Brooklyn and Red Hook facilities, the park might be extended, or new parks built, adding to the community’s green space. Repurposing the site may also allow for enhancements of segments of the Brooklyn Waterfront Greenway already adjacent and on the Port Authority facilities’ premises.91 The site, which partially encircles Atlantic Basin, also lends itself for use in waterfront recreation as a marina.
Repurposing Howland Hook
Howland Hook is not a clear-cut opportunity for repurposing; it makes up 10 percent of the port’s total acreage and has many undeveloped tracts of land adjacent to the facility. Unlike the two Brooklyn facilities, it has access to on-dock rail connections and is close to highways connecting to warehouses in New Jersey. A former petroleum distribution center adjacent the site is being considered for a warehouse and logistics center, a development that may boost the appeal of the facility.92
Port Commerce officials also expect New York Container Terminal at Howland Hook to serve a greater number of smaller ships over the next decade. As the worldwide cargo fleet grows larger and as other terminals prioritize larger ships, smaller ships will either have to wait or find other berths to transfer cargos. New York Container Terminal may be well-suited to address this demand.93
Howland Hook does not offer the same opportunities for recreation, residential, or mixed-use development as the Brooklyn facilities; however, other uses, not likely in Brooklyn, could be explored. The site is advantageous for a waste-to-energy power plant, a much needed capacity in the region.94 Howland Hook’s container terminal tenant has agreed to process sealed containers of garbage from the City of New York on barges, transferring them to trucks and railcars bound for waste-to-energy plants and landfills beginning in 2015.95 Building a waste-to-energy plant on the site can reduce the City’s garbage disposal expenses and generate renewable energy for the region while rightsizing the port.
Estimated Savings
While closing any port facility sacrifices revenue, the overall impact on Port Commerce’s financial statements would likely be beneficial due to even greater expense reductions. This analysis assumes closures would have three types of impacts. First, closing each of these facilities forfeits the closed facilities’ fixed rent, but retains variable rent and CFC revenue—assumed to be 30 percent of total revenue—due to movement of the activity to other Port Commerce facilities. This leads to lost revenue of $7 million annually in 2029 if the Brooklyn facilities are closed and $20 million annually in 2029 if Howland Hook is also closed. (See Table 5.)
Second, operating expense at each facility would be eliminated; the 2029 operating expense savings are expected to be $33 million for the Brooklyn facilities and $45 million for all New York facilities. This savings scenario assumes operating expenses grow at the baseline rate of 3.5 percent, although it is possible this rate may be further slowed by reducing the number of facilities Port Commerce must manage as landlord. Third, the capital-related expense—depreciation and long-term interest—associated with the planned 2014-2023 capital expense at these facilities would be eliminated. This saves about $3 million annually in 2029 by repurposing the Brooklyn facilities; $8 million if Howland Hook is included.
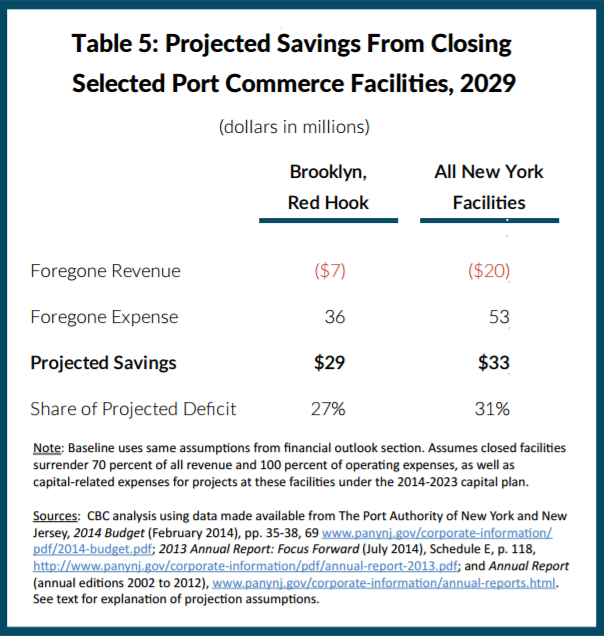
The combined impact of the revenue losses and expense reductions is a net savings of $29 million annually in 2029 from closing the Brooklyn facilities and $33 million if Howland Hook is also repurposed. This reduces the Port Commerce deficit from a projected $107 million to $78 million or $74 million in 2029.
Not the End of the Working Waterfront in Brooklyn
While the closure of Brooklyn and Red Hook may move some waterborne cargo to other facilities in New Jersey and Staten Island, there is another site in Brooklyn that does and is expected to continue to accommodate some maritime traffic: South Brooklyn Marine Terminal. The City owns the site and has had difficulty attracting another major tenant since an auto processor formerly located there closed in 2014. Whether or not the City, the Port Authority, or another private developer increases the waterborne cargo moving through this facility, SBMT may represent a possibility for limited maritime trade uses.
Increasing Revenue Opportunities by Supporting Competitive, Productive Terminals
Port Commerce is limited in the ways it can raise new revenue. Rent rates are set by long-term leases with marine terminal operators and fees collected by Port Commerce are dedicated to specific uses.97 The first opportunity to revisit existing terminal operator leases is not until the 2029 through 2031 period, when four leases—New York Container Terminal, Maher, APM, and Port Newark Container Terminal—expire.98 In the meantime, the business line’s fiscal standing is dependent on the port moving ever growing amounts of cargo through its terminals.
Moreover, it is unrealistic to expect the Port Authority to be able to balance the business line’s budget with renewed leases that cover costs under the current operating environment. Based on the port’s expected throughput, a deficit of $107 million would require an additional $10.08 per TEU; a deficit of $78 million—the projected deficit if Brooklyn and Red Hook are closed—would require an additional $7.31 per TEU.99 Experience suggests terminal operators’ margins are very narrow—worldwide trends emphasizing economies of scale and rate wars between shippers leave operators with little leverage with which to squeeze carriers. However, even in the event the industry’s climate changes by 2029 and terminal operators have surfeit annual income, this does not mean the Port Authority will be able to share in tenant windfalls.
On the other hand, the Port Authority is not entirely a victim of circumstance. PANYNJ can support changes to collective bargaining agreements through cooperative efforts among three parties—the Port Authority, which governs the port and whose benefactors include the governors of New York and of New Jersey as well as the U.S. Congress; members of the national and local shipping associations, which include shipping firms and terminal operators who hire workers to move cargo; and the labor union and its local chapters that represent workers at the port. Two areas ripe for improvement include:
- Lowering costs driven by staffing arrangements for the crews or “gangs” that work on the ships, cranes, and other equipment used to load and unload cargo, and
- Lowering fees, known as “container royalties,” that are paid by shippers to the workers’ union to fund payments and benefits beyond those funded in their contracts.
Such cooperation does not come easily and will take time to develop. Indeed these two areas were a part of negotiations during the last round of collective bargaining in 2012. While shipping associations did not receive these concessions, at least two rounds of collective bargaining governing both New York-New Jersey and all East Coast and Gulf Coast ports are expected to occur between now and 2029.100 The Port Authority can support efforts to lower costs by making labor more productive, thereby improving terminal operators’ profits and creating opportunities for negotiating higher rental incomes.
More Productive Staffing Arrangements
Skilled labor to load, unload, and move cargo, as well as maintain and operate port machinery is estimated to be nearly half the cost of moving goods through the port.101 The wage levels and staffing arrangements for workers in the port are determined by two separate contracts. The first is the master agreement for all union ports on the East Coast and Gulf Coast between the International Longshoremen’s Association (ILA) and the United States Maritime Alliance. This master agreement sets wages, fringe benefit contributions, and container royalty assessments for all union ports.102 The second contract is a local agreement negotiated between the ILA’s New York and New Jersey local chapters and the New York Shipping Association (NYSA), a group that represents shipping lines and terminal operators, that includes work rules, pay differentials, and recruitment and hiring practices distinct to the region’s facilities.103>
Maritime labor is organized in gangs, groups of longshoremen hired as a unit. Prior to containerization, gangs assembled individual pieces of cargo for loading and unloading ships, an intensive process requiring dozens of longshoremen to service a ship.104 With containerization, gangs have come to be the groups of workers who work on a crane and the associated equipment that move containers on and off ships. According to the current master agreement, ILA ports have gangs of 16 members. A full gang must be hired for each container crane servicing a vessel. While some longshoremen are expected to be working full time, other longshoremen divide the work and are not expected to all work simultaneously. For example, only one crane operator can work a crane, so each of a gang’s three operators actually work only one-third of each shift.
Restated, of the 16 member gang, only 10 are working at a given time and 6 are not working; however, the entire gang is paid as if they were working even when they are in relief.105
Rethinking Container Royalties
When container shipping gained momentum in the 1960s, the ILA faced the prospect of a large number of jobless members. Longshoremen threatened to strike if containerization led to the elimination of jobs, and since many shipping lines still required traditional labor for legacy breakbulk operations, carriers and operators agreed to negotiate. In exchange for wide-scale deployment of containerization, a quid pro quo payment, the container royalty, was born.
Royalties are assessed based on the weight of each loaded container. These assessments are then pooled across the East Coast and Gulf Coast ports and used for annual cash payments to longshoremen and to underwrite fringe benefit trust funds. The ILA continues to justify the royalties as compensation for the job opportunities lost by the union embracing containerization; however, most longshoremen working today were not yet longshoremen when the first assessment was created in 1960.106 The system has been expanded since 1960, and five container royalty funds now exist, four of which currently receive funds from active assessments.107
In addition to royalties required in the master agreement, New York-New Jersey facilities are subject to a unique assessment established by the local agreement to fund local fringe benefits.108 Since 2004 the assessment rates have been lowered several times, but they remain substantial. Most containers—those coming or going to destinations within 260 miles of the port—are subject to a NYSA assessment of $94 per container. Other containers are subject to lower assessments; for example, rail containers have a $10 fee and empty containers have a fee of $40.109
Estimated Savings
How much might be saved by eliminating these two practices? Any calculation is at best a rough estimate. As these items are subject to collective bargaining, a significant share of savings may be returned to longshoremen through higher wages; however, some simple arithmetic suggests the results may be enough to vastly improve the competitiveness of the port.
First, given that labor is assumed to be about half the cost of terminal operation and that current gang sizes permit 40 percent of the staff to be idle at any given time, a change to eliminate that practice could achieve terminal operations savings near 20 percent.110
Second, in 2013 carriers paid an estimated $354 million in container royalties for using New York-New Jersey terminals, $125 million of which was for ILA assessments and $229 million of which was for NYSA assessments.111 Elimination of the ILA supplemental cash payment assessments and local assessments offers the most savings and the best opportunity to improve the port’s competitiveness worldwide. Eliminating just the local assessment would still yield significant savings and would enhance the competitiveness of the Port Commerce facilities relative to other ports. The total potential savings from these measures using a 2013 base is $297 million and a lower $229 million if only the NYSA container royalty is eliminated.
What is the Port Authority’s Role?
As mentioned previously, the Port Authority has no direct role in collective bargaining agreements that set labor practices for the port. Still, this analysis suggests the bi-state agency should strongly support efforts to lower the cost of shipping goods through the port, including supporting management in its negotiations. Doing so would increase the amount of cargo needing to be stevedored by labor, improve margins for terminal operators, and generate throughput revenue for Port Commerce.
When the time comes to revisit terminal leases, the Port Authority ought to inject as much competition into the process as possible. Recruiting other terminal operators from around the world or the introduction of direct operation of at least one facility may result in better outcomes in lease negotiations. Furthermore, maritime trade has changed in many significant ways over the past 15 years, and the port can expect to see similar magnitudes of change over the next 15 years. As the Port Authority renegotiates terminal leases, it will need to ensure the agency—and by extension the region’s toll payers, airport users, and transit riders—is protected from subsidizing the maritime port as the worldwide shipping industry continues to evolve.
Conclusion
The title of this paper Righting the Ship should bring to mind the image of large vessel altering its course slowly. Whether repurposing facilities, restructuring long-term leases, or supporting changes to collective bargaining agreements, the Authority should be thoughtful and deliberate in bringing its maritime trade business line into a sustainable financial position.
However, in order to realize the benefits and savings of these actions, the Port Authority must begin exploring these recommendations now and put into motion plans to remedy recurring deficits. If done in the right way, reducing Port Commerce’s deficit can support the region’s competitiveness by removing some of the financial impediments to shipping to the region. Moreover, as the burden to support Port Commerce is reduced for other business lines within the Port District, finite capital and operating resources at the Port Authority can be dedicated to further investment in the region’s other transportation infrastructure at a time when the assets’ needs are critically underfunded.
Download Report
Righting the ShipFootnotes
- Edward L. Glaeser, “Urban Colossus: Why is New York America’s Largest City?” Federal Reserve Bank of New York Economic Policy Review (December 2005), p. 11, www.newyorkfed.org/research/epr/05v11n2/0512glae.pdf.
- William Grimes, “Down by the Riverside,” New York Times (September 7, 1997), www.nytimes.com/books/97/09/07/reviews/970907.07grimest.html.
- The department would change its name and scope several times. After consolidation in 1898 the department became known as Docks and Ferries. In 1942 the department became known as Marine and Aviation as airports were added to its responsibilities; however, after the City turned over its airports to the Port Authority, the department became known as Ports and Terminals, and later Ports, International Trade, and Commerce. The City disbanded the department in 1991 and divided its assets between the New York City Economic Development Corporation (EDC), General Services Administration, and Department of Buildings. See: Ann L. Buttenwieser, Manhattan Water-Bound: Manhattan’s Waterfront from the Seventeenth Century to the Present (Syracuse University Press, 1999), p. 243.
- The City of New York, Department of Docks and Ferries, Annual Report of the Department of Docks (January 3, 1921), p. 5, http://books.google.com/books?id=i4UqAAAAYAAJ&pg=PA123&lpg=PA123&dq=Annual+Report+for+New+York+City+Department+of+Docks+and+Ferries+1921&source=bl&ots=_je5aAFhvo&sig=MO9tgPYRmc8KvHWIBUyG295EZZM&hl=en&sa=X&ei=w6dPVIiSL6jksASQ-YKwDQ&ved=0CB4Q6AEwAA#v=onepage&q&f=false.
- Felix Reifschneider, “1925 History of the Long Island Rail Road,” The Third Rail (March 31, 2001), www.thethirdrail.net/0103/reif11.html#; and New York Central, West Side Improvement (June 28, 1934), http://railroad.net/articles/railfanning/westside/index.php.
- The Pennsylvania Railroad built a rail tunnel to a new Pennsylvania Station on Manhattan’s west side in 1910, but this was used almost exclusively for passenger service. See: Jill Jonnes, Conquering Gotham: Building Penn Station and Its Tunnels (Penguin Books, 2008).
- Jameson Doig, Empire on the Hudson (Columbia University Press, 2001), pp. 28-40.
- New York, New Jersey Port and Harbor Development Commission, Joint Report With Comprehensive Plan and Recommendations, Volume I (December 16, 1920), p. 52-54, http://books.google.com/books?id=4xE7AQAAMAAJ&pg=PA51&lpg=PA51&dq=Committee+on+Ways+and+Means+to+Prosecute+the+Case+of+Alleged+Railroad+Rate+and+Service+Discrimination+at+the+Port+of+New+York+et.+al.+v.+Baltimore+%26+Ohio+Railroad+Company+et+al&source=bl&ots=zaJxV5WTID&sig=25JOWmlcwELOgmctrSGE46Yqo8U&hl=en&sa=X&ei=3ahPVOzGIcSIsQT3sYHYDQ&ved=0CCsQ6AEwAw#v=snippet&q=Harbor%20Case&f=false.
- Jameson Doig, Empire on the Hudson (Columbia University Press, 2011), pp. 102, 115-117.
- The Port Authority opened the Holland Tunnel in 1927, the George Washington Bridge in 1931, and the Lincoln Tunnel in 1937.
- Prior to the creation of the Port Authority in 1893, the Pennsylvania Railroad considered a route into New York City via tunnel between Staten Island and Brooklyn, connecting to Manhattan over a bridge crossing the East River near 40th Street. See: Edward J. Mehren, Henry Coddington Meyer, and John M. Goodell ed., Engineering Record, Building Record and Sanitary Engineer, vol. 35-36 (McGraw Publishing Company, 1897), p. 316.
- Jameson Doig, Empire on the Hudson (Columbia University Press, 2001), pp. 81-82.
- Calculation assumes average rail car holds 100 tons and that the project requires $7 billion in borrowing of 40-year bonds at 4.5 percent. See: Port Authority of New York and New Jersey and U.S. Department of Transportation Federal Highway Administration, Cross Harbor Freight Program Tier 1 Draft Environmental Impact Statement (November 2014), Executive Summary, p. ES-8, www.panynj.gov/about/CHFP_draft_Tier_1_EIS/00_Executive_Summary.pdf.
- Jameson Doig, Empire on the Hudson (Columbia University Press, 2001), p. 505.
- Jameson Doig, Empire on the Hudson (Columbia University Press, 2001), p. 279.
- Marc Levinson, The Box: How the Shipping Container Made the World Smaller and the World Economy Bigger (Princeton University Press, 2006), pp. 84-89.
- By the 1960s, New York officials would demand the Port Authority build container terminals in Brooklyn and Staten Island, but the agency only agreed to study the possibility. See: Marc Levinson, The Box: How the Shipping Container Made the World Smaller and the World Economy Larger (Princeton University Press, 2006), p. 94.
- The EDC studied the possibility of converting SBMT to a container port. In order to serve post-Panamax ships the Bay Ridge Channel would require dredging to 50-foot depths. Analysis that included the transfer of container cranes from Red Hook projected the cost to be at least $300 million.
- PANYNJ added to its New Jersey portfolio in 1952, assuming responsibility for Hoboken’s marine terminals after five years of negotiations. The Authority modernized the Hoboken piers in the 1950s, but the terminal lacked the space needed to support container operations. In 1971 cargo-handling companies left Hoboken for PANYNJ’s other container facilities. Hoboken’s piers have been inactive since, though the leaseholders have tried to develop the site on several occasions. See: Anthony DePalma, “Port Authority Cancels Plans to Build in Jersey,” New York Times (October 24, 1987), www.nytimes.com/1987/10/24/nyregion/port-authority-cancels-plans-to-build-in-jersey.html; “New Life for Hoboken's Ghost Waterfront? Vote to Decide,” New York Times (July 9, 1990), www.nytimes.com/1990/07/09/nyregion/new-life-for-hoboken-s-ghost-waterfront-vote-to-decide.html; and Jameson Doig, Empire on the Hudson (Columbia University Press, 2001), pp. 374-375.
- Marc Levinson, The Box: How the Shipping Container Made the World Smaller and the World Economy Larger (Princeton University Press, 2006), p. 85.
- Marc Levinson, The Box: How the Shipping Container Made the World Smaller and the World Economy Larger (Princeton University Press, 2006), p. 96.
- A lack of space constrained container port development, but New York City also poured millions into building up its breakbulk terminals as the segment was disappearing. See: Marc Levinson, The Box: How the Shipping Container Made the World Smaller and the World Economy Larger (Princeton University Press, 2006), pp. 76-100, 243.
- The Port Authority of New York and New Jersey, 1980 Annual Report (1981), p. 11, www.panynj.gov/corporate-information/pdf/annual-report-1980.pdf?year=1980; 1981 Annual Report (1982), p. 7, www.panynj.gov/corporate-information/pdf/annual-report-1981.pdf?year=1981; and Staff of the Port Authority of New York and New Jersey, Port Commerce, briefing to CBC staff (July 23, 2014).
- Wolfgang Saxon, “Port Unit Purchases Jersey City Railyard in Coal Export Plan,” New York Times (January 6, 1982), www.nytimes.com/1982/01/06/nyregion/port-unit-purchases-jersey-city-railyard-in-coal-export-plan.html.
- MOTBY was originally acquired by the City of Bayonne through the BLRA in 2002; however, a poor real estate market undermined BLRA’s attempts to develop the site. In August 2010 the Port Authority acquired the site for $235 million payable in 24 annual installments. The three parcels purchased are considered a portion of Port Jersey-Port Authority Marine Terminal and have been used to expand a cruise terminal. See: The Port Authority of New York and New Jersey, Financial Statements and Appended Notes for the Year ended December 31, 2013 (April 4, 2014), pp. 46-47, www.panynj.gov/corporate-information/pdf/financial-statement-2013.pdf; and Steve Strunsky, “Port Authority to buy former Military Ocean Terminal in Bayonne in effort to expand ports,” Newark Star-Ledger (June 24, 2010), www.nj.com/news/index.ssf/2010/06/bayonne_officials_approve_port.html.
- Staff of the Port Authority of New York and New Jersey, Port Commerce, briefing to CBC staff (July 23, 2014).
- Greenville Yard, originally developed by the Pennsylvania Railroad in 1904, was used as a train switching station until the early 1980s. It is currently used as the western terminus of a railroad car float transfer bridge to southwest Brooklyn. It is being further developed by the Port Authority to expand the capacity of NYNJR and build an intermodal connection for the adjacent container terminal at Port Jersey-Port Authority Marine Terminal. See: National Park Service, Historic American Engineering Records, Greenville Yard, Transfer Bridge System Written Description, HAER No. NJ-49-A (undated), pp. 4-9, http://lcweb2.loc.gov/pnp/habshaer/nj/nj1600/nj1606/data/nj1606data.pdf; and Rachelle Garbarine, “In Jersey City, an Industrial Park by the Hudson,” New York Times (February 25, 2001), www.nytimes.com/2001/02/25/realestate/commercial-property-new-jersey-in-jersey-city-an-industrial-park-by-the-hudson.html.
- New York City Economic Development Corporation, “South Brooklyn Marine Terminal” (accessed May 20, 2014), www.nycedc.com/project/south-brooklyn-marine-terminal.
- Staff of the Port Authority of New York and New Jersey, Port Commerce, e-mail correspondence (November 4, 2014).
- Both measures exclude bulk cargo moving through Port Authority facilities—which generates revenue for the Authority—as well as all cargo moving through other, non-Port Authority facilities in the port. See: The Port Authority of New York and New Jersey, Financial Statements and Appended Notes for the Year ended December 31, 2013 (April 4, 2014), Schedule E – Information on Port Authority Operations, p. 90, www.panynj.gov/corporate-information/pdf/financial-statement-2013.pdf; and Annual Report (annual editions 1960 to 2012), www.panynj.gov/corporate-information/annual-reports.html.
- This is not to say the Port Authority should ignore other types of cargos. The region is one of the largest importers of bulk goods in the country—though much of this is through private terminals. Furthermore, the port offers improved use of domestic shipping, also known as short sea shipping, which can augment another segment of the Port Authority’s assets.
- American Association of Port Authorities, Port Industry Statistics, "Western Hemisphere Port TEU Container Volumes 1980-2013" (accessed October 20, 2014), http://aapa.files.cms-plus.com/CONTAINER%20TRAFFIC%20NORTH%20AMERICA%201980%20-%202013.xlsx.
- American Association of Port Authorities, Port Industry Statistics, "Western Hemisphere Port TEU Container Volumes 1980-2013" (accessed October 20, 2014), http://aapa.files.cms-plus.com/CONTAINER%20TRAFFIC%20NORTH%20AMERICA%201980%20-%202013.xlsx.
- This analysis focuses on container volume as a broad proxy of demand for port services. Container volume is the easiest cargo segment to commoditize and reflects larger trends in manufacturing and international trade.
- American Association of Port Authorities, Port Industry Statistics, "Western Hemisphere Port TEU Container Volumes 1980-2013" (accessed October 20, 2014), http://aapa.files.cms-plus.com/CONTAINER%20TRAFFIC%20NORTH%20AMERICA%201980%20-%202013.xlsx.
- U.S. Department of Transportation, Maritime Administration, Trade Statistics, “U.S. Waterborne Foreign Container Trade by Trading Partners” (November 6, 2014), Total TEU, www.marad.dot.gov/documents/DS_Container_TradingPartner_2013.xls.
- For high-value, time-sensitive cargo destined for East Coast markets, some shippers prefer to use West Coast ports and rail to achieve faster transit times.
- While New York-New Jersey competes with all East Coast and West Coast ports for a segment of its throughput, this analysis focuses on other large East Coast ports by volume that compete directly for local and marginal traffic. Gulf Coast ports are not included as competitors in this analysis. Though they are large—Houston and New Orleans are first and second in annual trade by cargo weight—their trade by weight and value is skewed by high volumes of bulk commodities.
- Denis Lombardi, Deputy Director, Port Commerce The Port Authority of New York and New Jersey, Port Commerce, briefing to the New York Chapter of the Transportation Research Forum (March 11, 2014).
- The Port Authority of New York and New Jersey, Port Commerce, America’s Front Door: The Port of New York & New Jersey Terminal Services Guide 2013 (2013), www.panynj.gov/port/pdf/2013-terminal-service-insert.pdf.
- Maryland Department of Transportation, Port Administration, "Terminals" (accessed March 14, 2014), www.mpa.maryland.gov/content/terminals.php; and the Port Authority of New York and New Jersey, Port Commerce, America’s Front Door: The Port of New York & New Jersey Terminal Services Guide 2013 (2013), www.panynj.gov/port/pdf/2013-terminal-service-insert.pdf.
- JOC Group, Port Productivity: Berth Productivity, The Trends, Outlook and Market Forces Impacting Ship Turnaround Times (July 2014), Top Ports: Americas, p. 18, www.joc.com/sites/default/files/u59196/Whitepapers/0624PPForm2.html.
- JOC Group, Port Productivity: Berth Productivity, The Trends, Outlook and Market Forces Impacting Ship Turnaround Times (July 2014), Top Ports: Americas, p. 18, www.joc.com/sites/default/files/u59196/Whitepapers/0624PPForm2.html.
- Old Dominion University, Regional Studies Institute, The State of the Region, Hampton Roads 2010 (October 2010), pp. 68-75, www.odu.edu/content/dam/odu/offices/economic-forecasting-project/docs/2010_SOR_Container_Ports.pdf.
- Federal Maritime Commission, Bureau of Trade Analysis, Memorandum of Settlement of Local Conditions in the Port of New York and New Jersey, No. 201159-001 (August 2013), p. 3, http://www2.fmc.gov/agreement_lib/201159-001.pdf.
- The Port Authority of New York and New Jersey, Port Commerce, “Port Redevelopment: Harbor Deepening” (accessed March 17, 2014), www.panynj.gov/port/harbor-deepening.html.
- The Port Authority of New York and New Jersey, Capital Plan Summary, 2014-2023 (February 2014), p. 9, www.panynj.gov/corporate-information/pdf/2014-public-capital-plan.pdf; and Staff of the Port Authority of New York and New Jersey, Port Commerce, briefing to CBC staff (July 23, 2014).
- Project includes cost of NYNJR facilities needed at site. The cost of the project was increased in September 2013. See: The Port Authority of New York and New Jersey, Capital Plan Summary, 2014-2023 (February 2014), p. 14, www.panynj.gov/corporate-information/pdf/2014-public-capital-plan.pdf; and The Port Authority of New York and New Jersey, “Port Authority Board Approves Major Redevelopment of Greenville Yard to Improve Cargo Movement in the Port” (press release, September 17, 2014), www.panynj.gov/press-room/press-item.cfm?headLine_id=2073.
- The Port Authority of New York and New Jersey, Capital Plan Summary, 2014-2023 (February 2014), pp. D-1, D-2, www.panynj.gov/corporate-information/pdf/2014-public-capital-plan.pdf.
- Denis Lombardi, Deputy Director, Port Commerce The Port Authority of New York and New Jersey, Port Commerce, briefing to the New York Chapter of the Transportation Research Forum (March 11, 2014).
- This is true even if losses are adjusted to remove real estate and economic development facilities that, at one time, the Authority classified under Port Commerce. See: The Port Authority of New York and New Jersey, Annual Report 2013: Focus Forward (August 2014), Schedule E – Information on Port Authority Operations, p. 117, www.panynj.gov/corporate-information/pdf/annual-report-2013.pdf; and Annual Report (annual editions 1993 to 2011), www.panynj.gov/corporate-information/annual-reports.html.
- This analysis includes Greenville Yard and NYNJR, which are not maritime ports but support the Port Commerce business line and are listed as separate facilities. Combined they accounted for 1 percent of total Port Commerce revenue and 3 percent of total expense in 2013.
- Staff of the Port Authority of New York and New Jersey, Port Commerce, briefing to CBC staff (September 18, 2013).
- Staff of the Port Authority of New York and New Jersey, Port Commerce, briefing to CBC staff (September 18, 2013).
- The intermodal lift fee was $57.50 per container and the volume-based truck registration fee was $2,500 to $10,500 per quarter in 2010. See: Joseph Bonney, “NY-NJ Port Cargo Fee Under Attack,” Journal of Commerce (June 7, 2013), www.joc.com/port-news/us-ports/port-new-york-new-jersey/ny-nj-port-cargo-fee-under-attack_20130607.html.
- CFCs are also assessed to roll-on/roll-off automobiles at $1.11 per vehicle and uncontainerized cargo at $0.13 per ton. While lawmakers in Trenton have passed a bill to eliminate the charge, counterparts in Albany have not passed similar legislation and the fee remains in place. See: The Port Authority of New York and New Jersey, Port Commerce, Port Authority Marine Terminals, PAMT FMC No. PA-10 (August 19, 2013), Section H, p. 51, www.panynj.gov/port/pdf/tariff_pa_08_19_2013.pdf; State of New Jersey, P.L. 2013, c. 216, (accessed November 20, 2014) http://legiscan.com/NJ/bill/S2747/2012; and State of New York, New York State Assembly, “S6156,” (accessed June 23, 2014), http://assembly.state.ny.us/leg/?default_fld=&bn=S06156&term=2013&Summary=Y&Actions=Y.
- In July 2007, the Port Authority reached an agreement with Maher Terminals and a subsidiary of Deutsche Bank, for a change of ownership at the container terminal at Port Elizabeth-Port Authority Marine Terminal. As part of the deal, new owners committed $114 million to capital investment at the facility. Maher Terminals also paid PANYNJ $22 million in cash to be reinvested in port infrastructure. See: The Port Authority of New York and New Jersey, “Port Authority Announces Agreement on Change of Ownership for Maher Terminal” (press release, July 5, 2007), www.panynj.gov/press-room/press-item.cfm?headLine_id=891; and The Port Authority of New York and New Jersey, Financial Statements and Appended Notes for the Year ended December 31, 2013 (April 2014), pp. 8 and 54, www.panynj.gov/corporate-information/pdf/financial-statement-2013.pdf.
- The Port Authority does not report centralized operating expense by business line in its financial statements as it does in the 2014 Operating Budget. See: The Port Authority of New York and New Jersey, 2014 Budget (February 19, 2014), p. 50, www.panynj.gov/corporate-information/pdf/2014-budget.pdf.
- The Port Authority of New York and New Jersey, Annual Report 2010, Comprehensive Annual Financial Report for the Year Ended December 31, 2010 (2011), p. 40, www.panynj.gov/corporate-information/pdf/annual-report-2010.pdf?year=2010; The Port Authority of New York and New Jersey, Annual Report 2011, Comprehensive Annual Financial Report for the Year Ended December 31, 2011 (2012), p. 37, www.panynj.gov/corporate-information/pdf/annual-report-2011.pdf?year=2011; The Port Authority of New York and New Jersey, Annual Report 2012: Mapping a New Direction (2013), p. 64, www.panynj.gov/corporate-information/pdf/annual-report-2012.pdf?year=2012; and The Port Authority of New York and New Jersey, Financial Statements and Appended Notes for the Year ended December 31, 2013 (April 2014), p. 47, www.panynj.gov/corporate-information/pdf/financial-statement-2013.pdf.
- The Port Authority of New York and New Jersey, Financial Statements and Appended Notes for the Year ended December 31, 2011 (2012), p. 10, www.panynj.gov/corporate-information/pdf/financial-statement-2011.pdf.
- The Port Authority of New York and New Jersey, Financial Statements and Appended Notes for the Year ended December 31, 2012 (2013), p. 12, www.panynj.gov/corporate-information/pdf/financial-statement-2012.pdf.
- The Port Authority of New York and New Jersey, Financial Statements and Appended Notes for the Year ended December 31, 2013 (April 2014), p. 14, www.panynj.gov/corporate-information/pdf/financial-statement-2013.pdf.
- The Port Authority of New York and New Jersey, Building Our Future, Annual Report 2007, Comprehensive Annual Financial Report for the Year Ended December 31, 2007 (2008), p. 45, www.panynj.gov/corporate-information/pdf/annual-report-2007.pdf?year=2007.
- The Port Authority of New York and New Jersey, Department of Management and Budget, phone correspondence (August 19, 2014).
- The Port Authority of New York and New Jersey, Financial Statements and Appended Notes for the Year ended December 31, 2008 (2009), Schedule D-2, p. 73, www.panynj.gov/corporate-information/pdf/financial-statement-2008.pdf.
- The Port Authority of New York and New Jersey, Financial Statements and Appended Notes for the Year ended December 31, 2013 (April 2014), Schedule D-2, pp. 85-86, www.panynj.gov/corporate-information/pdf/financial-statement-2013.pdf.
- Richard M. Larrabee, Director, Port Commerce, the Port Authority of New York and New Jersey, “Port Commerce Department Strategic Overview” (briefing to the Board of Commissioners, Jersey City, NJ, September 17, 2014), www.panynj.gov/corporate-information/pdf/9-public-board-state-of-port-091714.pdf.
- Global Terminal is one exception. Base rent growth is based on growth in the regional Consumer Price Index, but is limited to a minimum of 2 percent and maximum of 3.25 percent. See: Agreement Between the Port Authority of New York and New Jersey and Global Terminal & Container Services, LLC, Execution Version, Lease No. LPJ-001 (June 23, 2010), pp. 5, 18, www.panynj.gov/corporate-information/pdf/port-lease-global.pdf.
- Staff of the Port Authority of New York and New Jersey, Port Commerce, briefing to CBC staff (September 18, 2013).
- Container terminal leases include variable rents based on throughput. For each lease, a certain number of containers are exempted from this rate; beyond this exemption, variable rents are charged for two tiers of volume, with lower rates for higher volumes. These exemptions and tiers vary by terminal. Rates grow every three years by $2 for the first tier and $1.50 for the second tier. Exact dates of rate increases vary based on a terminal’s lease date. See: Agreement of Lease Between The Port Authority of New York and New Jersey and Maher Terminals, Inc., Lease No. EP-249 (October 1, 2000), www.panynj.gov/corporate-information/pdf/port-lease-maher-terminals.pdf; Agreement Between the Port Authority of New York and New Jersey and Maersk Container Service Company, Inc., Lease No. EP-248 (January 6, 2000), www.panynj.gov/corporate-information/pdf/port-lease-apm.pdf; Agreement Between the Port Authority of New York and New Jersey and Howland Hook Container Terminal, Inc., Lease No. HHT-4 (June 30, 1995), www.panynj.gov/corporate-information/pdf/port-lease-howland-hook.pdf; Amended and Restated Agreement of Lease Between The Port Authority of New York and New Jersey and Port Newark Container Terminal, LLC, Lease No. L-PN-264 (June 14, 2011), www.panynj.gov/corporate-information/pdf/port-lease-amended-PNCT-6-2011.pdf; and Agreement Between the Port Authority of New York and New Jersey and Global Terminal & Container Services, LLC, Execution Version, Lease No. LPJ-001 (June 23, 2010), www.panynj.gov/corporate-information/pdf/port-lease-global.pdf.
- The Port Authority of New York and New Jersey, Annual Report 2011, Comprehensive Annual Financial Report for the Year Ended December 31, 2011 (2012), pp. 37-38, www.panynj.gov/corporate-information/pdf/annual-report-2011.pdf?year=2011.
- This projection does not forecast changes in financial income for the Port Authority and the resulting effects on Port Commerce’s Interest Expense allocation.
- The Port Authority of New York and New Jersey, 2014 Budget (February 19, 2014), p. 85, www.panynj.gov/corporate-information/pdf/2014-budget.pdf#page=87.
- Port Authority staff indicated the agency would seek to achieve a 60-40 split between pay-as-you-go and debt financing for future capital expenses; however, in recent years the Authority has not met that benchmark. In 2011 debt financing accounted for 62 percent; in 2012 debt financing accounted for 64 percent, and in 2013 debt financing accounted for 59 percent. See: The Port Authority of New York and New Jersey, 2014 Budget (February 19, 2014), p. 85, www.panynj.gov/corporate-information/pdf/2014-budget.pdf#page=87; and The Port Authority of New York and New Jersey, Financial Statements and Appended Notes for the Year ended December 31, 2011 (2012), p. 15, www.panynj.gov/corporate-information/pdf/financial-statement-2011.pdf; The Port Authority of New York and New Jersey, Financial Statements and Appended Notes for the Year ended December 31, 2012 (2013), p. 17, www.panynj.gov/corporate-information/pdf/financial-statement-2012.pdf; The Port Authority of New York and New Jersey, Financial Statements and Appended Notes for the Year ended December 31, 2013 (April 2014), p. 18, www.panynj.gov/corporate-information/pdf/financial-statement-2013.pdf; and Elizabeth McCarthy, Chief Financial Officer of the Port Authority of New York and New Jersey, before the Committee on Finance of the Port Authority of New York and New Jersey (April 23, 2014). For video of the committee meeting, see: www.panynj.gov/corporate-information/board-committee-meeting-videos.html.
- Savannah and Charleston are seen as profitable due to lower labor costs and the fact these state-owned ports are also operated by state authorities. Additionally, Norfolk has sustained deficits for the past six years; however, the Virginia Port Authority receives 4.2 percent of the Commonwealth’s Transportation Trust Fund, which allowed for the Authority to increase its net position in 2011 and 2013, but not 2012. The Commonwealth’s Transportation Trust Fund is a combination of a portion of the state sales tax and motor vehicle fuel and related taxes and fees. See: Virginia Port Authority, Comprehensive Annual Financial Report for Fiscal Year Ended June 30, 2013 (October 31, 2013), pp. 20-21, www.portofvirginia.com/media/126619/cafr_web_2013___final.pdf; and Robert McCabe, “Port sinks to sixth straight fiscal-year loss,” Virginian-Pilot (August 19, 2014), http://hamptonroads.com/2014/08/port-sinks-sixth-straight-fiscalyear-loss.
- PANYNJ estimates Authority-wide revenues from operations to be $5.33 billion in 2018. See: The Port Authority of New York and New Jersey, 2014 Budget (February 19, 2014), p. 83, www.panynj.gov/corporate-information/pdf/2014-budget.pdf#page=83.
- Cargo Handling Cooperative Program, Improving Marine Container Terminal Productivity: Development of Productivity Measures, Proposed Sources of Data, and Initial Collection of Data from Proposed Sources (prepared by the Tioga Group, Inc., July 8, 2010), p. 51, www.marad.dot.gov/documents/070810_Tioga_CHCP_Productivity_Report.pdf.
- It is still possible to attain post-Panamex capacity at Howland Hook, though this would require additional investment not in the Port Authority’s capital plan.
- Joseph Bonney, “NY-NJ Port Focuses on Fixing Problems That Make It ‘Fragile’” Journal of Commerce (August 19, 2013), www.joc.com/port-news/port-productivity/ny-nj-port-focuses-fixing-problems-make-it-%E2%80%98fragile%E2%80%99_20130819.html.
- Joseph Bonney, “NYNJ ‘gray’ chassis plan expected by mid-2015,” Journal of Commerce (October 14, 2014), www.joc.com/port-news/us-ports/port-new-york-and-new-jersey/nynj-%E2%80%98gray%E2%80%99-chassis-plan-expected-mid-2015_20141014.html; and The Port of New York and New Jersey Performance Task Force, A Collaborative Effort for a Collective Change, Final Report (June 2014), pp. 8-9, 28, www.panynj.gov/port/pdf/pptf-final-report-june-2014.pdf.
- Staff of the Port Authority of New York and New Jersey, Port Commerce, briefing to CBC staff (September 18, 2013).
- Port of Los Angeles, Engineering Division Berths 136-147 Container Terminal Projected Throughput (March 19, 2007), Figures 1-2, www.portoflosangeles.org/EIR/TraPac/DEIR/Appendix_I_Throughput_Methodology.pdf; and U.S. Army Corps of Engineers, Charleston District, Draft Environmental Impact Statement: Proposed Marine Container Terminal at the Charleston Naval Complex (October 2006), Appendix G: Statement of Need, p. 4, www.porteis.com/project/documents_library/Appendicies/AppendixG-SCSPANeeds.pdf.
- Michaelangelo Conte, “Jersey City’s Global Container Terminals unveils $325 million expansion project,” Jersey Journal (June 18, 2014), www.nj.com/hudson/index.ssf/2014/06/jersey_citys_global_container_terminals_unveils_325_million_expansion_project.html.
- This would likely require additional capital investment beyond currently planned. Calculation assumes an average annual increase in capacity per acre of less than 2 percent per year; however, increases in capacity tend to be experienced in stages as capital investments begin operation. Some terminal operators expressed this capacity goal may be impractical due to the local nature of the port; however Port Commerce officials did not reach this conclusion.
- The former tenant’s business plan hinged on moving cargo unloaded in Brooklyn by barge to New Jersey. In a 2011 memo to Governor Cuomo, Port Authority officials estimated the barge service had cost the port $54 million over the previous 15 years. See: Shawn Boburg, “Port Authority dock deal probed,” North Jersey Record (August 26, 2014), www.northjersey.com/news/port-authority-dock-deal-probed-1.1076366?page=all.
- In addition recent tenant relationships suggest the container terminal at Red Hook is not financially viable even with a terminal operator tenant. Red Hook’s former tenant, American Stevedoring Inc., is reported to have received $64 million in public subsidies to continue operating. See: Shawn Boburg, “Port Authority dock deal probed,” North Jersey Record (August 26, 2014), www.northjersey.com/news/port-authority-dock-deal-probed-1.1076366?page=all.
- New York City Department of Planning, Community Portal, “BROOKLYN Community District 6 – District Profile” (accessed October 22, 2014), www.nyc.gov/html/dcp/html/neigh_info/bk06_info.shtml; and “Borough of Brooklyn” (accessed October 22, 2014), www.nyc.gov/html/dcp/pdf/neigh_info/profile/bkboro_profile.pdf.
- CBC staff recognizes that previous divestures of PANYNJ property have not generated revenue for the Authority.
- Calculations based on buildable square footages using FARs of 3.0 and 5.0. The figures assume each housing unit requires 1,200 square feet of space.
- Thornton McEnery, “Brooklyn Navy Yard renews 16 leases,” Crain’s New York Business (June 6, 2014), www.crainsnewyork.com/article/20140606/REAL_ESTATE/140609911/brooklyn-navy-yard-renews-16-leases.
- Estimation based on direct quote from the Port Authority that assumes the port at Red Hook created 700 direct jobs in 2012. No current analysis of direct jobs supported by the facilities is publicly available. Red Hook Container Terminal employed 250 workers in 2010, but the tenant at that time has since been replaced. See: Christine Haughney, “In a Plan to Close a Customs Post, Seeing Harm for Beer, Bananas and a Port Itself,” New York Times (January 24, 2012), www.nytimes.com/2012/01/25/nyregion/red-hook-facing-loss-of-customs-inspection-station.html; and Empire State Development, “American Stevedoring, Inc. Working Capital – Empire State Economic Development Fund - General Development Financing (Working Capital Loan),” (June 24, 2010), http://esd.ny.gov/AboutUs/Data/BoardMaterials/June2010/June%2024/14_American_Stevedoring.pdf.
- Brooklyn Greenway Initiative, The Greenway, “Use It Now” (accessed October 22, 2014), www.brooklyngreenway.org/the-greenway/map/.
- Tom Wrobleski, “With West Shore development percolating, new chief of New York Container Terminal optimistic about the future,” Staten Island Live (August 11, 2014), www.silive.com/news/index.ssf/2014/08/with_west_shore_development_pe.html.
- Staff of the Port Authority of New York and New Jersey, Port Commerce, briefing to CBC staff (July 23, 2014).
- Citizens Budget Commission, Taxes In, Garbage Out, The Need for Better Solid Waste Disposal Policies in New York City (May 2012), pp. 15-20, www.cbcny.org/sites/default/files/REPORT_SolidWaste_053312012.pdf.
- "New York Container Terminal Signs Deal to Handle Waste,” Journal of Commerce (September 16, 2013), www.joc.com/port-news/terminal-operators/new-york-container-terminal/new-york-container-terminal-signs-deal-handle-waste_20130916.html.
- While the CFC has thus far withstood legal challenges, the fee is unpopular in Trenton and in Albany. New Jersey has passed legislation to prohibit the Port Authority from levying the fee and companion legislation has been introduced in New York’s state legislature.
- Leases for tenants at Howland Hook, Port Elizabeth-Port Authority Marine Terminal, and Port Newark all expire between 2029 and 2031. Global Terminal at Port Jersey-Port Authority Marine Terminal expires in 2047.
- Calculations are based on an average annual growth rate in container traffic of 4.1 percent, in bulk cargo traffic of 0.5 percent, and in waterborne vehicles of 1 percent.
- The current contract lasts six years. Assuming subsequent contracts also last six years New York-New Jersey will be negotiating the second iteration between now and the expiration of New York Container Terminal’s lease.
- Alan Feuer, “On the Waterfront, Rise of the Machines,” New York Times (September 28, 2012), MB 1, www.nytimes.com/2012/09/30/nyregion/in-new-yorks-port-the-rise-of-the-machines.html?pagewanted=all.
- Federal Maritime Commission, Bureau of Trade Analysis, USMX-ILA Master Contract, Memorandum of Settlement between United States Maritime Alliance, LTD. and International Longshoremen’s Association, AFL-CIO, Agreement No. 201157-003 (August 28, 2013), www2.fmc.gov/agreement_lib/201157-003.pdf.
- Federal Maritime Commission, Bureau of Trade Analysis, Memorandum of Settlement of Local Conditions in the Port of New York and New Jersey, Agreement No. 201159-001 (August 28, 2013), www2.fmc.gov/agreement_lib/201159-001.pdf.
- Marc Levinson, The Box: How the Shipping Container Made the World Smaller and the World Economy Bigger (Princeton University Press, 2006), p. 17.
- Waterfront Commission of New York Harbor, Special Report of the Waterfront Commission of New York Harbor to the Governors and Legislatures of the States of New York and New Jersey (March 2012), p. 3, www.waterfrontcommission.org/news/Waterfront%20Commission%20of%20New%20York%20Harbor%20Special%20Report.pdf.
- International Longshoremen’s Association, “International Longshoremen’s Association, ALF_CIO Contract Issues with United States Maritime Alliance” (December 20, 2012), www.ilaunion.org/news_Contract_Issues.html.
- The first and third container royalties, introduced in 1960 and 1977 respectively, are each in the amount of $1 per ton of containerized cargo handled by ILA labor. These assessments are pooled across all ILA ports, divided among longshoremen based on seniority, and distributed as cash payments at the end of the year. The second container royalty fund, established in 1971, is an additional $1 per ton on container cargo; these fees fund the health trust fund managed by the Management-International Longshoremen’s Association (MILA). A fourth container royalty levy of $1.15 was added to fund the MILA trust fund but later abolished. In 2010 a fifth container royalty of $0.70 per ton was established to provide support to employee benefit plans at local ports or districts. See: Joseph Bonney, “ILA Dockworkers Approve Contract,” Journal of Commerce (April 10, 2013), www.netamlines.com/2013/04/carriers-file-ila-strike-surcharge-notices/; United States Maritime Alliance, Master Contract Between United States Maritime Alliance, LTD. and International Longshoremen’s Association, AFL-CIO (2004), p. 20, http://usmx.com/assets/content/public-resources/USMX-ILA_MC--2004-2010.pdf; and United States Maritime Alliance, USMX-ILA Master Contract Memorandum of Settlement Between United States Maritime Alliance, LTD. and International Longshoremen’s Association, AFL-CIO, (2009), p. 8, http://usmx.com/assets/content/public-resources/USMX-ILA__MC--2004-2010--_EXTENSION__MOS--10-16-09.pdf.
- Federal Maritime Commission, Bureau of Trade Analysis, NYSA-ILA Assessment Agreement, Amendment 000 (September 24, 2004), p.1, http://www2.fmc.gov/agreement_lib/201162-000.pdf.
- Federal Maritime Commission, Bureau of Trade Analysis, NYSA-ILA Assessment Agreement, Amendments 000-010 (August 20, 2014), www2.fmc.gov/agreements/amend_func.aspx.
- The actual rate of savings would depend on the longshoremen selected for the gang, their training and seniority.
- Estimate assumes $3.70 ILA assessment per ton for 33.85 million tons processed at New York-New Jersey ports in 2013. Estimate also assumes an average of $72.20 per container NYSA assessment. This estimate assumes 66 percent of containers require the $94 levy of House Containers Within 260 Miles, 23 percent of containers are empty and require the $40 levy, and the remaining 13 percent of containers require a $10 assessment for Loaded Rail Containers. United States Maritime Alliance, Container Royalty Central Collection Fund System Development Status Report (December 31, 2013), Year-over-Year Tonnage Report Data, p. 29, www.crccfund.org/wp-content/uploads/2014/01/CRCCF-Status-December-2013.pdf; The Port Authority of New York and New Jersey, Port of New York and New Jersey, “Loaded Containers in TEUs and Total ExpressRail Lifts by Month” (accessed November 17, 2014), 2013 Total TEUs, www.panynj.gov/port/monthly-loaded-containers.html; and Federal Maritime Commission, Bureau of Trade Analysis, NYSA-ILA Assessment Agreement, Amendments 000-010 (August 20, 2014), www2.fmc.gov/agreements/amend_func.aspx.