Sisyphus and Subway Stations
In Greek mythology the gods condemned King Sisyphus to push a boulder up a hill repeatedly, only to have it roll down to the bottom as he approached the top. While he deserves no such punishment, Thomas Prendergast, Chairman and Chief Executive Officer of the Metropolitan Transportation Authority (MTA), must identify with Sisyphus’ fate as he prepares the agency’s capital program, particularly when it comes to rehabilitating and repairing 467 subway stations. As hard as he and his colleagues try to bring the stations to a satisfactory condition—known as a “state of good repair” or SGR—heavy use of the system creates new needs and the goal eludes them. Even if the proposed five-year capital plan for 2015-2019 were fully funded—which it is not—the MTA’s current and planned pace of work would never bring all stations to SGR.
This policy brief examines the nature of the problem and addresses two questions: (1) Given the limited resources available, does the MTA allocate available funding wisely? and (2) What might be done to make the goal of reaching SGR for all stations more achievable?
The answer to the first question is that the MTA sets appropriate priorities in picking stations to rehabilitate and repair. Recommendations that address the second question include reallocating available capital funds from new expansion projects to SGR work, improving the management of station projects to lower costs and permit more progress with available funds, and experimenting with new models of public-private partnerships at selected stations to secure additional capital and implement projects more efficiently.
The Sisyphean Problem
In the early 1980s then-MTA Chairman Richard Ravitch sought to bring the neglected transit system to SGR in 10 years. The agency’s first two capital investment plans, spanning 1982 to 1991, pursued that goal by authorizing commitments totaling $14.4 billion, including $835 million for subway stations.1 (See Table 1.) Initial plans assumed stations work would be primarily surface repairs; however, once construction work began, structural problems emerged and required more complex and expensive improvements.
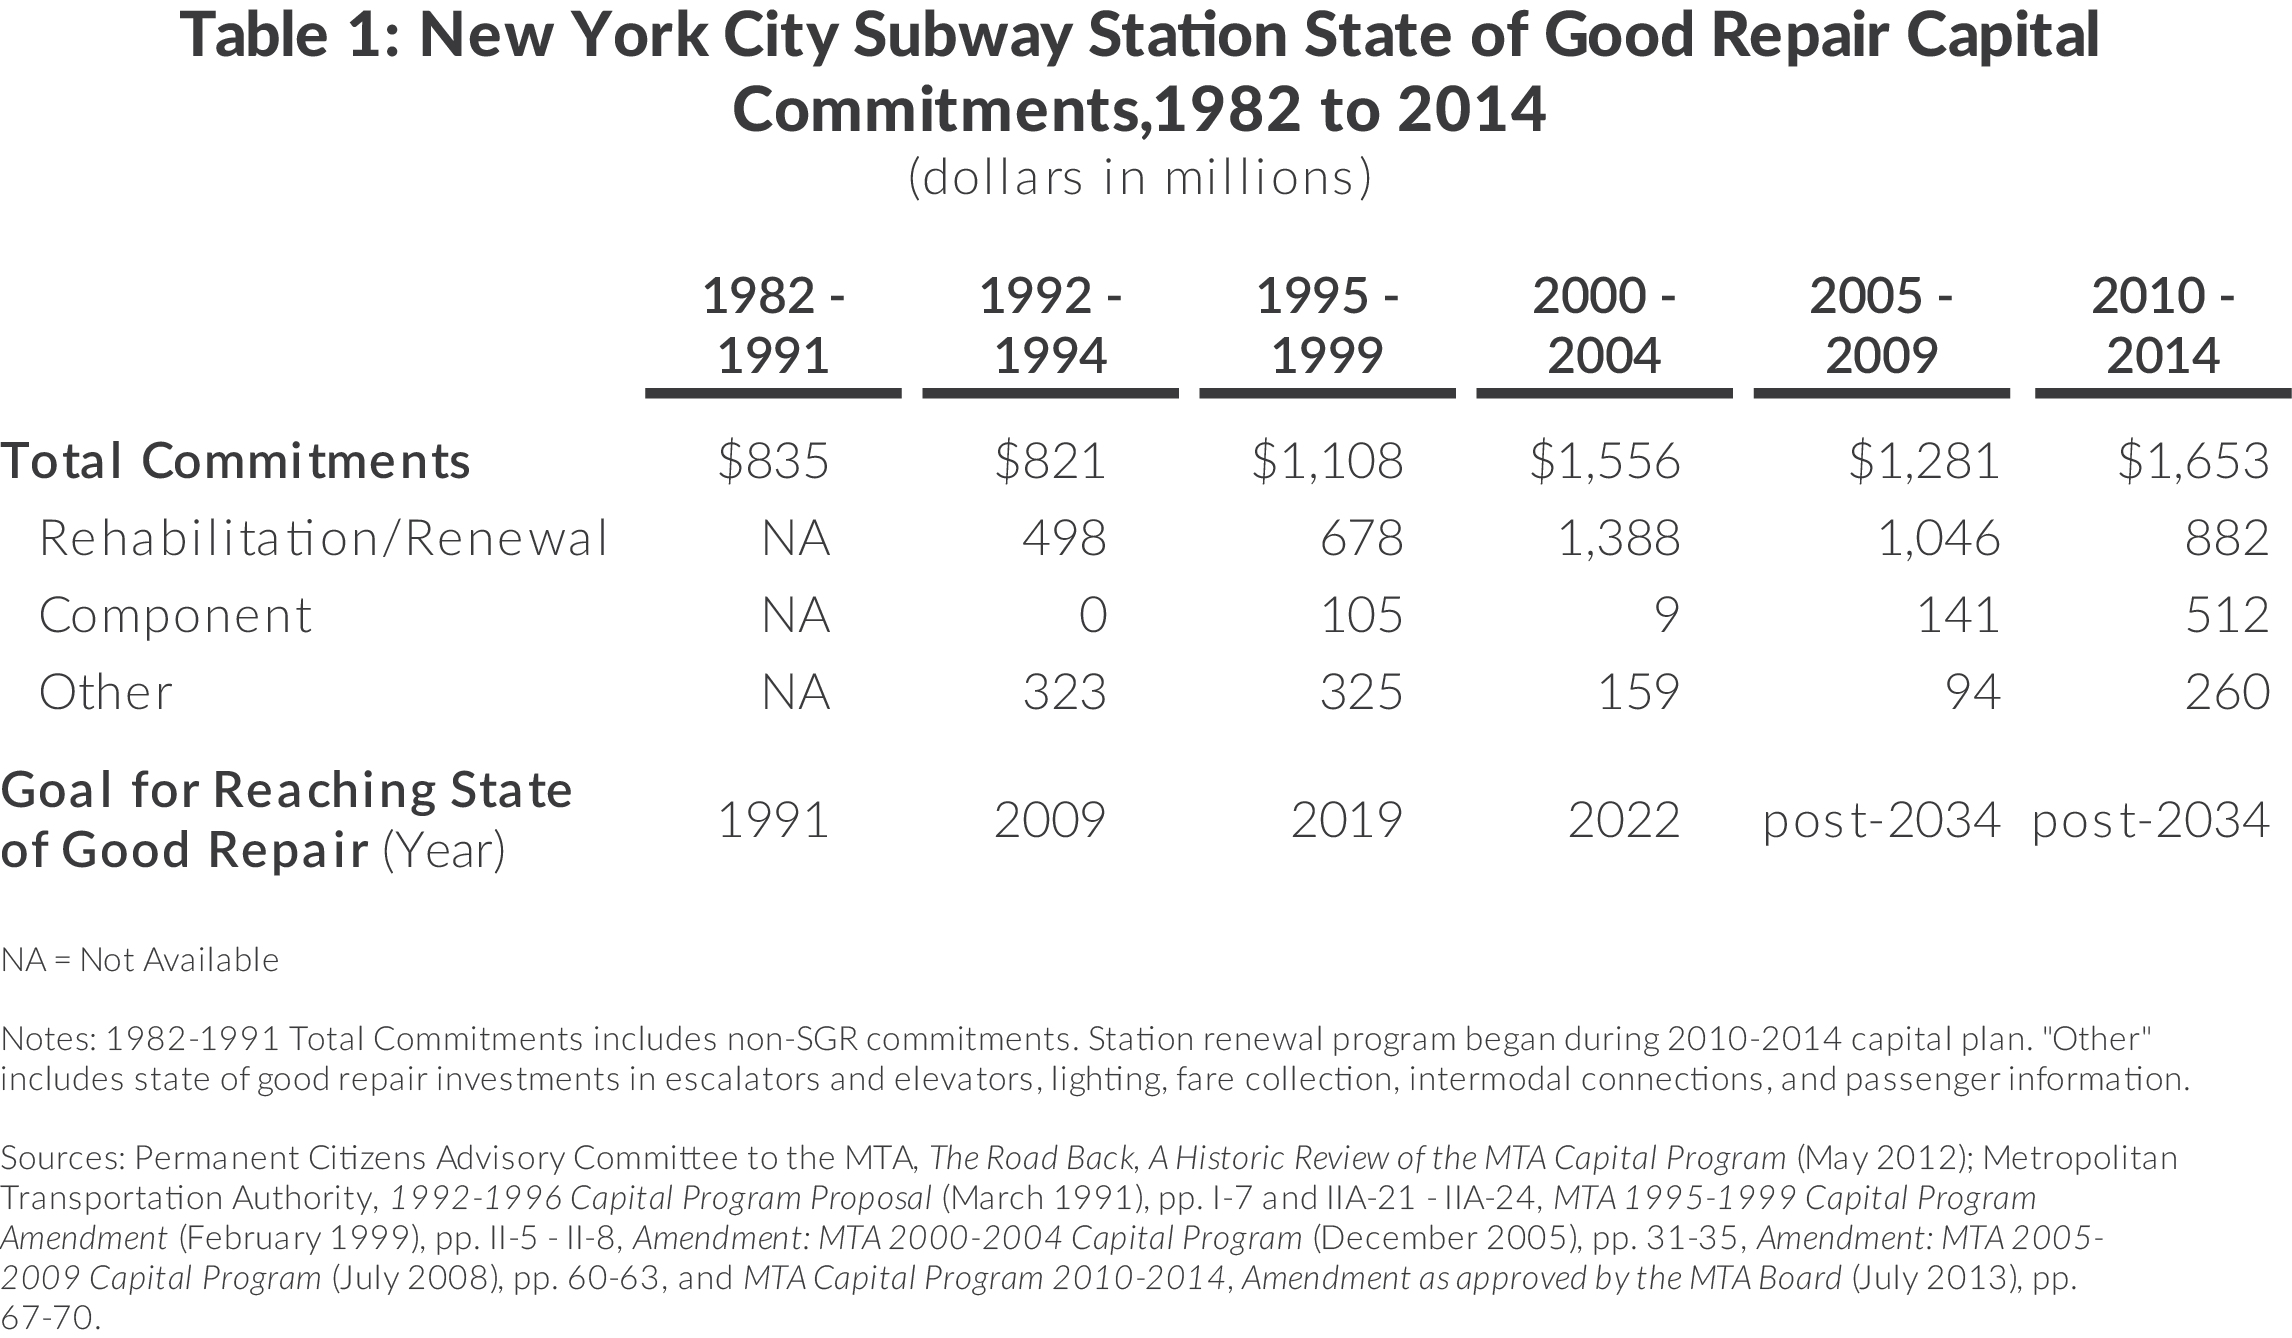
Based on its experience during the 1980s, the MTA in 1992 revised its approach to stations by fully rehabilitating them and set a target date of 2009 for achieving SGR, 27 years from the 1982 start. In 1995 the goal was delayed another 10 years to 2019. During the 1992 to 1999 period the MTA rehabilitated 70 stations, an average of less than nine per year, at an estimated cost of nearly $1.2 billion.2
The 2000-2004 capital plan implemented a faster pace of rehabilitation, allocating $1.4 billion, more than double the pace of spending in the previous decade. By continuing work at this pace, the MTA expected to bring all stations to SGR by 2022; however, the allocation for station investment was reduced in the 2005- 2009 plan and no specific date for achieving SGR was set.
Basic arithmetic reveals the troubling nature of this work. For planning purposes the MTA assumes a station’s “useful life” is 35 years; that is, a station requires rehabilitation every 35 years in order to maintain SGR.3 To keep 467 stations in SGR would require an average of about 13 rehabilitations per year. Since 2000 the MTA has averaged about 10 per year.4
After adoption of the 2005-2009 plan the MTA recognized the limitations of the rehabilitation strategy and shifted to a new approach. Instead of rehabilitating an entire station, new work would focus on only those elements or “components” of a station in disrepair. Station components are classified as “architectural” or “structural.” Architectural components relate to the appearance of a station and include its wall tiles, lighting, and painting condition. Structural components relate to functionality and safety and include stairs, platform edges, and ventilators; the system has 15,275 structural components.5 In 2007, and again in 2012, the MTA surveyed all station components and scored each between 1 (best) and 5 (worst). Components ranked 5 require immediate repair and are addressed in the maintenance budget. Components with scores between 3.0 and 4.5 are considered not in SGR, with higher scores reflecting more deteriorated conditions.
Based on the 2007 survey the MTA began shifting funding in the 2005-2009 plan from station rehabilitation projects to component work, and the 2010-2014 plan was the first formulated relying primarily on the component strategy. It included $512 million for work on individual components at multiple stations and $882 million for station “renewals,” projects that address multiple components at a station.
Despite this change, the system’s stations are still far from SGR.6 After completion of projects in the 2010-2014 plan, 3,195 structural components, or more than one of every five— 21 percent—will not be in SGR.7 This includes one of every three ventilators, one of every three platform edges, and one of every six stairs.
More troubling is the prospect that the component strategy will still never be able to bring all stations to a SGR. The practical useful life of a component varies based on use and environment of a station; however, even if components average useful life were 70 years—that is, twice as long as the MTA currently assumes—an average of 218 structural components, or 1.4 percent of the total, would reach the end of their useful lives and no longer be in SGR each year. The current pace of work under the 2010-14 plan is mitigating an average of 280 components per year.8 At this pace of progress SGR for all station components would not be achieved until 2067.9
Triage for the Next Five Years
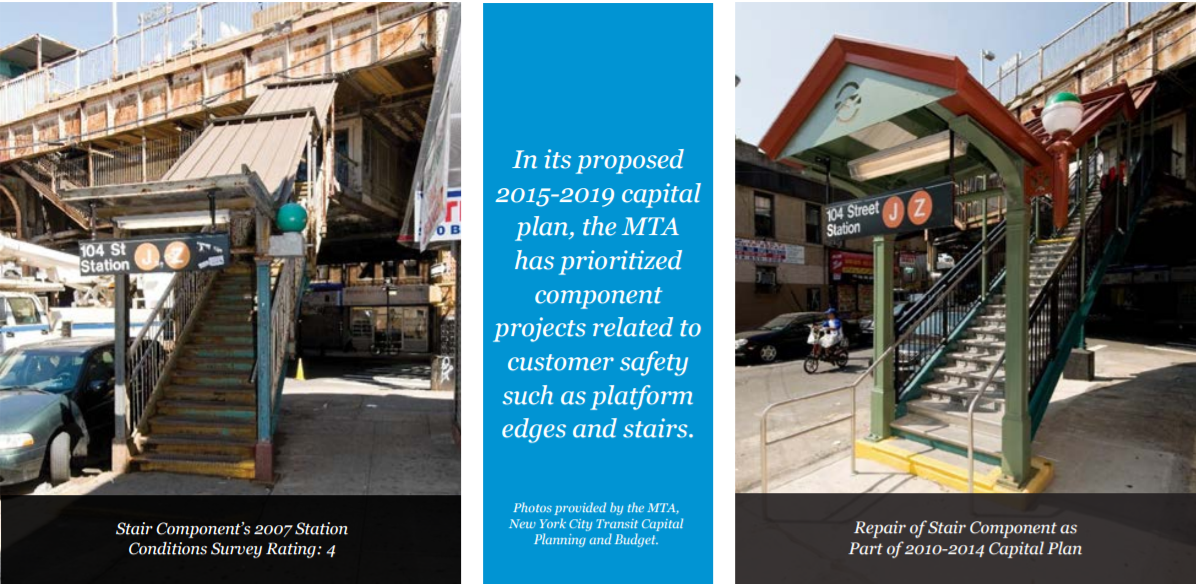
Given the dismal prospects for bringing all stations to SGR, the MTA must choose which components to repair one capital plan at a time. For the 2015-2019 capital plan the agency seeks to repair or replace all components rated 4 or higher and all stairs and platform edges, two components related to passenger safety, rated 3.5 or higher.10 Additionally the MTA will conduct 20 station renewals at stations with high shares of structural components rated 3.5 or higher. In total the proposed 2015-2019 capital program will address 750 structural components.11 The proposed plan includes $1,338 million for projects to improve station components: $890 million for repairing 420 structural components at 179 different stations and $448 million for 20 station renewals addressing 330 structural components.
Renewals are closely aligned with the “neediest” stations by share of structural components not in SGR: all but two have at least half of their structural components not in SGR. The other two—Mets-Willets Point and Astoria-Ditmars Boulevard—lay just outside this boundary, having 49 percent and 47 percent of structural components not in SGR, respectively.12 (See Table 2. For a full list of stations and their component ratings, consult our interactive stations map at http://interactive.cbcny.org/ nyct-station-conditions.)
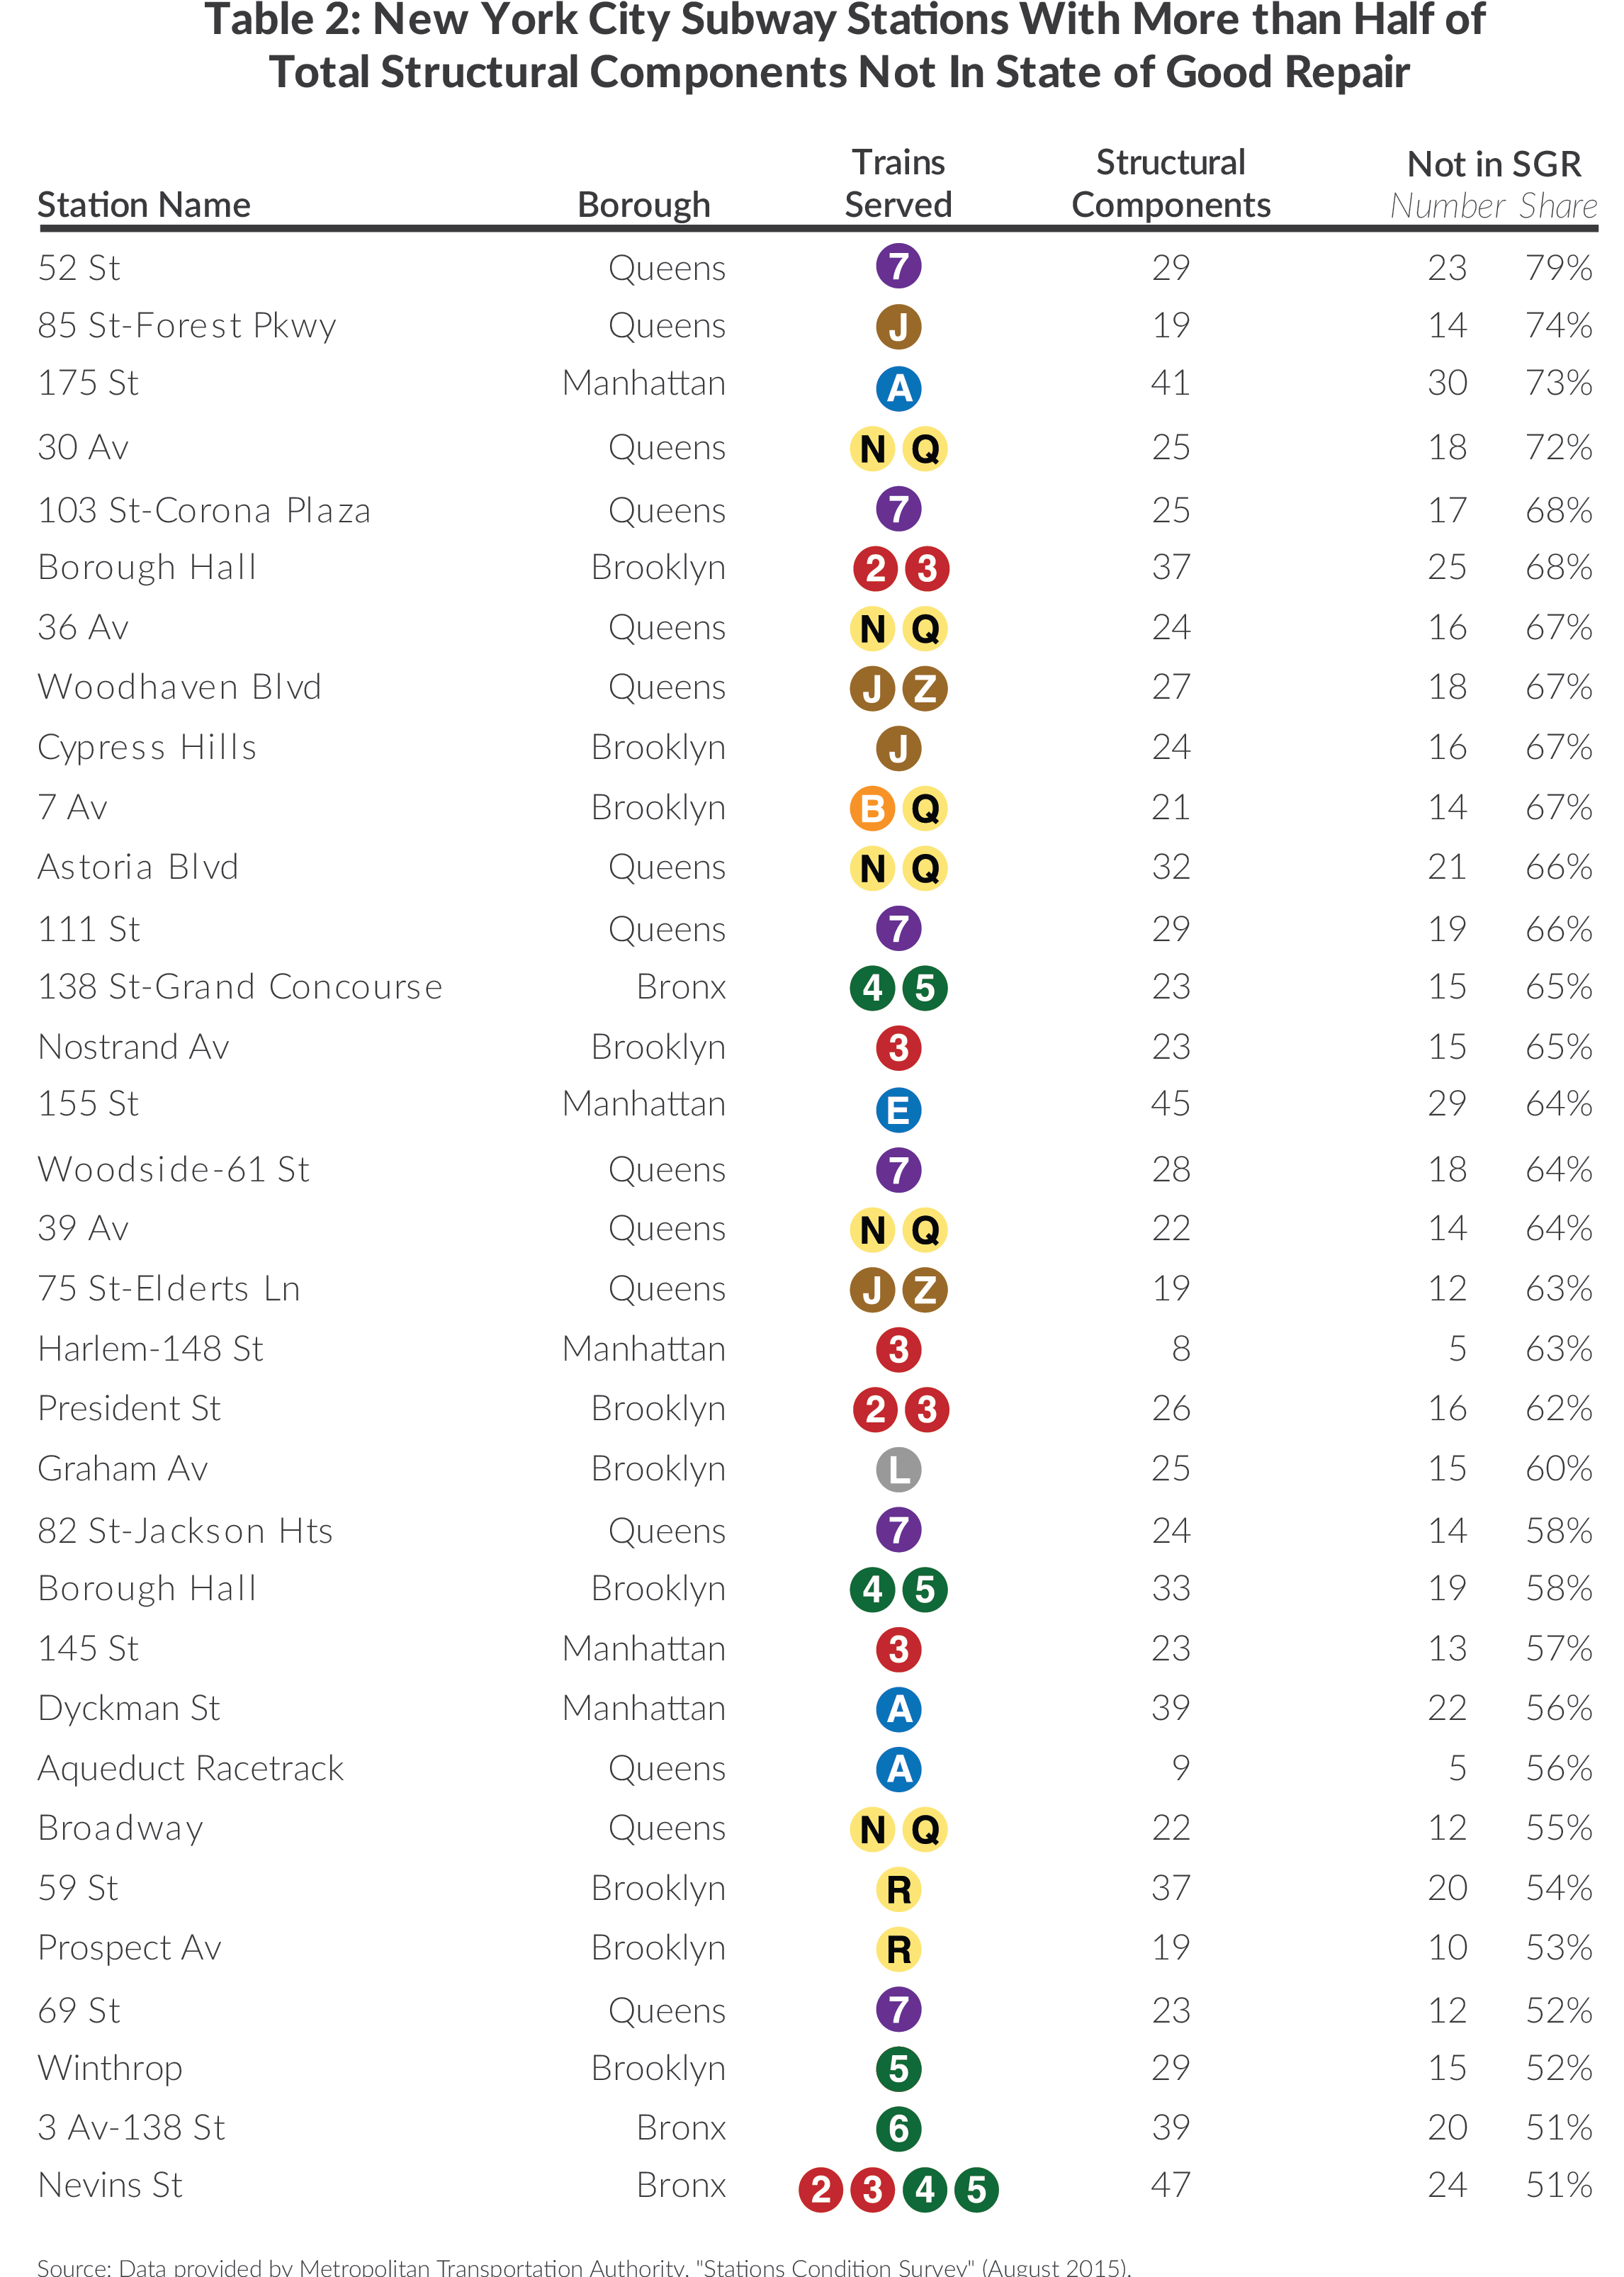
Component projects do not necessarily align with shares of components not in SGR. Projects are allocated using individual component ratings, with an emphasis on passenger safety. Nonetheless many stations with more than half of all structural components not in SGR are included in the MTA’s proposed component projects in the 2015-2019 plan. Only two stations on this list will not see work in the proposed plan. The Nostrand Avenue station appears to be the “needier” of the two, with 15 of 23 structural components, or 65 percent, not in SGR. The Aqueduct Racetrack station has five of nine components not in SGR. On the other hand, Kingsbridge Road station serving the 4 train (not listed above), has only one platform component not in SGR, but will see that mitigated in the 2015-2019 plan.
Elevators, Escalators, and Accessible Stations
The previously discussed $1.3 billion in station work relates to structural and architectural components; however, the MTA’s proposed capital plan includes another $997 million in investments for elevators, escalators, and accessibility improvements. Approximately half of this amount, $436 million, is for overhauling and replacing 46 elevators and 35 escalators. The other half, $561 million, is to make 13 stations accessible for all users. Following the passage of the Americans with Disabilities Act (ADA) in 1990, the Federal Transit Administration and the MTA came to an agreement to adapt 100 “key stations” by 2020.13 Adapting subway stations to make them accessible, some built more than 100 years ago, is complicated and can be costly. At $43 million per station in the proposed plan, ADA accessibility projects are more than double the cost of most station renewals. Still the MTA is ahead of schedule: by the end of 2016, 89 key stations will be ADA-compliant with the last 11 key stations addressed in the proposed capital plan.14
Long-run Strategies for Achieving SGR
The MTA’s triage strategy addresses the neediest parts of stations, but achieving SGR will require significant policy changes. A revamped strategy should contain three critical actions: (1) reallocate funds from system expansions to SGR work; (2) improve the management of projects so that more can be achieved with available funds; and (3) develop new public-private partnerships to make available private capital investment in the stations and lower rehabilitation costs.
Prioritize SGR
The Citizens Budget Commission has previously criticized the MTA for allocating large sums to expansion projects without conducting or publicizing a rigorous assessment of these projects and for initiating expansions at the expense of existing assets.15 The proposed 2015-2019 plan makes minimal progress toward SGR for stations and other infrastructure elements, but includes $5.5 billion for expansion projects across the mass transit system. While $2.8 billion of this sum is for continued work on the East Side Access project, another $1.5 billion is to begin work on Phase Two of the Second Avenue Subway, and another $743 million is to begin work on Penn Station Access, a project to build new stations for Metro-North Railroad in the Bronx and have it serve Penn Station.
Diverting some of the new expansion project funds to SGR work would have a significant impact on the pace of achieving SGR in subway stations. Assuming repairing additional station components entails costs similar to those in the proposed plan, each additional $100 million added to the plan would address as many as 73 more components not in SGR annually. An additional $360 million or $433 million per year would be needed in order to reach SGR in 30 years or 20 years, respectively. If reallocated, commitments in the proposed 2015-2019 capital plan for the second phase of the Second Avenue Subway would provide 85 percent and 71 percent, respectively, of these sums.
Improve Project Management
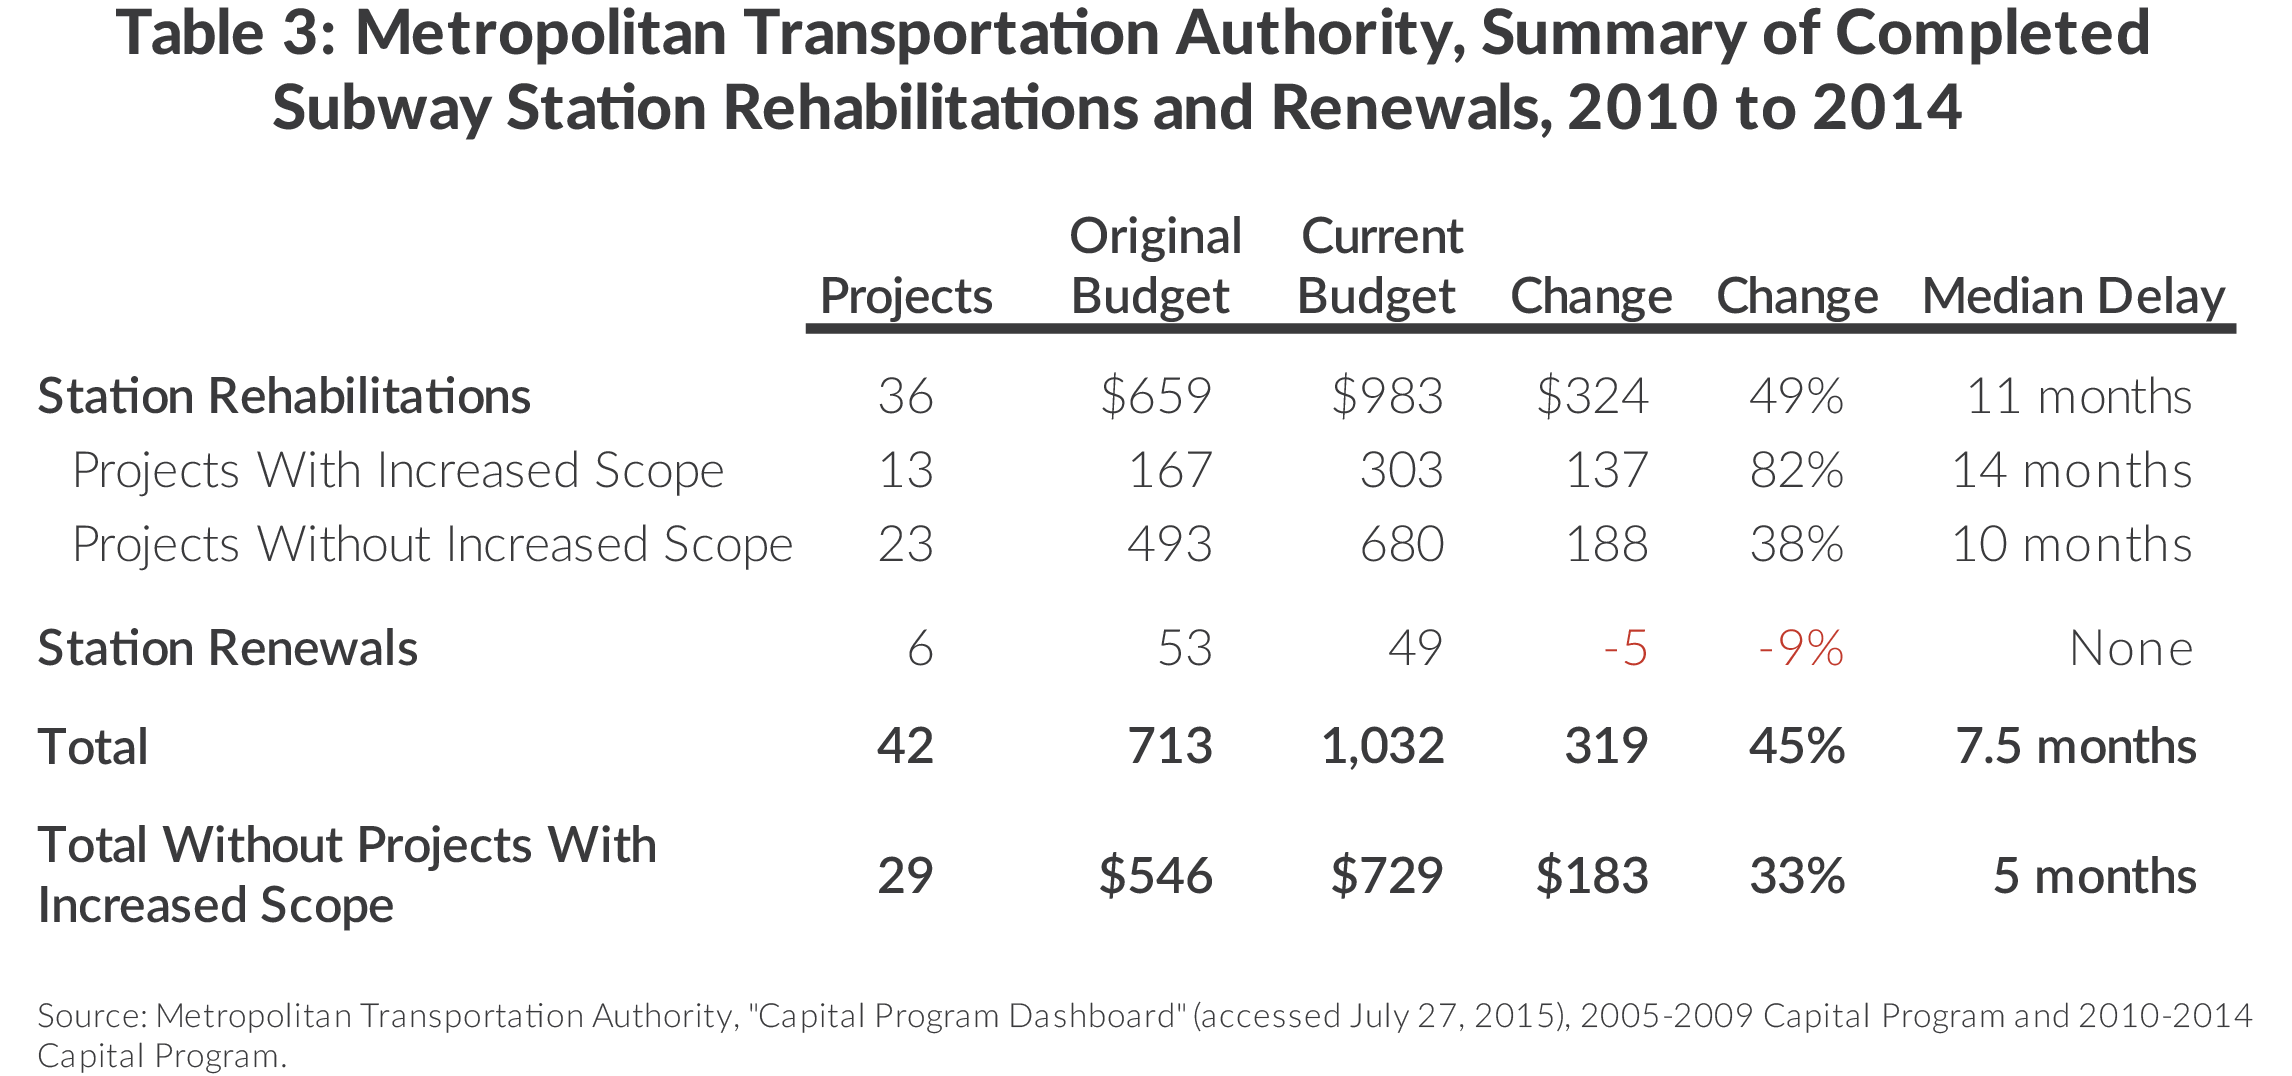
More could be accomplished if projects were better managed to avoid delays and cost overruns. Table 3 summarizes the record for the 42 station rehabilitations and renewals completed between November 2010 and January 2014. While 14 of the projects had no cost overruns, 28 incurred cost increases, including 10 that more than doubled and two that more than tripled. Among those projects, 13 increased the scope of the project, likely contributing to cost overruns. Other projects with no change in scope showed increased costs 33 percent above budgeted levels.16
The MTA contends the delays and cost overruns are related to a noncompetitive bidding environment from 2005 to 2009: planned projects were budgeted at levels lower than contractors were willing to do the work during this economic boom. Other reasons for overages include the discovery of additional structural problems once a project began.17 Despite these factors, improving project management could yield significant sums to redeploy to other station work. For example, saving 10 percent on budgeted commitments would be the equivalent of adding more than $139 million to the $1.3 billion for station work in the proposed 2015-2019 plan; reducing costs by 25 percent would yield $335 million.
Make Effective Use of Public-Private Partnerships
Increased use of public-private partnerships (P3s) can inject private sector capital and expertise to station work to enhance progress toward SGR. While the MTA already uses some forms of P3s, others are promising and worth exploring. For example, the agency recently estimated savings of 6 percent to 8 percent, or $2.2 billion, from expanded use of design-build and other P3s.18 These options provide opportunities to transfer risk and take advantage of the expertise of the private sector to expedite project timelines.
One type of partnership is the exchange of privately financed station work for additional development rights. The 2014 agreement with SL Green, the developer of One Vanderbilt, a 65-story office tower adjacent to Grand Central Terminal, includes $210 million in subway station improvements to be completed by the developer.19
Another model is that of the New York City Department of Parks and Recreation and its parks conservancies. By partnering with other private and non-profit partners, such “station conservancies” could marshal resources to rehabilitate and maintain stations on an ongoing basis. Appropriate governance and regulation of these conservancies is required to avoid abuses and inequities among neighborhoods, but they can yield significant public benefits.20
Another relevant form of P3 would assign to a private firm or consortium responsibility for financing and implementing capital work and maintaining those stations over their expected useful life.21 The entity would also be given a right to pursue revenues from stations from concessions and advertising. The cost of private capital would be higher than interest on capital raised directly by the MTA through tax-exempt borrowing; however, these costs may be more than offset by private firms’ more efficient construction, reduced upkeep costs of better-designed stations, more diligent maintenance cycles, and more aggressive and imaginative pursuit of revenue opportunities at stations. Even if increased, such revenues are not likely to recover fully private capital and maintenance costs, meaning availability payments from the MTA, conditioned on satisfactory performance, would be necessary.
P3 arrangements have a mixed record in the transportation sector in the United States and overseas. London Underground’s experience with P3s proved problematic, particularly for maintenance of existing infrastructure; a P3 can leave public agencies at risk when private parties fail to perform adequately.22 Still, a well-designed experiment at subway stations could lead to a model that allows an increased pace of investment as well as a higher standard of maintenance than has been achieved by the MTA in recent years.23
Conclusion
As the MTA finalizes a revised 2015-2019 capital plan for approval by the Capital Program Review Board, it should pursue the recommended strategies. The agency should reallocate resources from expansions to state of good repair work and it should improve its project management practices. The MTA should also identify opportunities for introducing station conservancies and inviting private partners into station-related P3s. Although these strategies require careful consideration and reform of longstanding practices, the MTA should not wait to take innovative action. Instead of continuing to imitate Sisyphus, the agency’s leaders should set new goals and adopt new practices.
Download Report
Sisyphus and Subway StationsFootnotes
- Permanent Citizens Advisory Committee to the MTA, The Road Back, A Historic Review of the MTA Capital Program (May 2012), www.pcac.org/wp-content/uploads/2014/09/The-Road-Back.pdf.
- Metropolitan Transportation Authority, 1992-1996 Capital Program Proposal (March 1991), pp. I-7 and IIA-21-IIA-24; MTA 1995-1999 Capital Program Amendment (February 1999), pp. II-5-II-8; and Regional Plan Association, Overlooked Boroughs, Where New York City’s Transit Falls Short and How to Fix It (February 2015), Table 11, p. 34, http://library.rpa.org/pdf/RPA-Overlooked-Boroughs-Technical-Report.pdf.
- Metropolitan Transportation Authority, Capital Needs Assessment 2015-2034 (October 2013), p. 31, http://web.mta.info/mta/capital/pdf/TYN2015-2034.pdf.
- Regional Plan Association, Overlooked Boroughs, Where New York City’s Transit Falls Short and How to Fix It (February 2015), Table 11, p. 34, http://library.rpa.org/pdf/RPA-Overlooked-Boroughs-Technical-Report.pdf.
- This analysis focuses on the MTA’s progress in replacing or repairing deficient structural components because the MTA prioritizes fixing structural components over architectural components. Data provided by Metropolitan Transportation Authority, “Station Conditions Survey” (August 2015).
- The New York State Comptroller reviewed conditions in 2014 and found 27 percent of structural components not in SGR, with 4 percent displaying serious defects. See: State of New York, Office of the State Comptroller, Metropolitan Transportation Authority: Subway Station Conditions (October 2014), 8-2015, www.osc.state.ny.us/osdc/rpt8-2015.pdf.
- Data provided by Metropolitan Transportation Authority, “Station Conditions Survey” (August 2015).
- The MTA calculates all component and renewal projects in the 2010-2014 capital program, which are largely awarded or at least designed, will address approximately 1,400 structural components. Dividing this total by five years leads to 280 components mitigated per year.
- This assumes a net decrease in components not in SGR of 62 per year (280 less 218).
- The MTA will address selected ventilators rated 3.5 or higher if other ventilators rated 4 or higher at the same location are scheduled for repair or replacement.
- Based on information provided through personal communication dated August 7, 2015, the agency expects this number to increase as work begins and other deficient components are identified. For example, the 2010-2014 capital program included projects to address 1,000 structural components. It has now expanded approximately 40 percent. The MTA anticipates a similar expansion in the 2015-2019 program and the proposed budget amounts reflect this expansion.
- These stations are part of renewal packages that include other adjacent stations on the same line. The addition of these stations may be linked to possible economies of scale in contracting these stations together.
- Characteristics of key stations include: (1) ridership exceeds average station ridership by at least 15 percent, (2) transfers to other rail lines, (3) major interchange point with other modes, (4) end-of-line stations, and (5) major activity centers of employment, public services, education, health care facilities, or other facilities that are major trip generators for individuals with disabilities. See: Transportation Services for Individuals with Disabilities 49 Fed. Reg. 37 (October 1, 2007). 8 14 Metropolitan Transportation Authority, MTA Capital Program 2015-2019, Renew, Enhance, Expand (September 24, 2014), p. 50, http://web.mta.info/capital/pdf/Board_2015-2019_Capital_Program.pdf.
- Citizens Budget Commission, Misplaced Priorities in the MTA’s Capital Plan (October 2014), www.cbcny.org/content/misplaced-priorities-mta%E2%80%99s-capital-plan.
- Metropolitan Transportation Authority, “Capital Program Dashboard” (accessed June 1, 2015), Capital Plan 2005-2009, New York City Transit, Passenger Stations, http://web.mta.info/capitaldashboard/CPDHome.html?AGY=a&PLN=5&RPT=c.
- Staff of Metropolitan Transportation Authority, briefing to CBC staff (August 7, 2015).
- Metropolitan Transportation Authority, “MTA Chairman Suggests Resolution For Capital Program Funding” (press release, July 23, 2015), www.mta.info/press-release/mta-headquarters/mta-chairman-suggests-resolution-capital-program-funding.
- Andrew J. Hawkins, “$210M upgrade for Grand Central’s subway unveiled,” Crain’s New York Business: The Insider (September 8, 2014), www.crainsnewyork.com/article/20140908/BLOGS04/140909874/-210m-upgrade-for-grand-centrals-subway-unveiled.
- Citizens Budget Commission and New Yorkers for Parks, Making the Most of Our Parks (September 2007), www.cbcny.org/sites/default/files/reportsummary_parks_09012007.pdf.
- For a discussion for similar examples, see: Citizens Budget Commission, How Public-Private Partnerships Can Help New York Address Its Infrastructure Needs (November 2008), pp. 15-20, www.cbcny.org/sites/default/files/report_ppp_12112008.pdf.
- Mark Gannon, A Re-examination of the Public-Private-Partnership Discourse: Was PPP the Way to Upgrade London Underground’s Infrastructure? Association for European Transport and Contributors (2011), www.worldtransitresearch.info/research/4381/.
- Federal Highway Administration, Office of Innovative Program Delivery, International Public-Private Partnership Synthesis Report (prepared by Parsons Brinckerhoff, April 3, 2013), www.fhwa.dot.gov/ipd/pdfs/ p3/ipd_task_4_international_p3_report_050913.pdf; and Congressional Budget Office, Using Public-Private Partnerships to Carry Out Highway Projects (January 2012), www.cbo.gov/sites/default/files/01-09-PublicPrivatePartnerships.pdf.