New York City Property Taxes
3 Things Owners and Renters Should Know
The property tax is New York City’s largest source of revenue. It is projected to generate $24 billion in fiscal year 2017, or 44 percent of all City tax revenues and about twice as much as the second largest source, the local personal income tax. The Preliminary Budget for fiscal year 2018, to be released by Mayor Bill de Blasio in January, will likely project growing property tax revenues despite the Mayor’s commitment to not increase property tax rates.
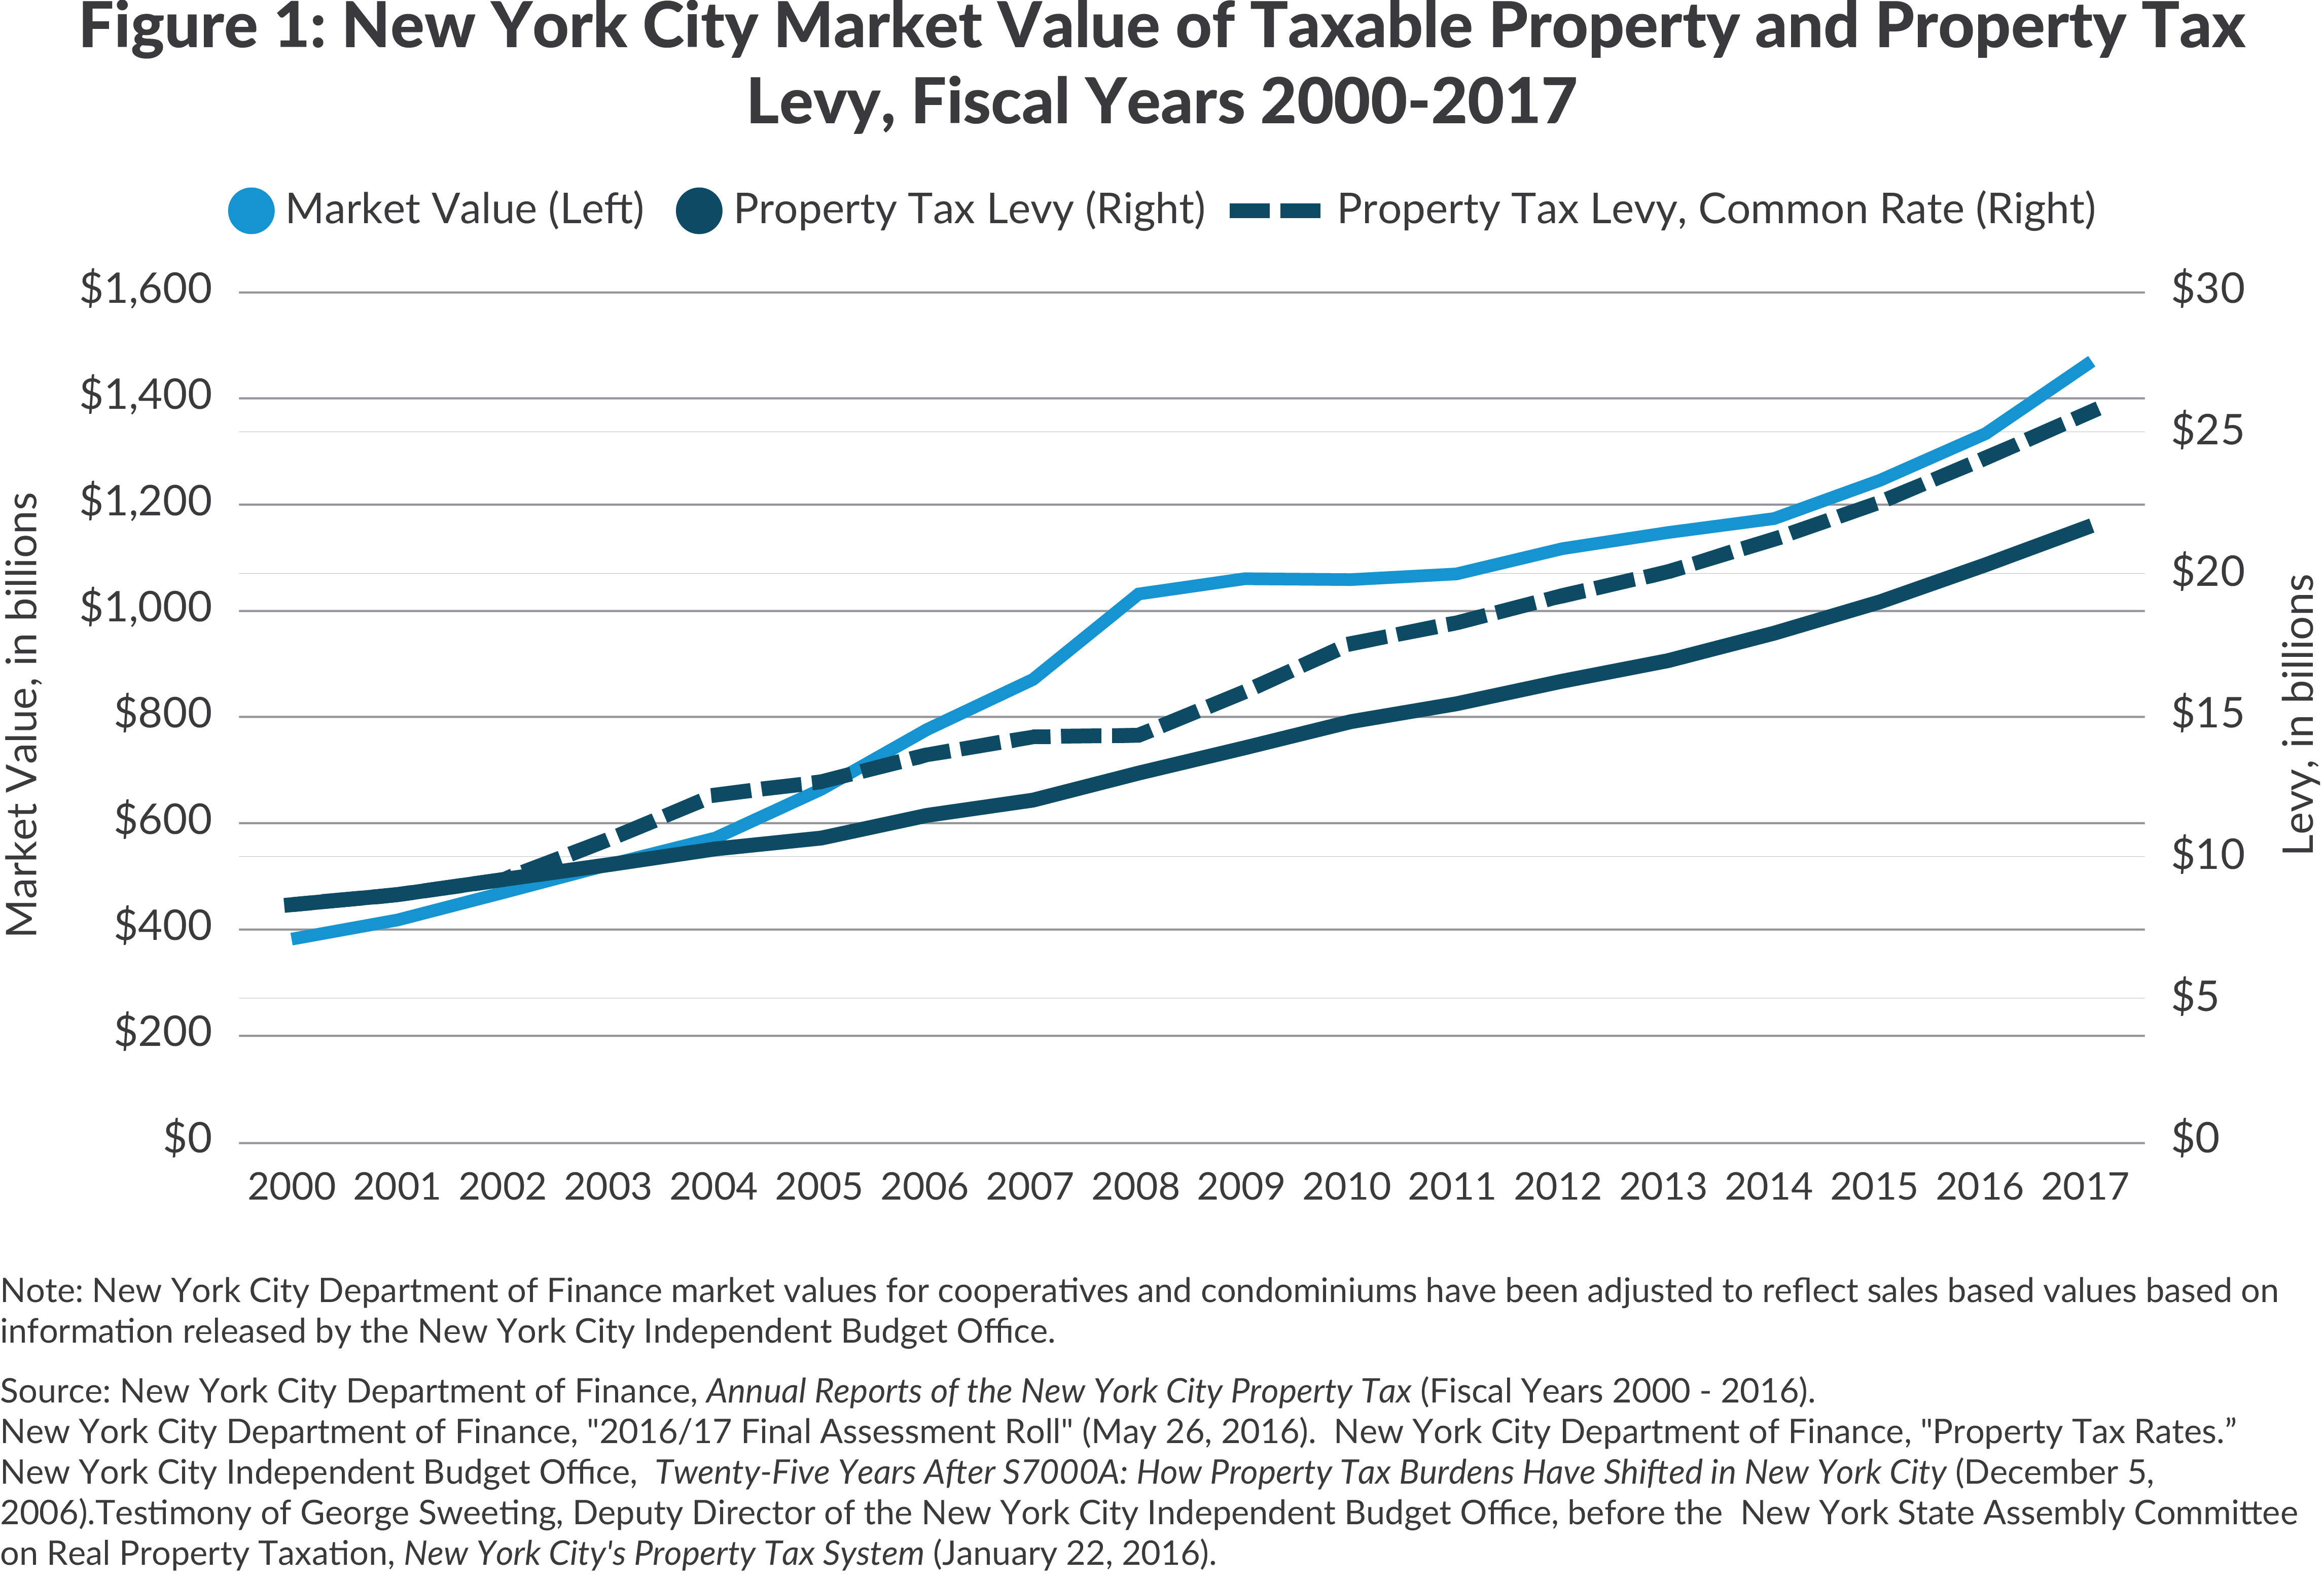
The scale of property tax revenue is related to the large and growing value of real estate in New York City. From fiscal years 2000 to 2017 the value of property more than tripled from $382 billion to $1.47 trillion.1 (See Figure 1.) The pace of growth was uneven: the Great Recession of 2008-2009 separated periods of rapid and moderate growth. From fiscal years 2000 to 2009 growth averaged 12 percent annually; since fiscal year 2011 the average annual increase has been 5.4 percent. Market value growth is due primarily to appreciation of existing real estate, but includes significant new construction and renovation.
Strong market value growth has translated into robust revenue growth. From fiscal years 2000 to 2017 the tax levy tripled from $8.4 billion to $25.8 billion.2 This is partly due to a significant rate increase following the economic downturn in 2001 and 2002, but even after adjustment for this rate change the annual growth averages 5.8 percent. Of the $17.4 billion growth in revenue between fiscal years 2000 and 2017 only about $4.0 billion or 23 percent is attributable to the rate increase; the remainder reflects the rise in property values.
In the context of this vibrant growth in values and revenues, New Yorkers should understand three important features of the New York City property tax:
- Tax bills go up, even when the tax rate does not.
- Effective tax rates (taxes as a percent of market value) vary among types of property with home owners paying much lower rates than owners of commercial and residential rental property; and, these differentials are far greater than in other cities.
- Within each of the major types of property, the effective tax rate paid by owners varies widely in an often inequitable manner.
Tax bills go up even when the tax rate does not
Since the 1990s, changes in the overall property tax rate have been infrequent.3 The City enacted an 18.5 percent rate increase effective January 1, 2003; a rate reduction for fiscal year 2008 was repealed the following year, and the rate has been the same since then. Despite the stable tax rate, taxpayers’ bills have continued to increase because property values have grown.
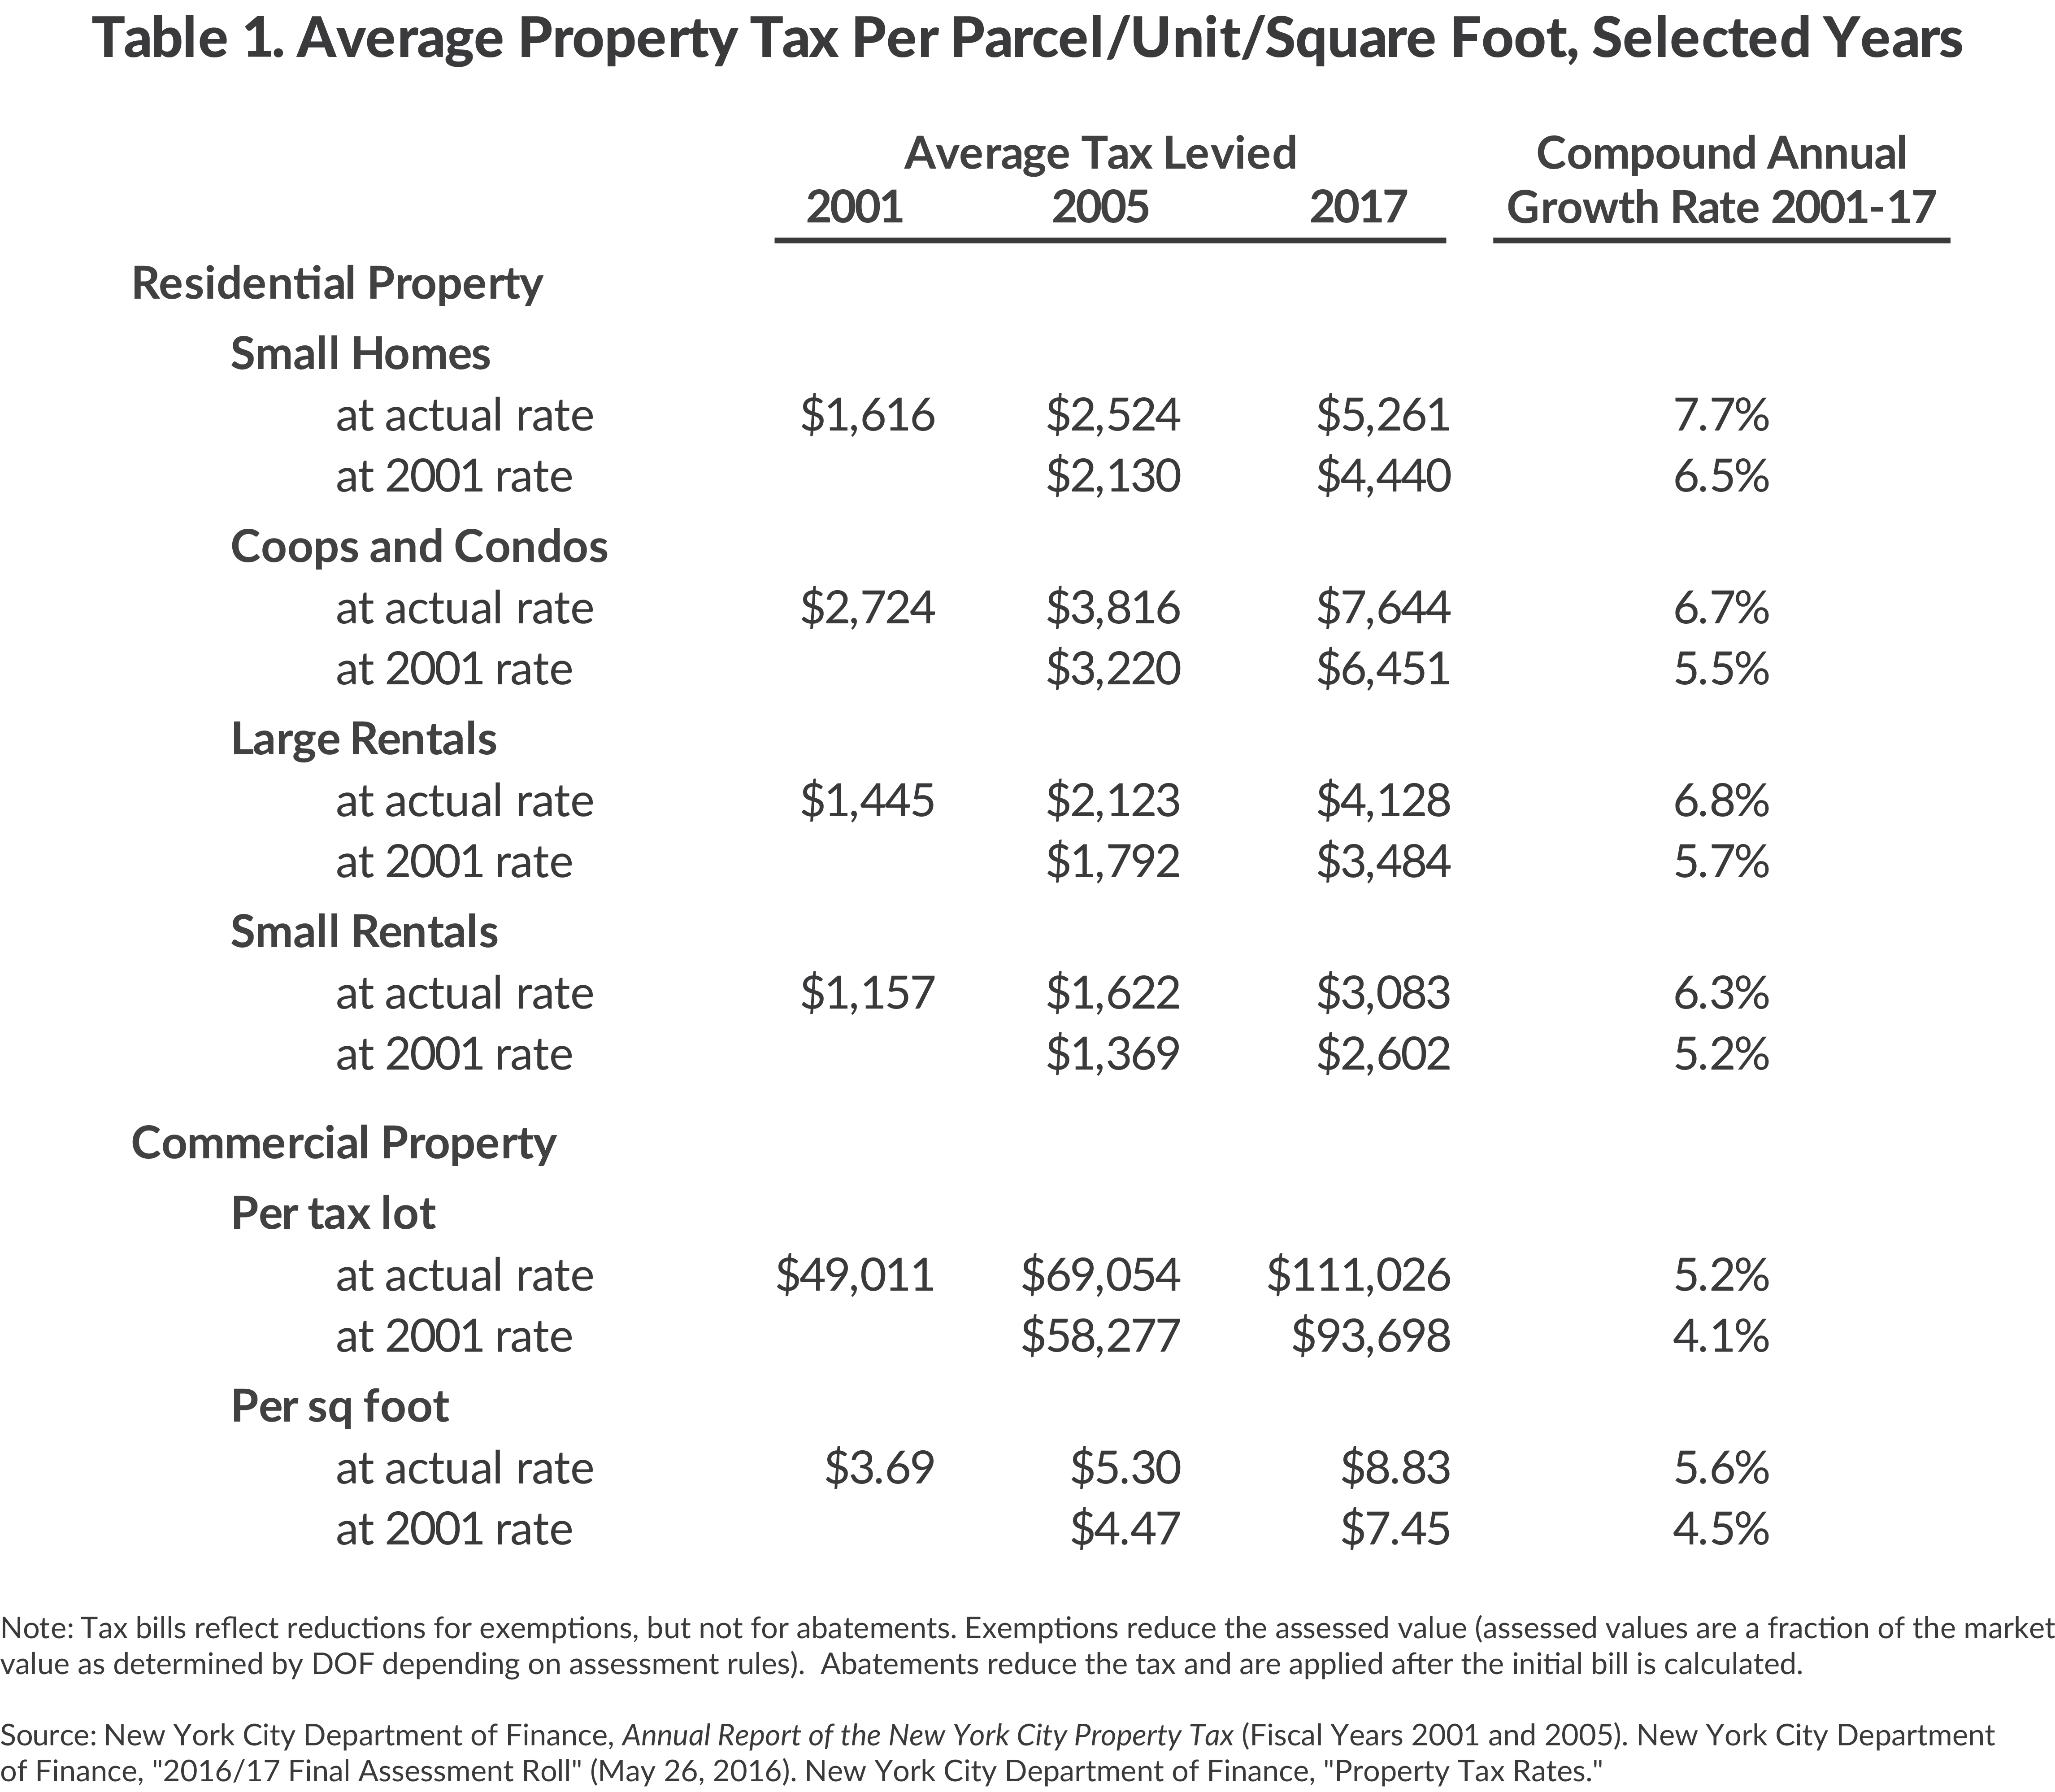
Table 1 indicates the average tax bill for commercial property and for four types of residential property in fiscal years 2001, 2005, and 2017.4 In fiscal years 2005 and 2017, the bill is shown in two ways: the actual amount under the rate increase and an amount adjusted to eliminate the effect of the rate increase.
For commercial property the average bill is shown per parcel (typically a building) and per square foot, which takes into account changes in the average size of buildings. From 2001 to 2017 the average bill per commercial parcel grew from just above $49,000 to more than $111,000, or 5.2 percent annually; adjusting for the rate change, the average annual increase was 4.1 percent. Per square foot, the adjusted bill more than doubled from $3.69 to $7.45 from 2001 to 2017.
New York City’s residential properties can be divided into four types, each of which is subject to different tax rules: (1) small homes for one, two, or three families; (2) cooperatives and condominiums (coops and condos); (3) small rental buildings with four to ten units; and (4) large rental buildings with at least 11 units. After adjusting for the rate increase, the average annual increase in tax bills was higher for small homes (6.5 percent) and large rentals (5.7 percent) and slower for coops and condos (5.5 percent) and small rental buildings (5.2 percent). The current average tax bill per unit is $4,128 for large rental buildings and $3,083 for smaller rental buildings.
Effective tax rates vary among types of property
New York City has different tax rates for different types of property. The best measure of tax liability is the effective tax rate (ETR); it relates the tax bill to the market value of the property. This differs from nominal or statutory tax rates that are not comparable across types of property due to differences in assessment and other tax rules and practices. Figure 2 presents the average ETR by property type in fiscal year 2017. In addition to the residential and commercial properties discussed above, the figure includes property owned by utilities such as Consolidated Edison and Verizon. These utility properties are subject to the highest ETR, 4.8 percent; however, utility properties account for a small share of market value and tax levy (about 2 percent and 6 percent, respectively). These companies’ relatively high taxes are passed on to customers in their utility bills.
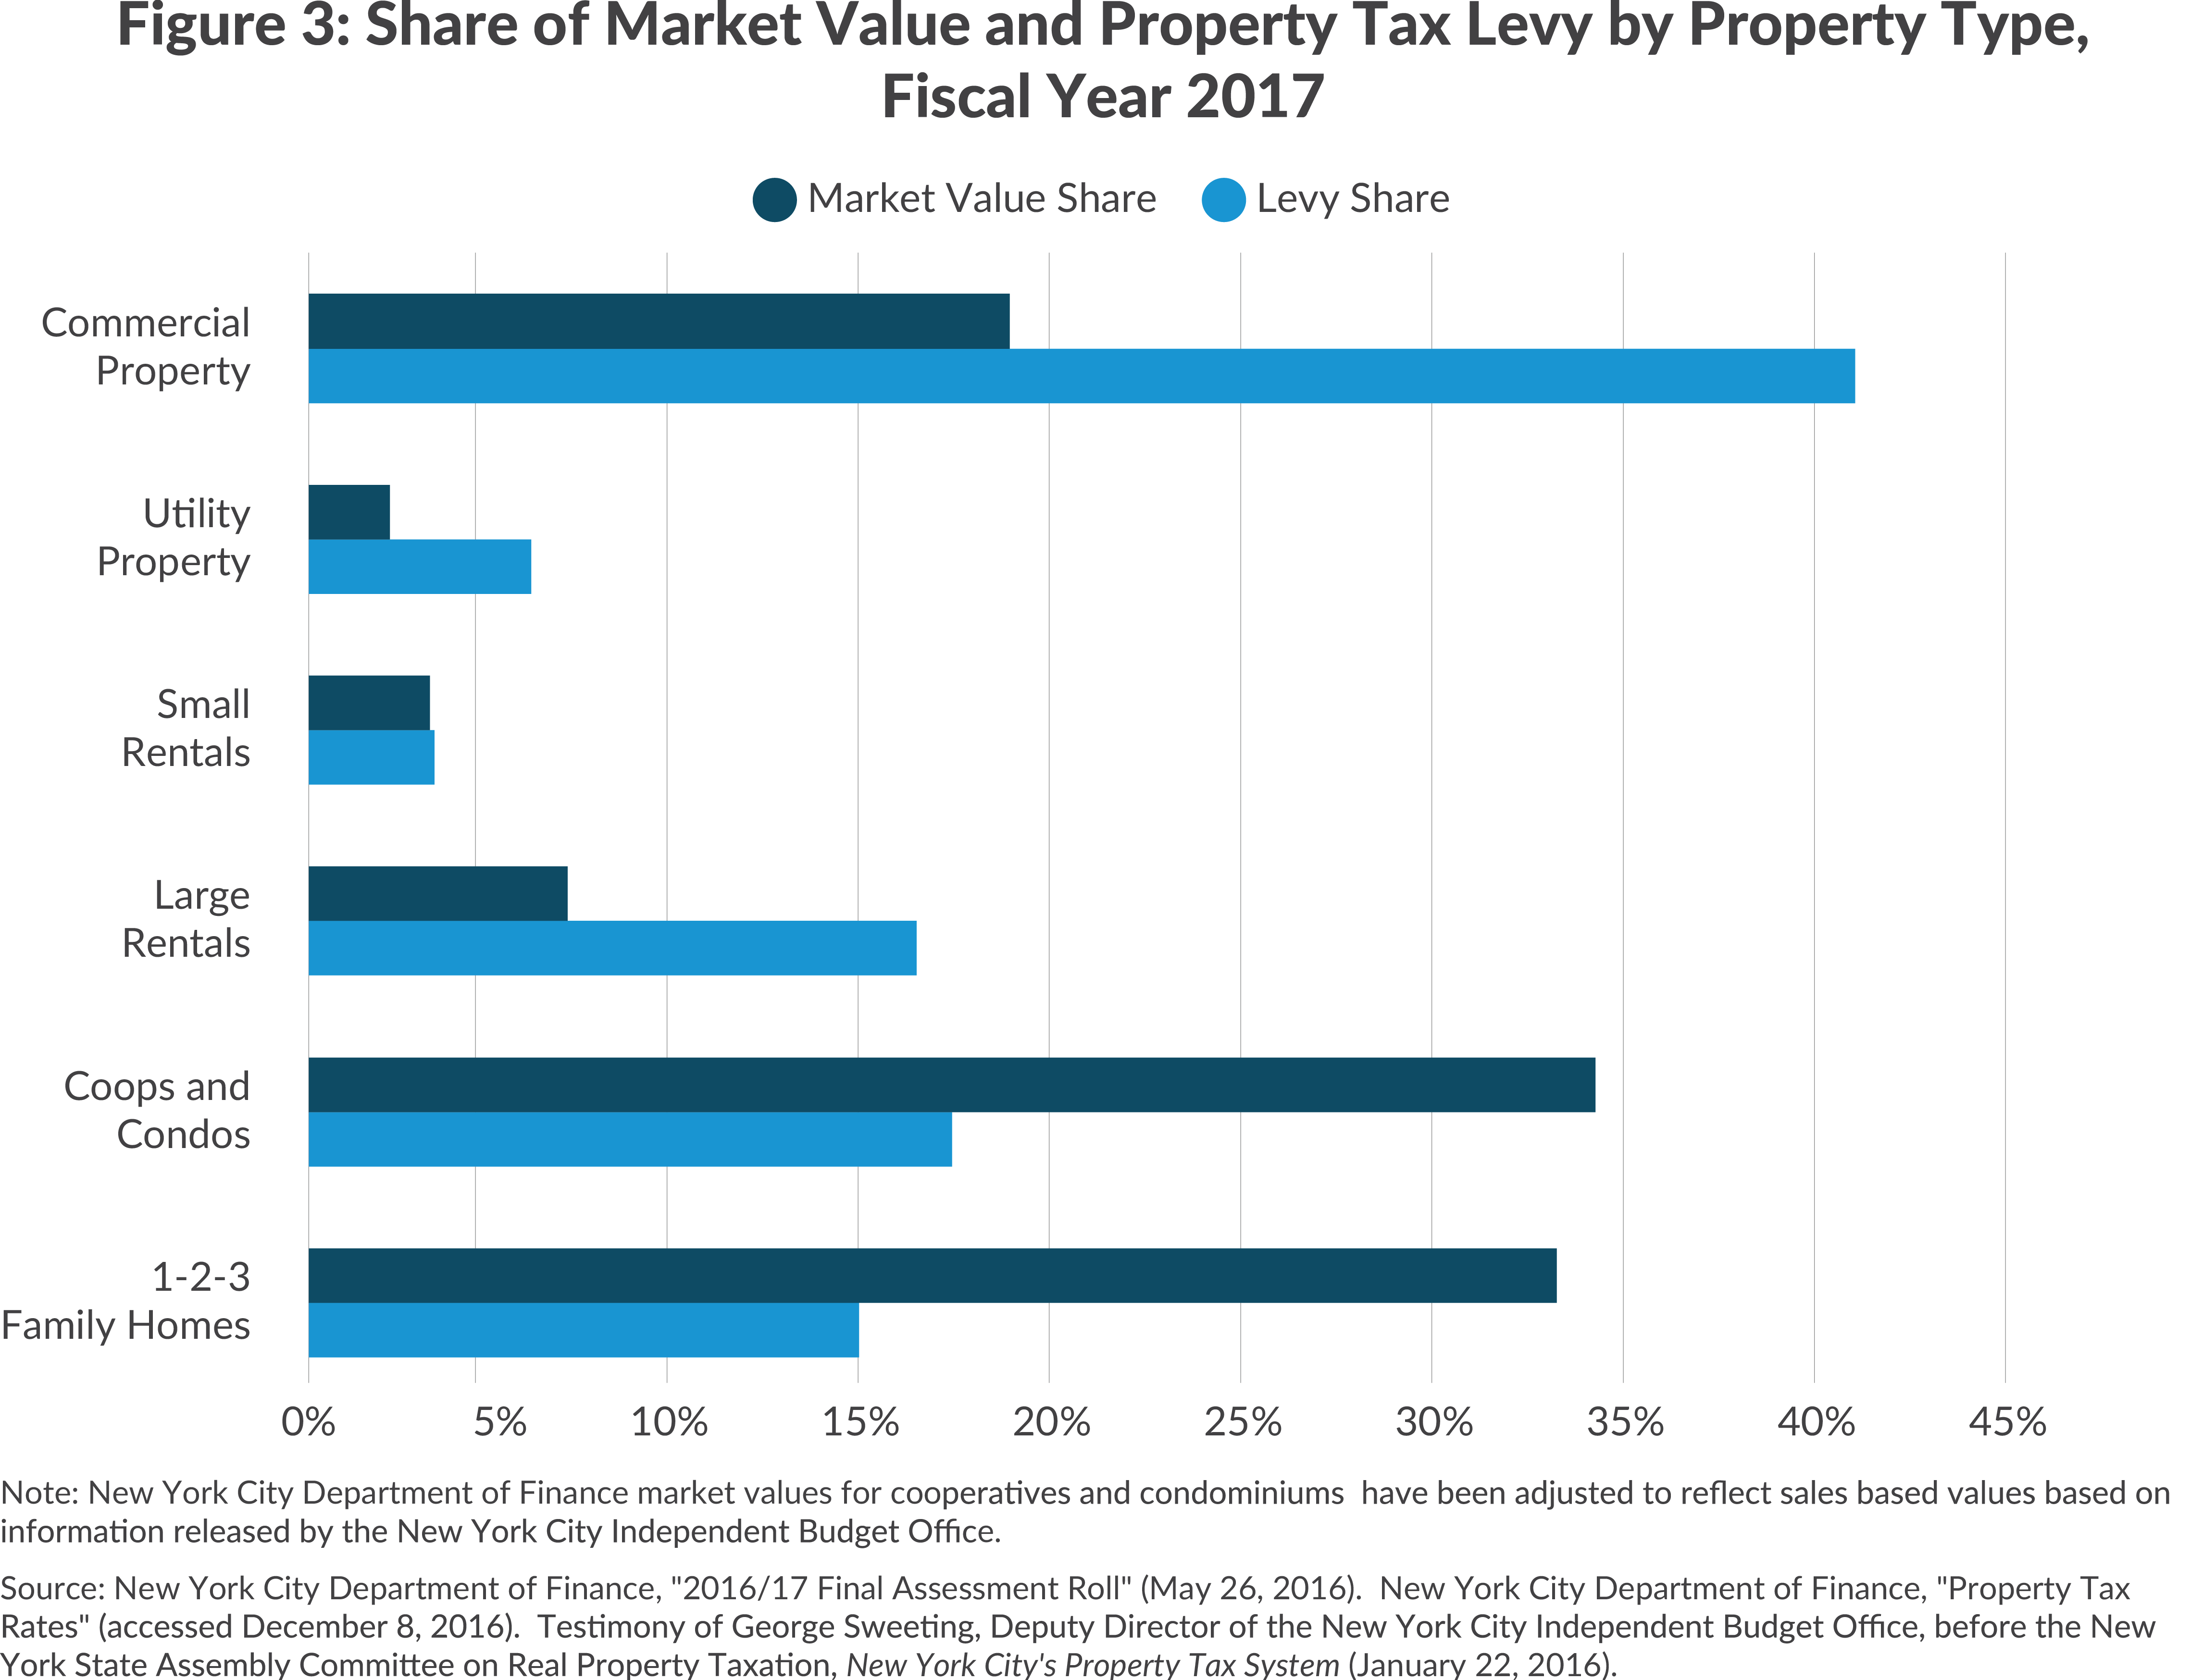
Commercial property is also subject to a relatively high average ETR, 3.87 percent; as a result, commercial properties account for fully 42 percent of the property tax levy, despite comprising less than 20 percent of total market value in fiscal year 2017. (See Figure 3.)
Small homes and coops and condos are subject to the lowest ETRs, 0.74 percent and 0.86 percent respectively.5 Although these properties represent a combined 69 percent of total market value, they are responsible for only 32 percent of the total tax levy.
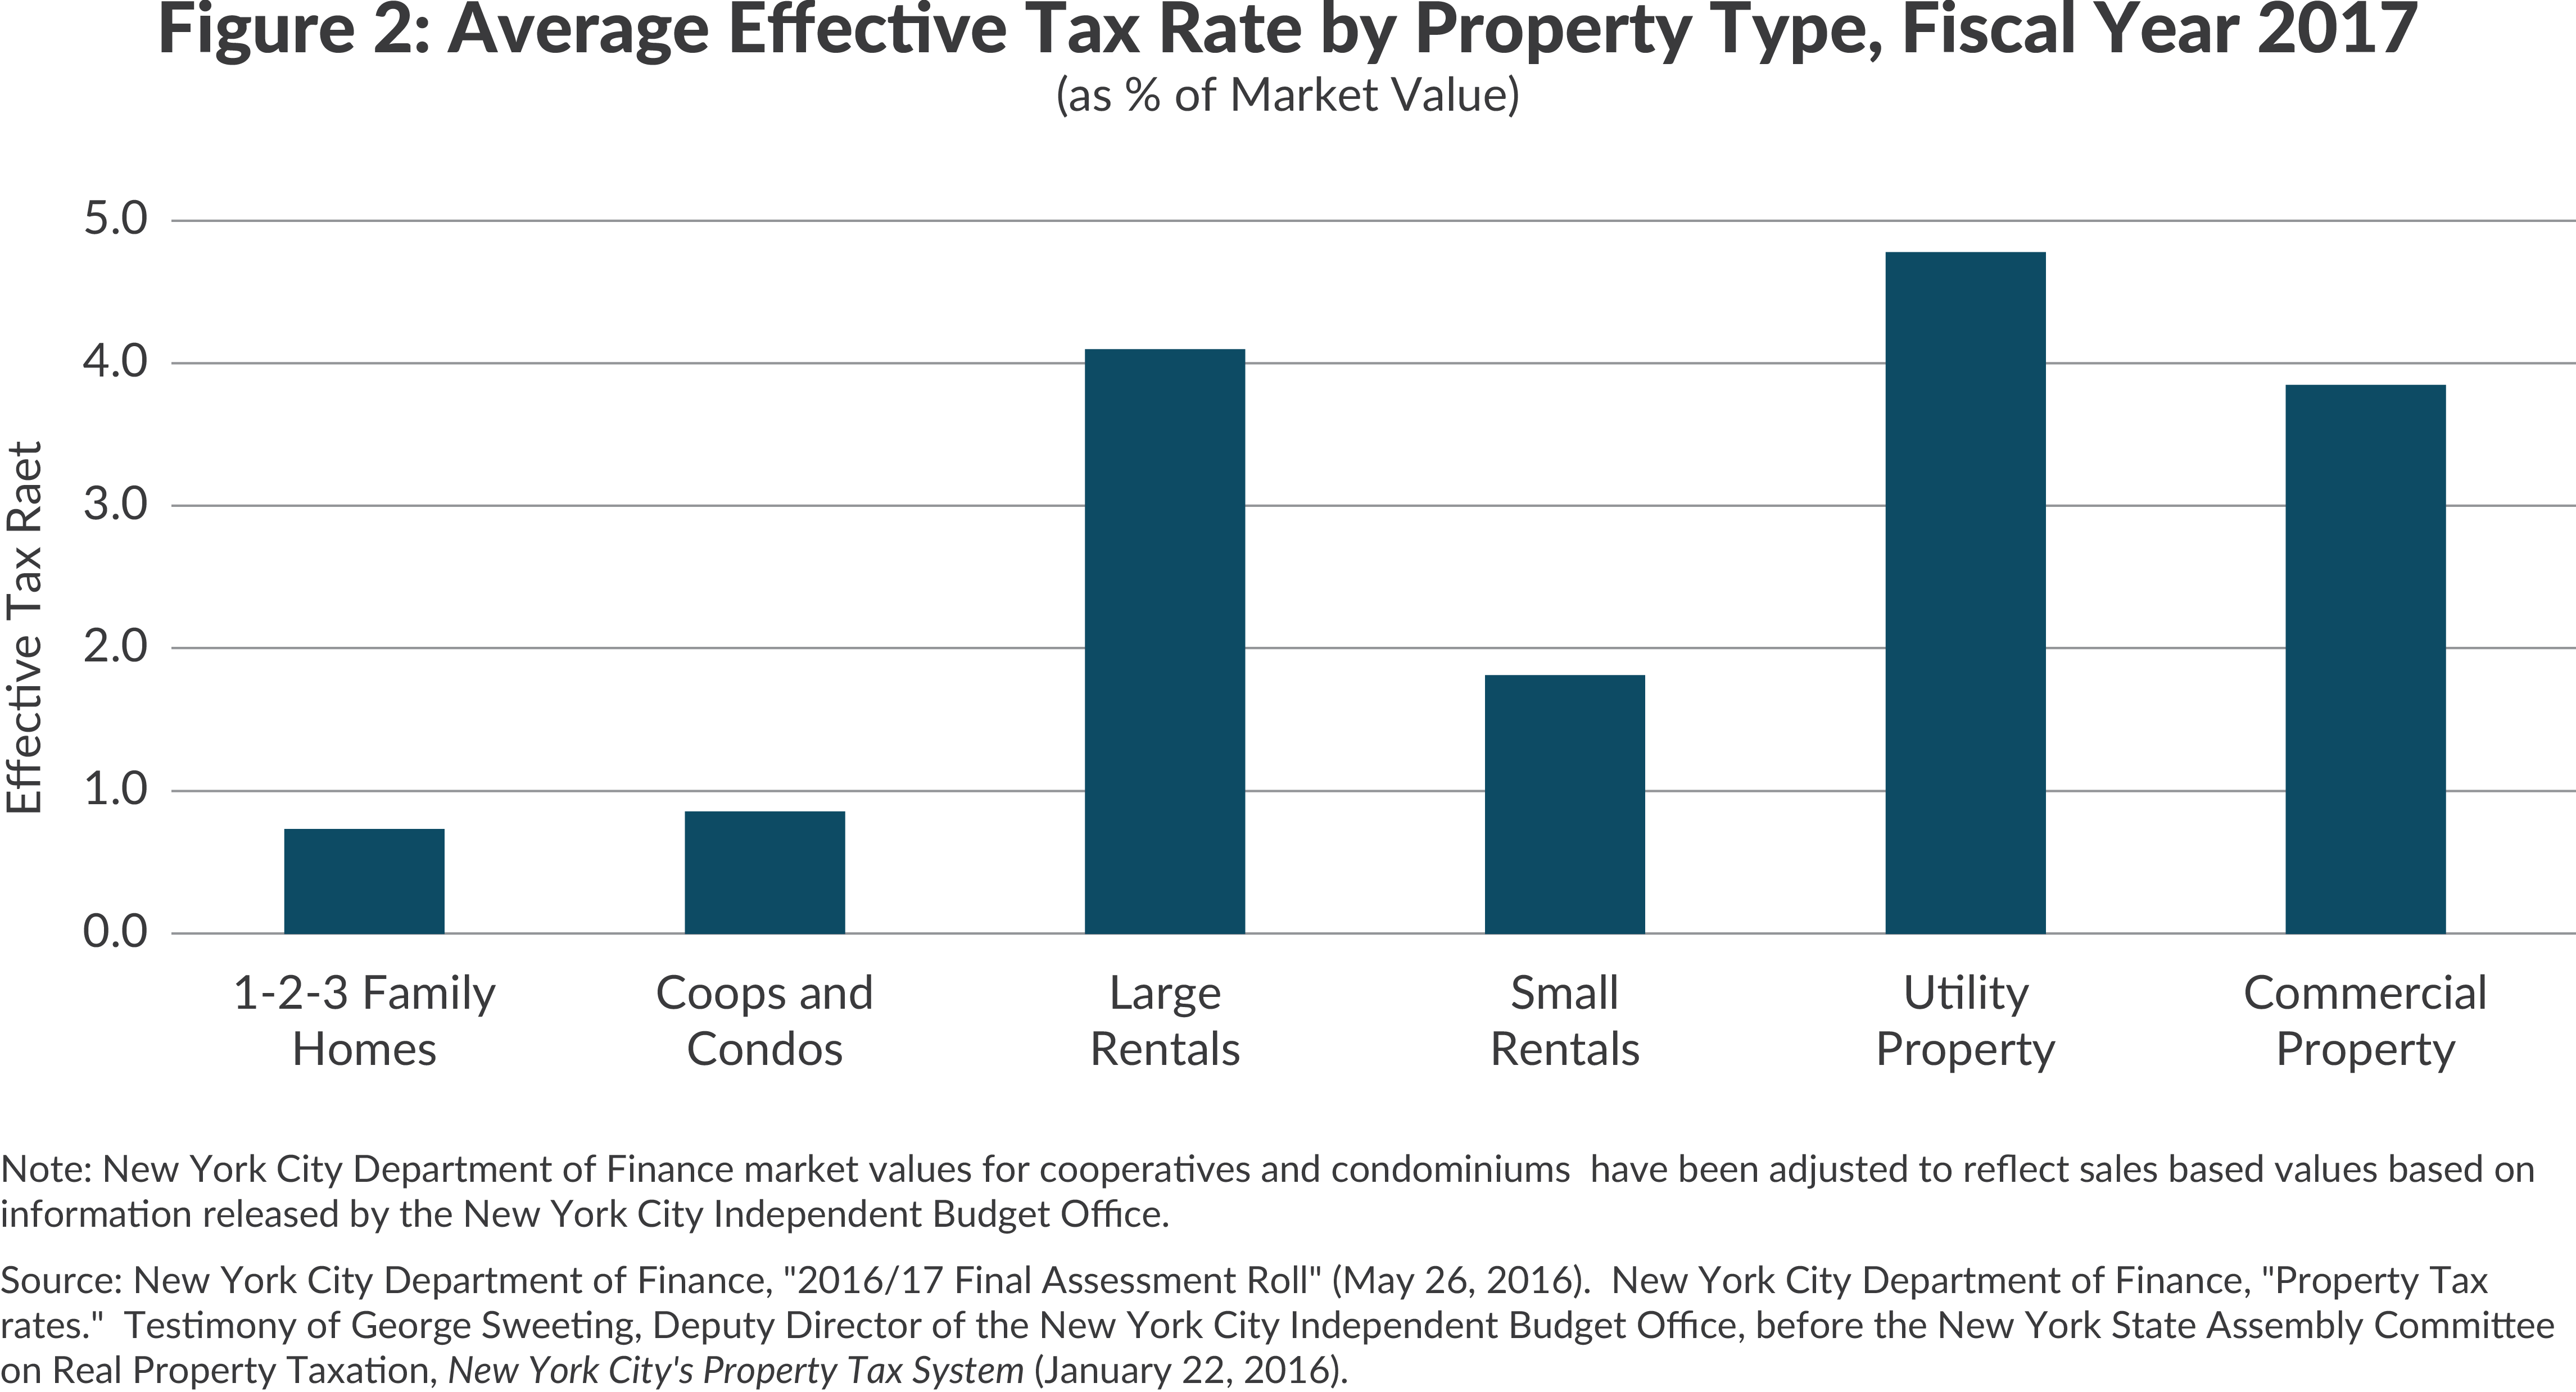
Rental properties have higher ETRs. Small rental properties have an average ETR of 1.83 percent, more than double that of small homes, coops, and condos, but still well below commercial properties. About one-fifth of the city’s private rental housing stock is in these smaller buildings, and they account for about 3 percent of total market value and 3 percent of the tax levy.6
Large rental properties have an average ETR of 4.12 percent, more than five times that of small homes. The large rental buildings comprise about 7 percent of total market value, but due to the high ETR account for 17 percent of the tax levy. Among regulated rental buildings in New York City, property taxes account for an estimated 27 percent of operating costs and are reflected in the rents charged tenants.7
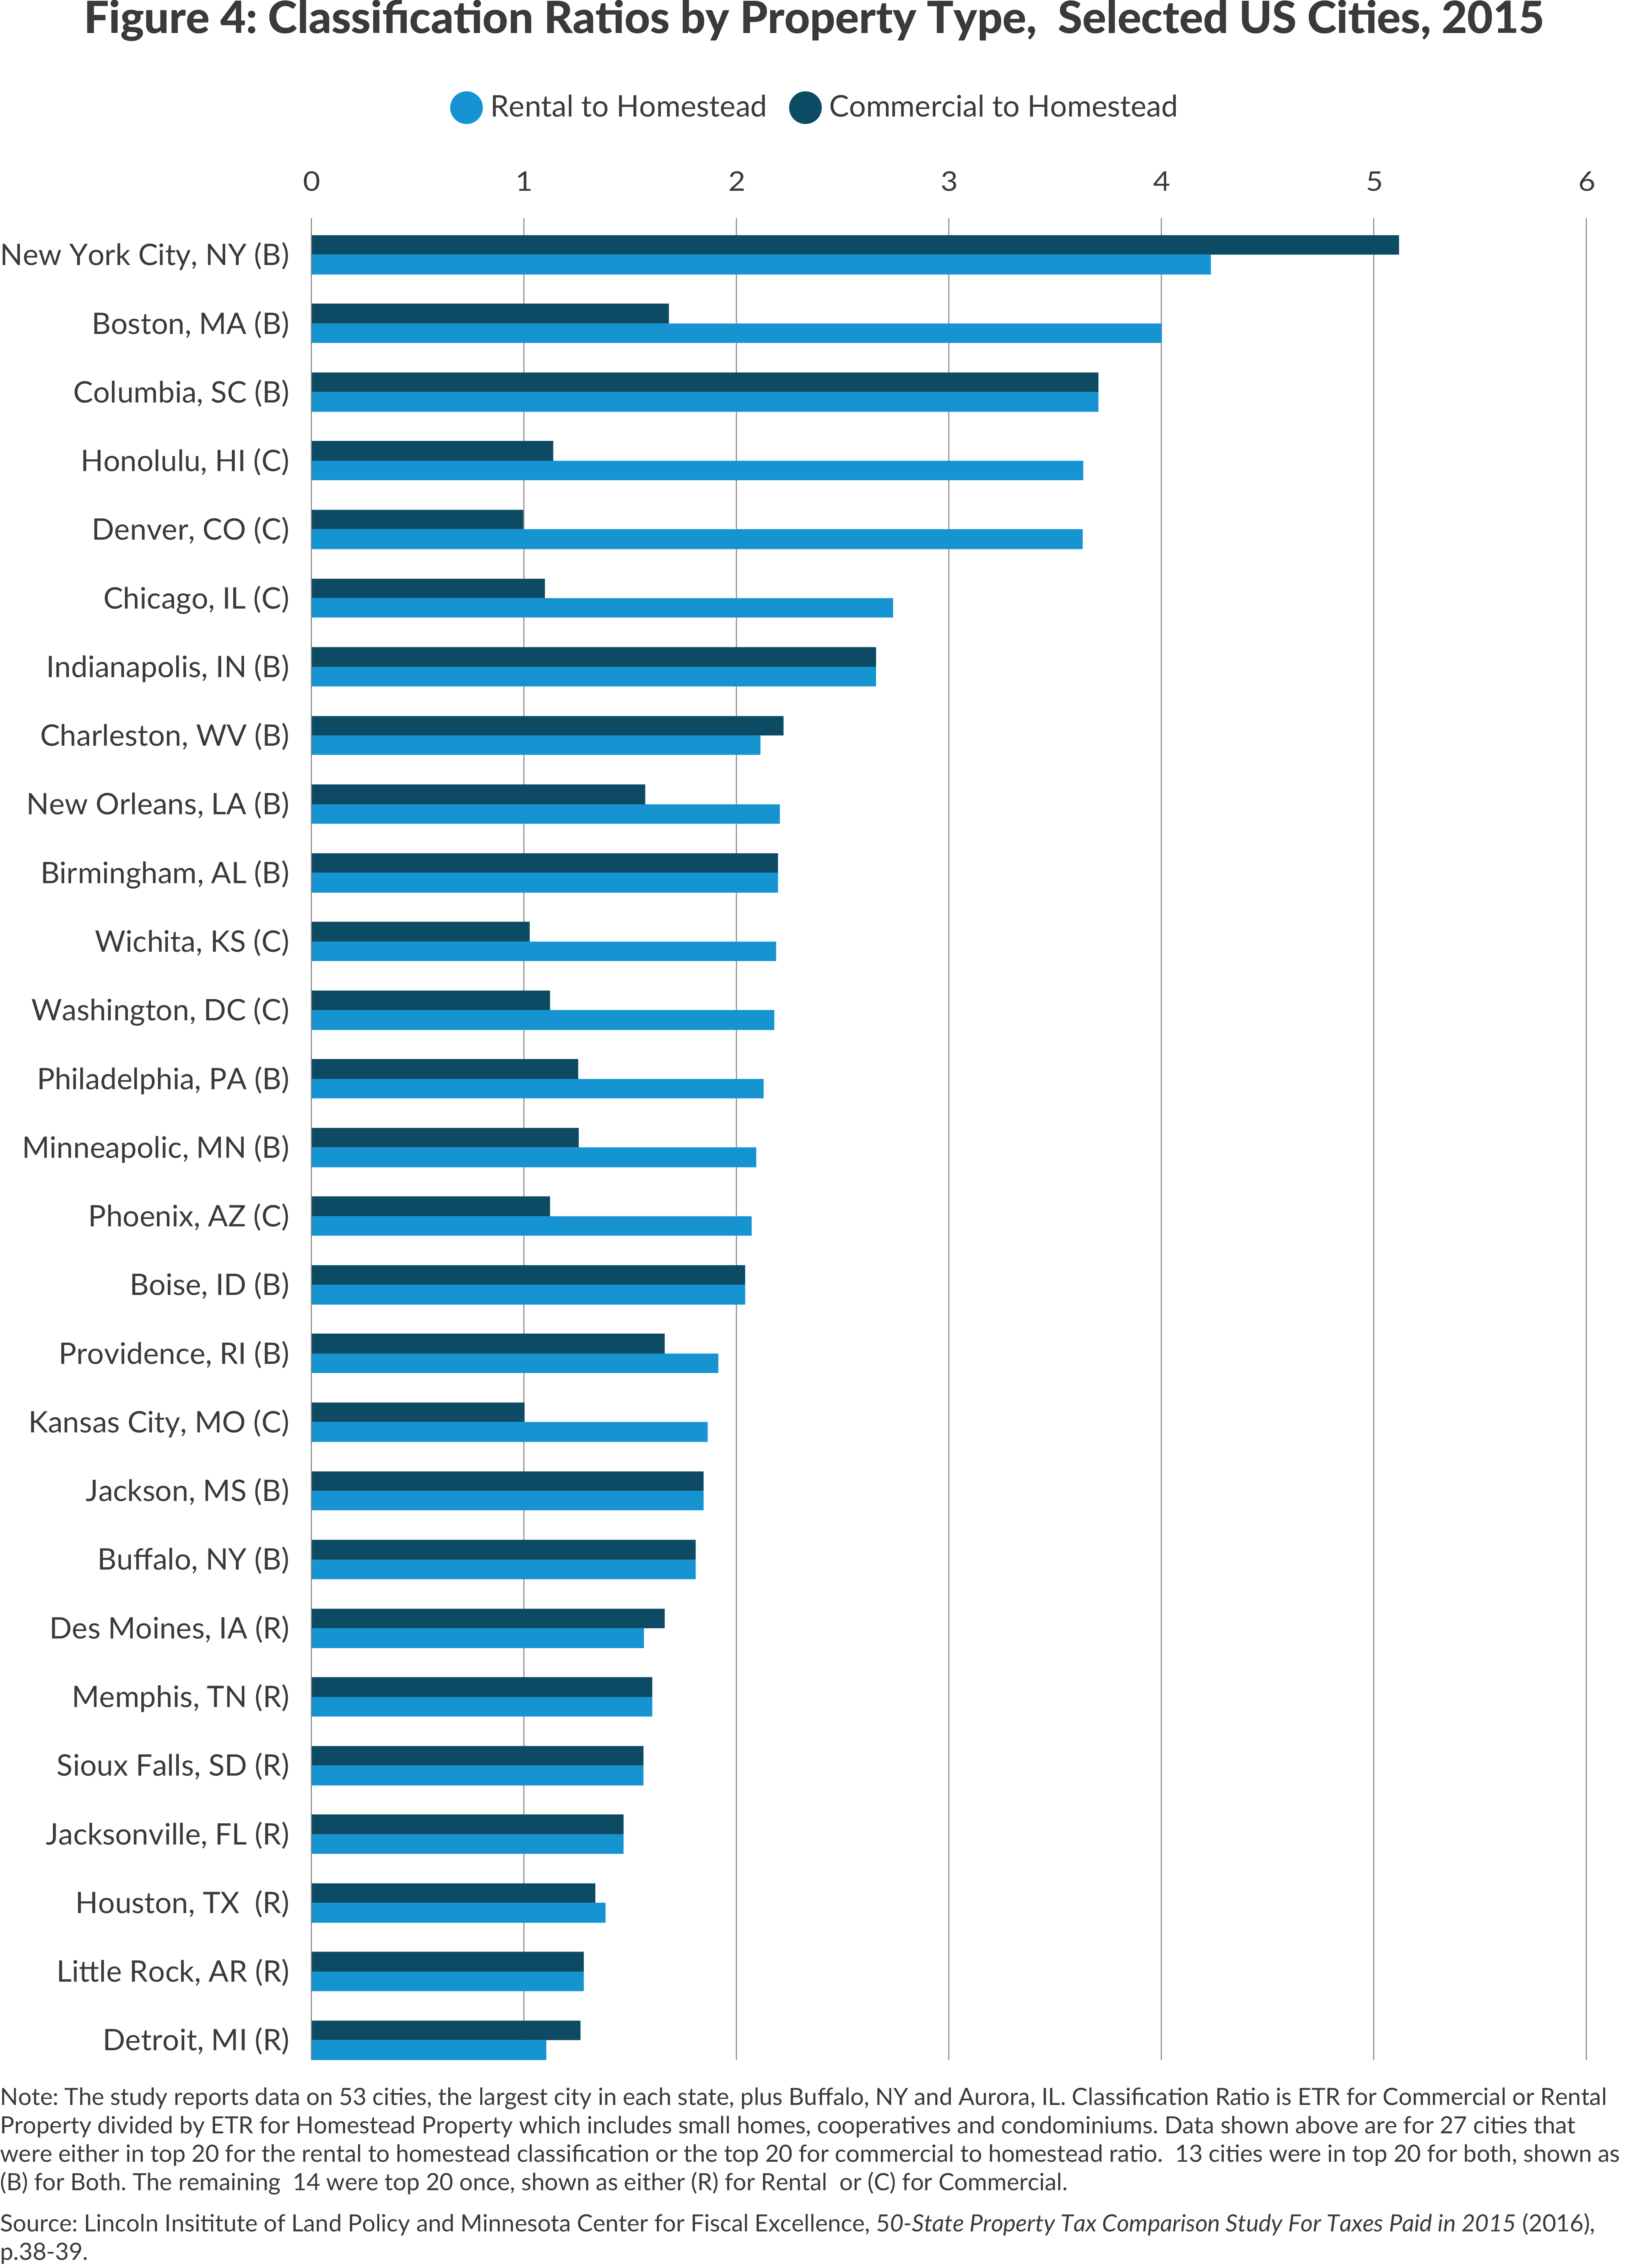
New York City is not unusual in having different ETRs for different types of property, but comparative data available for 53 large cities reveals it is unusual in the magnitude of these differences.8 Figure 4 presents two ratios for the cities with the 20 highest ETR disparities between small homes, coops, and condos, referred to as “homestead properties,” and (1) residential rental buildings and (2) commercial properties. For example, a ratio of 2 means rental (or commercial) properties pay an ETR twice that of homestead properties.
With respect to residential rental properties, none of the cities come close to New York in the disparity: New York’s ratio of 5.1 is well above that for second place Columbia, South Carolina (3.7). Only four other cities have a ratio of 2.0 or more. Among all 53 cities, 15 have a rental ratio at or below 1.0, indicating no preferential treatment for homestead over rental properties.
For commercial properties, New York also has the highest ratio among all cities at 4.2, but a few others come close. Among all 53 cities, four have classification ratios between 3.0 and 4.0 and 11 have classification ratios between 2.0 and 3.0. The four cities closest to New York are Boston (4.0), Columbia, South Carolina (3.7), Honolulu (3.6) and Denver (3.6).
The tax rate paid by owners varies widely within each of the major property types
Perhaps more concerning to taxpayers than discrepancies in rates between different property types is the wide disparities in ETRs among similar properties. Properties of the same type and valued at the same amount often pay very different tax bills. These disparities exist among all property types.
Among small homes the median ETR is 0.87 percent and ranges from a low of almost zero to a maximum of 1.2 percent, with about 5 percent of homes at the maximum rate. A single-family home worth $500,000, for example, could see a tax bill anywhere from less than $100 to $6,000.
For condos and coops, the median ETR is 1.02 percent, which would mean a tax bill of $9,180 for a $900,000 unit.9 At the higher end of the distribution 5 percent of all units pay ETRs above 1.21 percent or $10,890 in taxes for a $900,000 apartment. As with small homes, some coops and condos have an ETR close to 0 percent that leads to a very low tax bill.
About 1.3 million rental units are in buildings that pay property taxes (public housing and some other affordable housing is fully exempt and not included in this analysis). Of those, about 300,000 units are in buildings with 10 or fewer units, while the rest are in larger buildings. Smaller rentals tend to have lower ETRs, with a median of 1.78 percent, going up to 5.8 percent. For a unit valued at $125,000, the median tax bill would be $2,225. The highest bill a unit of this value would see is $7,250, more than three times the median. Larger buildings have a substantially higher median ETR of 4.82 percent.10 For a unit valued at $125,000 in such a building this would mean a tax bill of $6,025, with some bills as high as $7,250.11
Commercial property includes a variety of buildings, from stores to office buildings to warehouses to parking garages and hotels. The median ETR for these properties is 4.17 percent. At that rate a commercial building valued at $5 million would have a tax bill of $208,500. At the higher end of the distribution the ETR reaches a maximum 4.8 percent and a relatively large number of properties cluster there. The tax bill on a $5 million building at the highest rate would be $240,000, about 15 percent above the median. At the lower end of the distribution the range is far wider with a cluster of properties having ETRs at or near zero; their tax bills would be minimal.
These disparities generally have two causes: (1) tax law provisions intended to limit annual growth in tax bills; and (2) exemption programs that reduce tax bills for eligible properties.
To see how wide the disparity is in effective tax rates by type of property, click here.
Tax Law
The city estimates the market value of each property and calculates tax liabilities based on an assessed value that is a fraction of the market value. There are different assessment rules for each type of property. The growth in assessed value is constrained through caps or phase-ins.
For small homes and apartments in small buildings, the growth rate for assessed value from one year to the next or over five years is capped.12 While this gives owners protection against rapidly rising bills, its less explicit consequence is to lower the ETR for homes in neighborhoods with rising property values and keep it high for homes in areas with stable or declining values. If market values are growing at a faster rate than the 5-year cap, the properties’ ETRs will decrease over time.
Larger apartment buildings and commercial properties do not have caps on assessed value growth, but the change in value in a given year is phased in over five years in equal parts.13 Typically, the impact over multiple years is more modest than that of a cap, but it does contribute to inequities among buildings. As with caps, these provisions have the secondary consequence of imposing higher ETRs on units in neighborhoods with stable or declining values while lowering notably the ETRs on units in neighborhoods where values are rising, with the most dramatic favorable impact on those benefiting the most from property appreciation.
Exemption Programs
Much of the variation in ETR among properties of the same type stems from an array of exemption programs that have specific eligibility criteria and set benefit levels. Individual, or “personal,” exemptions provide tax reductions for residential owner-occupied properties based on the income, residency, disability, and/or age of the owner. Housing and economic development exemptions are granted to buildings to spur economic activity and construction (or renovation). Residential buildings receiving housing development exemptions can be renter or owner-occupied.
The city granted more than 520,000 individual exemptions in 2016; a unit can benefit from more than one program.14 The School Tax Relief Program (STAR) is the most common personal exemption; it reduces property tax by $300 for eligible homeowners, while enhanced STAR (for seniors with income below $86,000) reduces taxes by $600. There are also exemption programs for senior citizen and disabled homeowners with incomes below $37,400 that can reduce the assessed value by up to 50 percent, as well as exemptions for veterans.15
Exemptions for housing and economic development are fewer in number, but are more costly as they provide more generous tax reductions (more than $3 billion in 2016, compared to $350 million for personal exemptions) and generally provide benefits for 10 to 25 years.16 Three programs– for new construction of housing (421-a), housing renovation (J-51), and commercial development (Industrial and Commercial Incentive Program or ICIP)– represented over 100,000 of the 120,000 housing and economic development exemptions in 2016. Condos and rentals with very low ETRs are often new construction receiving 421-a exemptions, while coops and rentals that underwent renovation can receive significant tax reductions from J-51. In 2016, about 15 percent of rental buildings received a partial exemption, in contrast to less than 7 percent of commercial properties receiving exemptions under ICIP.
The City also administers abatement programs which are not reflected in the ETRs. The coop and condo abatement program, which can lower tax bills for qualifying units between 18 and 28 percent, is the largest at $429 million. Apartment buildings undertaking renovation can also receive a J-51 abatement (apart from the J-51 exemption). There were almost 96,000 abatements in 2016 that reduced property taxes by a cumulative $85 million. Some commercial properties are benefitting from the Industrial and Commercial Abatement Program, which replaced ICIP. In 2016, there were 442 abatements under this program, worth $28 million.17 Units and buildings receiving these benefits will have even lower property taxes than reflected in their ETRs.
Conclusion
The substantial variation in effective tax rates paid by different types of properties results from policy decisions of city and state elected officials: owners of small residential properties are sheltered from higher taxes at the expense of owners of commercial and large rental buildings. The scale of the differences in New York City is far greater than in other cities, making rental housing and commercial space more expensive and impeding the city’s economic competitiveness. In addition, policy decisions to shield certain types of owners from rapid increases in taxes due to appreciation in the value of their properties underlie the wide variations in ETRs among properties of the same type. Unfortunately these largely unintended consequences create significant inequities among otherwise similarly situated New York residential and businesses property owners.
Download Report
3 Things Owners and Renters Should Know About NYC Property TaxesFootnotes
- The market value of cooperatives (coops) and condominiums (condos) is adjusted from the figures published by the New York City Department of Finance (DOF) to reflect their widely agreed upon undervaluation due to provisions of State law. The New York City Independent Budget Office (IBO) estimates that in 2015 the DOF market value for coops was 23 percent of their sales-based value and for condos was 18 percent of the sales-based value. This analysis estimates market values by dividing DOF market value by 0.23 or 0.18 depending on the type of property. For example, at the average DOF market value of a coop unit of $145,000, the adjustment increases it to $630,435. For condos, the DOF average market value is $235,000, and the adjusted average market value is $1.3 million. One limitation of this approach is that is relies on citywide averages that mask extensive variation across the city; however, parcel level estimates were beyond the scope of this analysis. The IBO estimates are presented in Testimony of George Sweeting, Deputy Director of the New York City Independent Budget Office, before the New York State Assembly Committee on Real Property Taxation, New York City's Property Tax System (January 22, 2016), www.ibo.nyc.ny.us/iboreports/new_york_city_property_tax_system_testimony_january_2016.pdf. As these ratios have changed over time, historical data were adjusted using the above and data presented in New York City Independent Budget Office, Twenty-Five Years After S700A: How Property Tax Burdens Have Shifted in New York City (December 5, 2006), www.ibo.nyc.ny.us/iboreports/propertytax120506.pdf.
- The levy is the gross property tax, which is higher than the property tax revenue the city actually collects. The difference is due to abatements, delinquency and cancellations (reductions in tax liability) which reduce revenue, offset by collections for prior year balances. The property tax reserve is the estimate of these adjustments, and projected property tax revenue is equal to the levy minus the reserve.
- Each year, the City Council sets real property tax rates as part of the budget process. The Council determines the total levy necessary and each of four property classes pays a share. The formulas to calculate the class shares are codified in state law, with minimal local discretion, and are intended to keep shares relatively constant over time, with an annual adjustment for growth in market value and physical changes. The levy for each class is the overall levy times the class share. To determine the tax rate for each class, the class levy is divided by the assessed value for tax purposes in the class. In other words, the tax rate for each class is a product of the class share, assessed value for tax purposes, and total levy. The City Council is not able to raise or lower the tax rate for one class. The tax rate for each class may increase or decrease from year to year.
- Average tax bills reflect exemptions but not abatements. Exemptions reduce assessed value upon which the tax is based. Abatements are reductions in the tax that are applied after the initial bill is calculated.
- The ETR for coops and condos does not reflect a substantial statutory abatement available to these units; this abatement lowers the ETR to about 0.76 percent, a rate close to that for small homes.
- Based on residential unit counts of taxable parcels as reported by the New York City Department of Finance in the 2017 Assessment Roll. Fully exempt buildings, such as those operated by the New York City Housing Authority, are excluded. See: New York City Department of Finance, FY 2017 Final Assessment Roll. FY 17 Database Files by Tax Class: Tax Classes 2, 3 and 4 (May 2016), http://www1.nyc.gov/assets/finance/downloads/tar/tc234_17.zip.
- New York City Rent Guidelines Board, 2016 Income and Expense Study (April 7, 2016), p. 7, www.nycrgb.org/downloads/research/pdf_reports/ie16.pdf.
- Includes the two largest in New York and Illinois, the largest in each of the 48 other states, and the District of Columbia. See: Lincoln Institute of Land Policy and Minnesota Center for Fiscal Excellence, 50-State Property Tax Comparison Study For Taxes Paid in 2015 (2016), p. 38-39.
- Distribution of ETRs is weighted by the number of residential units. Data does not reflect an abatement available to owner-occupied coops and condos used as a primary residence. For units that qualify, the reduction is between 18 and 28 percent of the bill, with lower-valued units seeing a greater reduction. Of the 271,000 units benefiting from the abatement in 2016, 59 percent were coop units and 21 percent were condos. See: New York City Department of Finance, Annual Report of the New York City Property Tax, Fiscal Year 2016 (2016), pp. 2, 41, http://www1.nyc.gov/site/finance/taxes/property-reports/property-reports-annual-property-tax.page.
- Distribution of ETRs is weighted by the number of residential units.
- These per-unit bills are intended to be illustrative as rental buildings are valued and taxed as a building, not per unit.
- The cap for small homes is 6 percent a year or 20 percent over five years. For buildings with 4 to 10 units, it is 8 percent a year or 30 percent over 5 years. These caps are set in state real property tax law.
- This transitional assessed value reflecting the phase-in is compared to the actual assessed value (45 percent of market value). The building is taxed on whichever value is lower. In 2017, about 81 percent were taxed on their transitional assessment and 19 percent on their actual assessed value. New York City Department of Finance, FY 2017 Final Assessment Roll: FY 17 Database Files by Tax Class: Tax Classes 2, 3 and 4, http://www1.nyc.gov/assets/finance/downloads/tar/tc234_17.zip.
- New York City Department of Finance, Annual Report of the New York City Property Tax, Fiscal Year 2016 (2016), p.15.
- Under the Senior Citizens Homeowners’ Exemption (SCHE), assessed value is reduced by 50 percent for homeowners who are over 65 years of age or disabled with income below $29,000. Under the Disabled Homeowners Exemption (DHE), homeowners with income between $29,000 and $37,400 benefit from an exemption that gradually phases out from 50 percent to 5 percent.
- New York City Department of Finance, Annual Report of the New York City Property Tax, Fiscal Year 2016 (2016), p.15.
- New York City Department of Finance, Annual Report on Tax Expenditures, Fiscal Year 2016 (2016), pp. 10-11.