A Poorly Targeted State School Aid Proposal
Governor Andrew Cuomo’s proposed budget for fiscal year 2016-17 includes a 4.3 percent increase in total school aid from $23.2 billion in the current school year to $24.2 billion in school year 2016-17. On a fiscal year basis, the total school aid increase would be 3.0 percent from $23.3 billion to $24.0 billion in fiscal year 2016-17.
The Governor’s proposed growth in school aid would be close to the statutory growth cap agreed upon in 2011, which is based on lagged annual personal income growth, an indicator of affordability.1 However, if history is an accurate predictor, the Legislature is likely to boost school aid further during budget negotiations; for the past three years, the State has busted its statutory cap. Additionally, while New York State is already the top spender on K-12 public education in the nation, education advocates are calling to double the proposed $1 billion school aid increase.2
To see the proposed increase in school aid for each district, use CBC’s new interactive map.
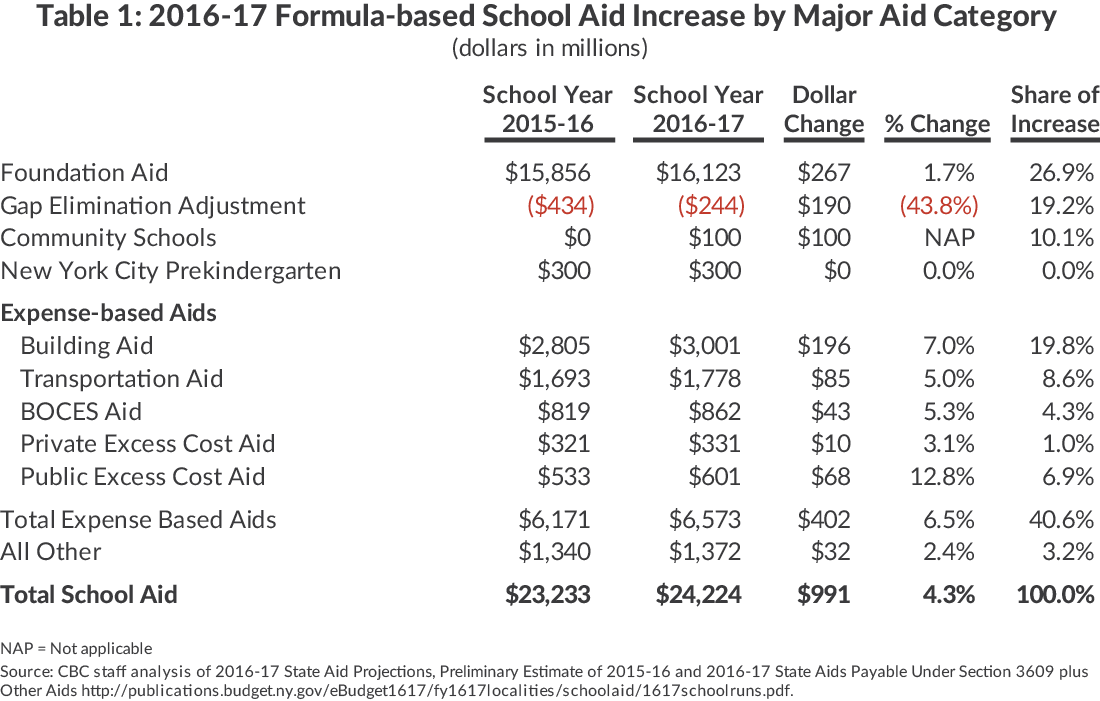
Table 1 summarizes how school aid will be distributed.Only 27 percent of the Governor’s proposed increase would be distributed through Foundation Aid, New York’s primary mechanism for addressing resource disparities among districts. About 20 percent of the $991 million school aid increase would be allocated through restorations to the Gap Elimination Adjustment (GEA), the mechanism used to apply progressive cuts in school year 2011-12. All districts would have their GEA restored by a minimum of 30 percent, with higher restorations for districts with high student need. More than $400 million of the increase would flow through expense-based reimbursement formulas, such as Building Aid and Transportation Aid, which favor wealthier, higher-spending districts. An additional $100 million in new Community Schools Aid would go to districts with “failing” or “persistently failing” schools and other high-need districts to provide social services through school buildings.
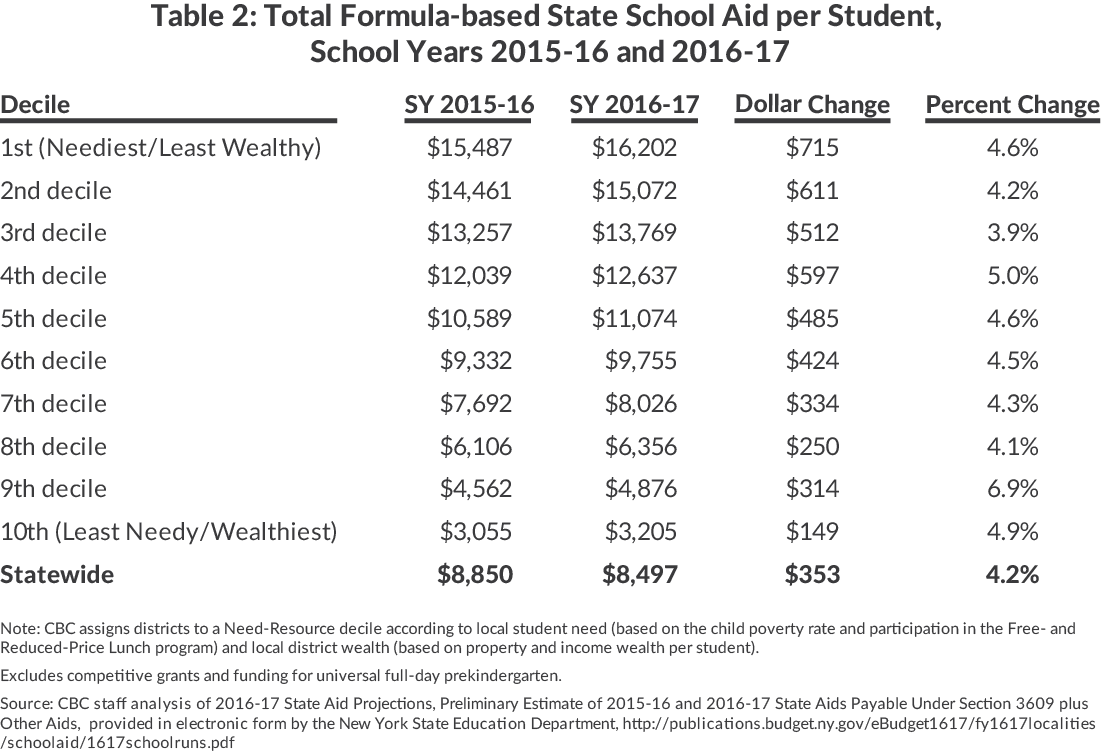
Overall, on a percent basis the proposed aid increases are relatively flat across districts of varying wealth and need. Higher increases for Foundation Aid for needier districts are balanced by GEA restorations and expense-based aid boosts for wealthier districts. On average the most affluent 10 percent of New York school districts would receive an aid increase of 4.9 percent per student, while the neediest 10 percent would get an average increase of 4.6 percent per student.3 Because wealthier districts receive smaller amounts of school aid from the State, the average increase would be $149 per student for the wealthiest 10percent and $715 per student for the poorest. Districts in the middle of the wealth and need spectrum would get average increases between $250 and $611 per student. (See Table 2.)
On the plus side, the Governor’s school aid proposal wisely stays close to the agreed upon, but not enforced, growth cap tied to personal income. However, too little weight is given to directing resources through Foundation Aid, the State’s best mechanism for targeting aid to the neediest districts. Additionally, the Governor did not address long-standing problems with the distribution of school aid, such as hold harmless provisions and generous reimbursements for school transportation and construction expenses that misdirect aid. These fundamental issues with the aid formulas, as well as redirecting resources through Foundation Aid, should be addressed in the coming budget negotiations.
Footnotes
- Under the Governor’s proposal, school aid would exceed allowable growth by $78 million, a relatively modest amount.
- Tammy Gamerman and Haley Zernich, “Fringe Benefits Push New York Education Spending Higher in School Year 2013,” Citizens Budget Commission Blog (June 23, 2015).
- CBC grouped New York’s 674 districts into deciles based on a Need-Resource Index. The index ranks districts according to local student need (based on the child poverty rate and participation in the Free- and Reduced-Price Lunch program) and local district wealth (based on property and income wealth per student). The 1st decile is the neediest/least wealthy and the 10th decile is the least needy/wealthiest.