State School Aid Increases: Anything But Progressive
The New York State Enacted Budget for Fiscal Year 2017 increases annual school aid 6.1 percent, from $22.9 billion to $24.3 billion. For the fourth consecutive year the Governor and the Legislature exceeded the statutory growth cap they agreed upon in 2011. Under the cap, based on personal income growth, school aid would have increased $900 million; instead it will grow $1.4 billion.1 This large infusion of resources, which further solidifies the State’s position as the nation’s top spender on public education, is not targeted to the neediest districts and maintains disparities in spending per pupil.
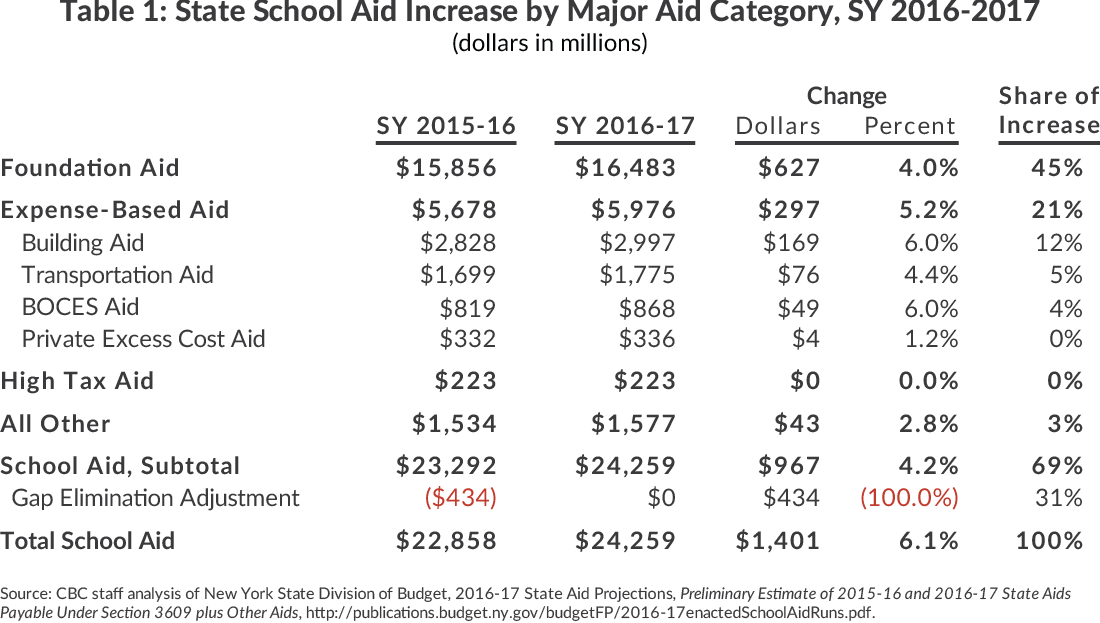
CBC’s interactive map shows the increase in school aid for each school district. The map’s shading indicates the percentage change in total aid per pupil between school years 2015-16 and 2016-17. Less than half of the $1.4 billion increase will be distributed through Foundation Aid, which is allocated based on district resources and needs and is the primary mechanism for addressing disparities among districts. The remaining increases steer additional funding to wealthier school districts. The second largest increase, $434 million, is the elimination of the Gap Elimination Adjustment (GEA), progressive cuts applied in school year 2010-11.2 Another one-fifth of the increase flows through expense-based reimbursement formulas such as building aid and transportation aid, which also favor wealthier districts. High tax aid, a fixed amount that tends to benefit certain wealthy districts, remained constant.
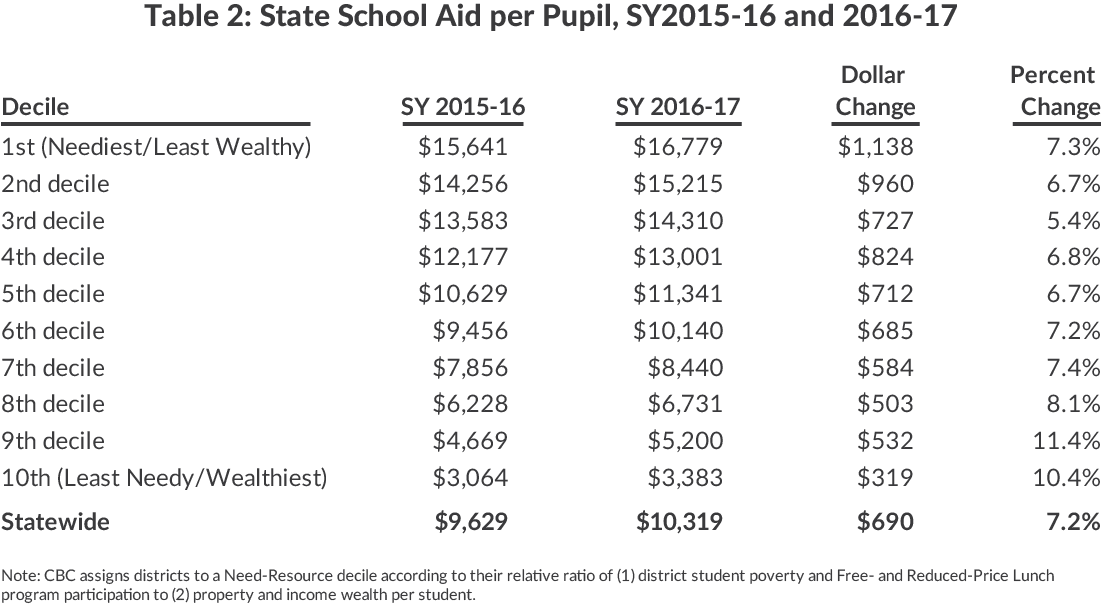
The result of allocating so much aid outside the Foundation Aid formula is that more affluent districts benefit proportionately more than the neediest districts. School aid per pupil increases 10.4 percent for the most affluent 10 percent of districts, but only 7.3 percent for the neediest districts.3 The statewide average increase is $690 per student or 7.2 percent. (See Table 2).
Aside from differences over the size of aid increases, the debate among elected leaders on school aid this year focused on, but ultimately did not change, the property tax cap and its implications for school district revenues. The leaders did not address long-standing problems with the distribution of school aid, such as hold harmless provisions and reimbursements for spending that misdirect aid. These issues should be addressed in the coming year.
Footnotes
- In addition to the $1.4 billion increase in formula-based aid, the enacted budget includes a total of $175 million for community schools as well as an increase in support for charter schools of approximately $430 per student.
- The GEA was an adjustment that decreased total state aid to school districts after other aid categories were allocated as per their respective formulas.
- CBC grouped New York’s 674 districts into deciles based on a Need-Resource Index. The index ranks districts according to local student need (based on the child poverty rate and participation in the Free- and Reduced-Price Lunch program) and local district wealth (based on property and income wealth per student). The 1st decile is the neediest/least wealthy and the 10th decile is the least needy/wealthiest.