Design-Build Contracting
A Way to Fix More Bridges for Less Money
In a city stretched across an archipelago and interlaced with complex roads and rail lines, safe bridges are vital parts of public infrastructure: more than 16 million vehicles and thousands of pedestrians cross New York City’s 789 bridges daily.1 Maintaining, rehabilitating, and occasionally replacing these bridges requires substantial and consistent investment. Since 2006, New York City has committed $4.6 billion to its bridges and plans to spend $7.7 billion more over the next 10 years.2 To complete these projects in a cost-effective manner, New York City officials have requested from New York State statutory authority to use “design-build,” a method of contracting for construction projects that has demonstrated positive results in New York and other states. State legislators should enable New York City to benefit from this approach: if it realized savings on par with the State’s experience, the City could save $2 billion over 10 years.
The Challenge: Fixing Old Infrastructure that is Heavily Used
Since a low point in 1980s when major bridges had to be closed, the City has been steadily funding capital improvements in bridges so that, as of 2014, it no longer has any bridge rated “poor.”3 Nevertheless, the City’s bridges are old, heavily used, and require constant upkeep. The median age for a City-owned bridge is 80 years, nearly twice the national median of 42, and City bridges have nearly three times more vehicle traffic than elsewhere in the nation.4 Wear and tear have led to 82 City-owned bridges being classified as structurally deficient, meaning they have a significant defect that requires monitoring.5 Twenty-four bridges, including the Queensboro, Williamsburg, and Brooklyn, operate under partial weight restrictions that constrain the flow of traffic.6 Another 494 functionally obsolete bridges are safe, but do not meet modern design standards and may require investments to accommodate current traffic demand or improve traffic flow.7
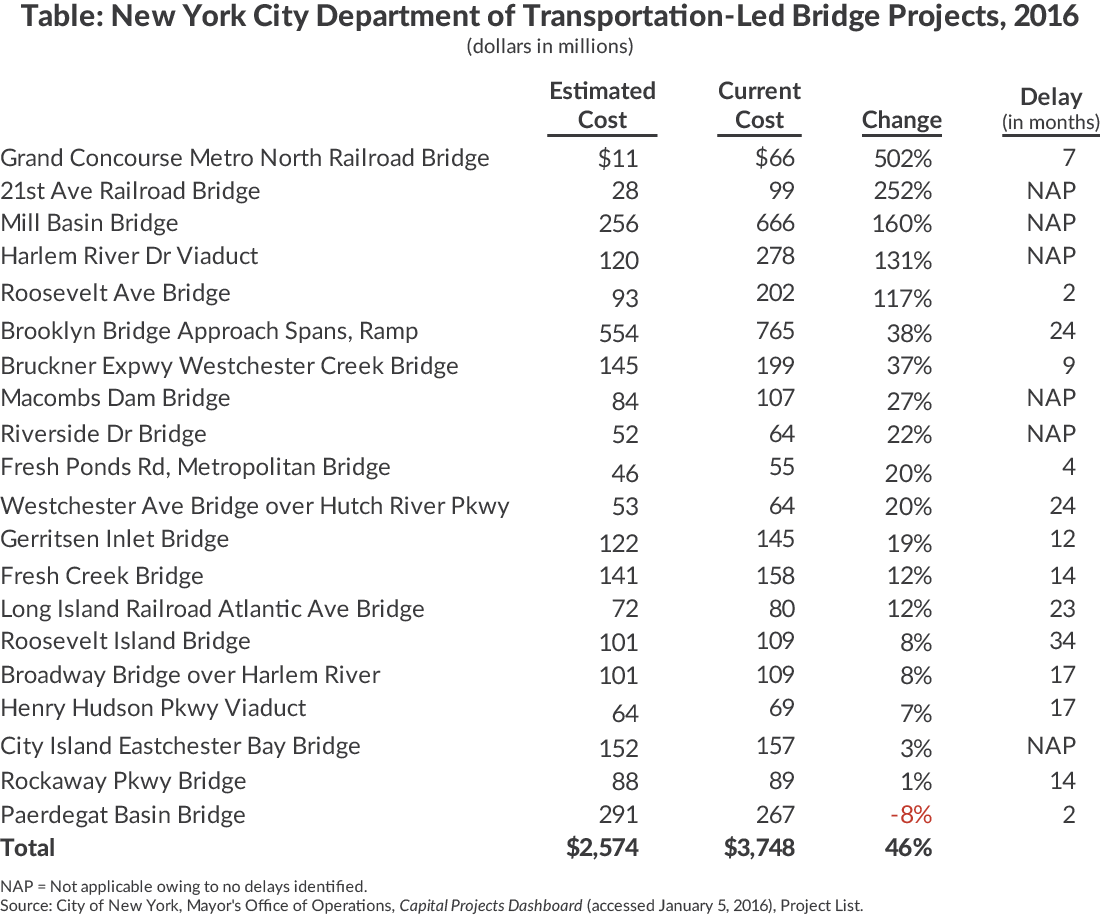
The New York City Department of Transportation (NYCDOT) is addressing the challenge, but its project delivery has been troubled. Table 1 lists the $3.8 billion in bridge projects NYCDOT is currently undertaking. Of the 20 projects, 14 are experiencing delays, ranging from two months to nearly three years, and all but 1 have suffered cost increases. The majority of projects experienced cost increases greater than 10 percent of the original estimate. Overall, the projects are 45 percent over budget.8
The available information indicates most New York City bridge projects encounter unforeseen field conditions or require a change to the project and, by extension, project design. Changes made after a project has been approved require a “change order” to authorize the alteration to design, work plan, or cost. Change orders almost always increase costs and extend project timelines: design change orders increased the cost of NYCDOT contracts by 20 percent in fiscal year 2015; processing time for the change orders averaged 40 days.9
How Other Places – and New York State – Are Doing Better
Delays and cost overruns are all too common for public sector infrastructure projects. Facing these challenges, some states have turned to design-build and other more integrative procurement strategies. Design-build eschews the traditional “design-bid-build” process of separate, sequential contracts for each phase of the project. Instead, responsibility for design and construction are bundled together in a single contract, often awarded on the basis of “best value” rather than lowest cost.10 Typically, a design-builder commits to a total cost specified in a contract, thereby assuming most of the risk associated with delays and cost overruns.11 Collaboration between design and construction teams avoids costly change orders in the middle of construction; construction work can begin before designs are completed, experience on the ground informs the final designs, and all parties can cooperate to offer innovative solutions to challenges as they arise—without waiting for bureaucratic approval.
The State legislation authorized design-build for certain State agencies and authorities in 2011, and the New York State Department of Transportation (NYSDOT) has used it for big projects, such as the first phase of the Kosciuszko Bridge replacement and the construction of the New NY Bridge, with positive results.12 It has also been part of a successful strategy to improve and rehabilitate smaller bridges statewide. The first phase of the Accelerated Bridge Program, launched in 2012, bundled bridges into design-build contracts by region and produced an estimated savings of 27 percent over design-bid-build processes.13
Other states have also relied on this bundled approach. In 2003 Oregon bundled its bridges into 11 design-build contracts worth $445 million. These contracts were completed ahead of an expected design-bid-build schedule, with a median acceleration of 15 months. Moreover, Oregon estimated savings of 8 percent by procuring these projects with design-build contracts.14 Missouri undertook a statewide bridge repair and replacement program that included a $487 million design-build contract to replace 554 bridges. This contract was completed in 2014, 14 months ahead of schedule and under budget.15 Pennsylvania has gone further, launching a statewide bridge program that includes not just design-build but also maintenance responsibilities for 25 years. Pennsylvania expects to save 20 percent over conventional procurement over the life of the contract.16
Conclusion
New York State’s authorization of design-build contracting in 2011 was limited and did not extend to local governments; New York City officials, including the Mayor, NYCDOT Commissioner, and Budget Director, have asked the Legislature to grant the City this authority.[17] The legislature should honor this request and include design-build authority for NYCDOT in the budget bills. The State’s experience indicates that NYCDOT can benefit significantly from design-build by completing a greater number of projects on time and on budget. With $7.7 billion in bridge work planned for fiscal years 2016 to 2025, realizing savings as great as NYSDOT’s Accelerated Bridge Program would save as much as $2 billion over 10 years.
Footnotes
- Bridges owned, operated and/or maintained by the New York City Department of Transportation. Of these 103 are open only to pedestrian traffic. Does not include five tunnels owned or operated by the New York City Department of Transportation and hundreds of other bridges owned by New York State, the Metropolitan Transportation Authority, the Port Authority of New York and New Jersey, and the New York State Thruway Authority.
- City of New York, Office of Management and Budget, September Capital Commitment Plan (annual editions 2009 to 2015), Volume 1, www.nyc.gov/html/omb/html/publications/publications.shtml; and City of New York, Office of Management and Budget, Ten-Year Capital Strategy, Fiscal Years 2016-2025 (May 2015), Department of Transportation – Bridges, p. 19, www.nyc.gov/html/omb/downloads/pdf/typ5_15.pdf.
- City of New York, Department of Transportation, 2014 NYC DOT Bridges & Tunnels Annual Condition Report: Bridge Report (2015), p. 1, www.nyc.gov/html/dot/downloads/pdf/dot_bridgereport14.pdf.
- Calculated by CBC staff based on average daily traffic per crossing on a subset of NYC-owned bridges from data available in U.S. Department of Transportation, Federal Highway Administration, Bridges and Structures, National Bridge Inventory (updated August 5, 2015), 2014 Data, www.fhwa.dot.gov/bridge/nbi/ascii.cfm.
- U.S. Department of Transportation, Federal Highway Administration, Bridges and Structures, National Bridge Inventory (updated February 2, 2016), 2015 Data, www.fhwa.dot.gov/bridge/nbi/ascii.cfm.
- City of New York, Department of Transportation, 2014 NYC DOT Bridges & Tunnels Annual Condition Report Bridge Report (2015), Appendix C-2, Bridges with Posted Weight Restrictions, p. 173, www.nyc.gov/html/dot/downloads/pdf/dot_bridgereport14.pdf.
- U.S. Department of Transportation, Federal Highway Administration, Bridges and Structures, National Bridge Inventory (updated February 2, 2016), 2015 Data, www.fhwa.dot.gov/bridge/nbi/ascii.cfm.
- City of New York, Mayor's Office of Operations, Capital Projects Dashboard (accessed January 5, 2016), Project List, www.nyc.gov/html/ops/capital/html/dashboard/project_list.shtml.
- City of New York, Mayor’s Office of Contract Services, Agency Procurement Indicators, Fiscal Year 2015 (2015), http://www1.nyc.gov/assets/mocs/downloads/pdf/IndicatorsReport/2015%20Agency%20Procurement%20Indicators.pdf.
- Best value contracts allow for the consideration of other important criteria besides cost, such as prior experience and performance.
- Maria Doulis, “Don’t Block Design Build,” Citizens Budget Commission Blog (March 16, 2015), www.cbcny.org/cbc-blogs/blogs/dont-block-design-build.
- The State saved an estimated $445 million and 3.5 years using design-build on the Kosciuszko Bridge, and the $3.9 billion cost of the New NY Bridge was $1.7 billion less than previous estimates of the project’s cost. Both remain on time and on budget. See: New York State Office of the Governor, “Governor Cuomo Announces Contractors for the $555 Million Kosciuszko Bridge Replacement” (press release, May 29, 2014), www.governor.ny.gov/news/governor-cuomo-announces-contractors-555-million-kosciuszko-bridge-replacement; and New NY Bridge, “New NY Bridge Project to Replace Tappan Zee Gets Final Contract Approval” (press release, January 18, 2013), www.newnybridge.com/news/2013/2013-01-18-contract-approval.html.
- New York State Department of Transportation, “Design/Build Project Delivery for Transportation Projects” (application for the Citizens Budget Commission Prize for Public Service Innovation, February 14, 2014).
- Estimated project lengths range between 42 months and 66 months. See: Oregon Department of Transportation, Office of Project Letting, “Projects” (accessed December 2, 2015), www.oregon.gov/ODOT/HWY/OPL/Pages/Projects.aspx.
- U.S. Department of Transportation, Federal Highway Administration, Innovative Program Delivery, “Missouri Safe and Sound Bridge Improvement Program” (accessed February 1, 2016), www.fhwa.dot.gov/ipd/project_profiles/mo_safe_and_sound.aspx.
- U.S. Department of Transportation, Federal Highway Administration, Innovative Project Delivery, “Project Profiles: Pennsylvania Rapid Bridge Replacement Program” (accessed December 2, 2015), www.fhwa.dot.gov/ipd/project_profiles/pa_rapid_bridge.aspx. Note these more recent experiences demonstrate savings greater than those found by a federal review of design-build projects completed under SEP-14 in 2005. That study, relying on results self-reported by project managers, found design-build savings averaged 3 percent relative to design-bid-build; however, 37 of 48 projects had no change in cost or savings. Bridge projects represented only 10 percent of the total value of these contracts. Road projects were the majority. See: SAIC, AECOM, and the University of Colorado, Design-Build Effectiveness Study – As Required by TEA-21 Section 1307 (f), Final Report (January 2006), Prepared for the U.S. Department of Transportation, Federal Highway Administration, www.fhwa.dot.gov/reports/designbuild/designbuild.pdf.
- NYCDOT Commissioner Polly Trottenberg testified NYCDOT could save up to $249 million on nine projects currently in the City’s plans if it were able to use design-build. See: Testimony of New York City Department of Transportation Commissioner Polly Trottenberg, City of New York, before Assembly Standing Committee on Cities, Infrastructure Needs Relating to Cities (February 11, 2016), http://nystateassembly.granicus.com/MediaPlayer.php?view_id=8&clip_id=3083; and Testimony of Mayor Bill de Blasio, City of New York, before Joint Legislative Hearing on the 2016-17 Executive Budget Proposal, Local Government Officials and General Government (January 26, 2016), www.nysenate.gov/calendar/public-hearings/january-26-2016/joint-legislative-public-hearing-2016-2017-executive-budget.