4 Things You Should Know About the MTA's Commuter Railroads
On an average weekday more than 603,000 riders travel across the New York City region on one of the Metropolitan Transportation Authority’s (MTA) two commuter railroads—the Long Island Rail Road (LIRR) and the Metro-North Railroad (Metro-North). Created separately as private railroads, the two have been incorporated into the MTA as part of the regional transit network; they now account for 28 percent of the MTA budget and are supported by taxpayers and the region's motorists.
Here are four things New Yorkers should know about the MTA’s commuter railroads:
The MTA operates two separate, but similar, commuter railroads
The LIRR was chartered in 1834 and went through several expansions and consolidations before it was purchased by the Pennsylvania Railroad in 1900. Ridership soared following completion of tunnels connecting Queens to the newly built Penn Station. However, the rise of the automobile resulted in a decline in ridership. This decline, coupled with regulated fare structures and rising costs, created financial difficulties that led to the LIRR filing for bankruptcy in 1949. A series of state tax concessions and subsidies kept the LIRR afloat until the State eventually purchased the railroad in 1966.
Metro-North is the result of the consolidation of several railroads and was ultimately part of the Penn Central merger in 1969.1 The trends in ridership, fare structure, and costs that hastened the LIRR’s financial collapse resulted in the Penn Central entering bankruptcy within two years of the merger. As with the LIRR, private commuter service continued for a short period with State subsidies. After the Penn Central bankruptcy, federally chartered Conrail provided commuter service under contract to the MTA. The MTA took over commuter service following the nationalization of the Penn Central in 1974, and by 1983 had created and assumed control of Metro-North.2
The LIRR has uniquely challenging characteristics that have a significant impact on operations. First, 10 of 11 LIRR lines converge at its Jamaica station, and many trains must switch across multiple tracks to pass through the station before continuing on to one of the LIRR’s three western terminals—Atlantic Terminal, Long Island City, and Penn Station. Even when operating efficiently, trains must execute these switches slowly; minor issues at the platform or on the track produce cascading delays down multiple train lines.3 Second, while Metro-North has sole control of Grand Central Terminal and its 43 tracks, the LIRR is a tenant at Penn Station, allocated only 9 tracks during peak periods. This restriction at Penn Station requires tightly choreographed train movements in order to make room for subsequent trains and often results in crews moving empty trains to yards on the west side of Manhattan and in Queens.
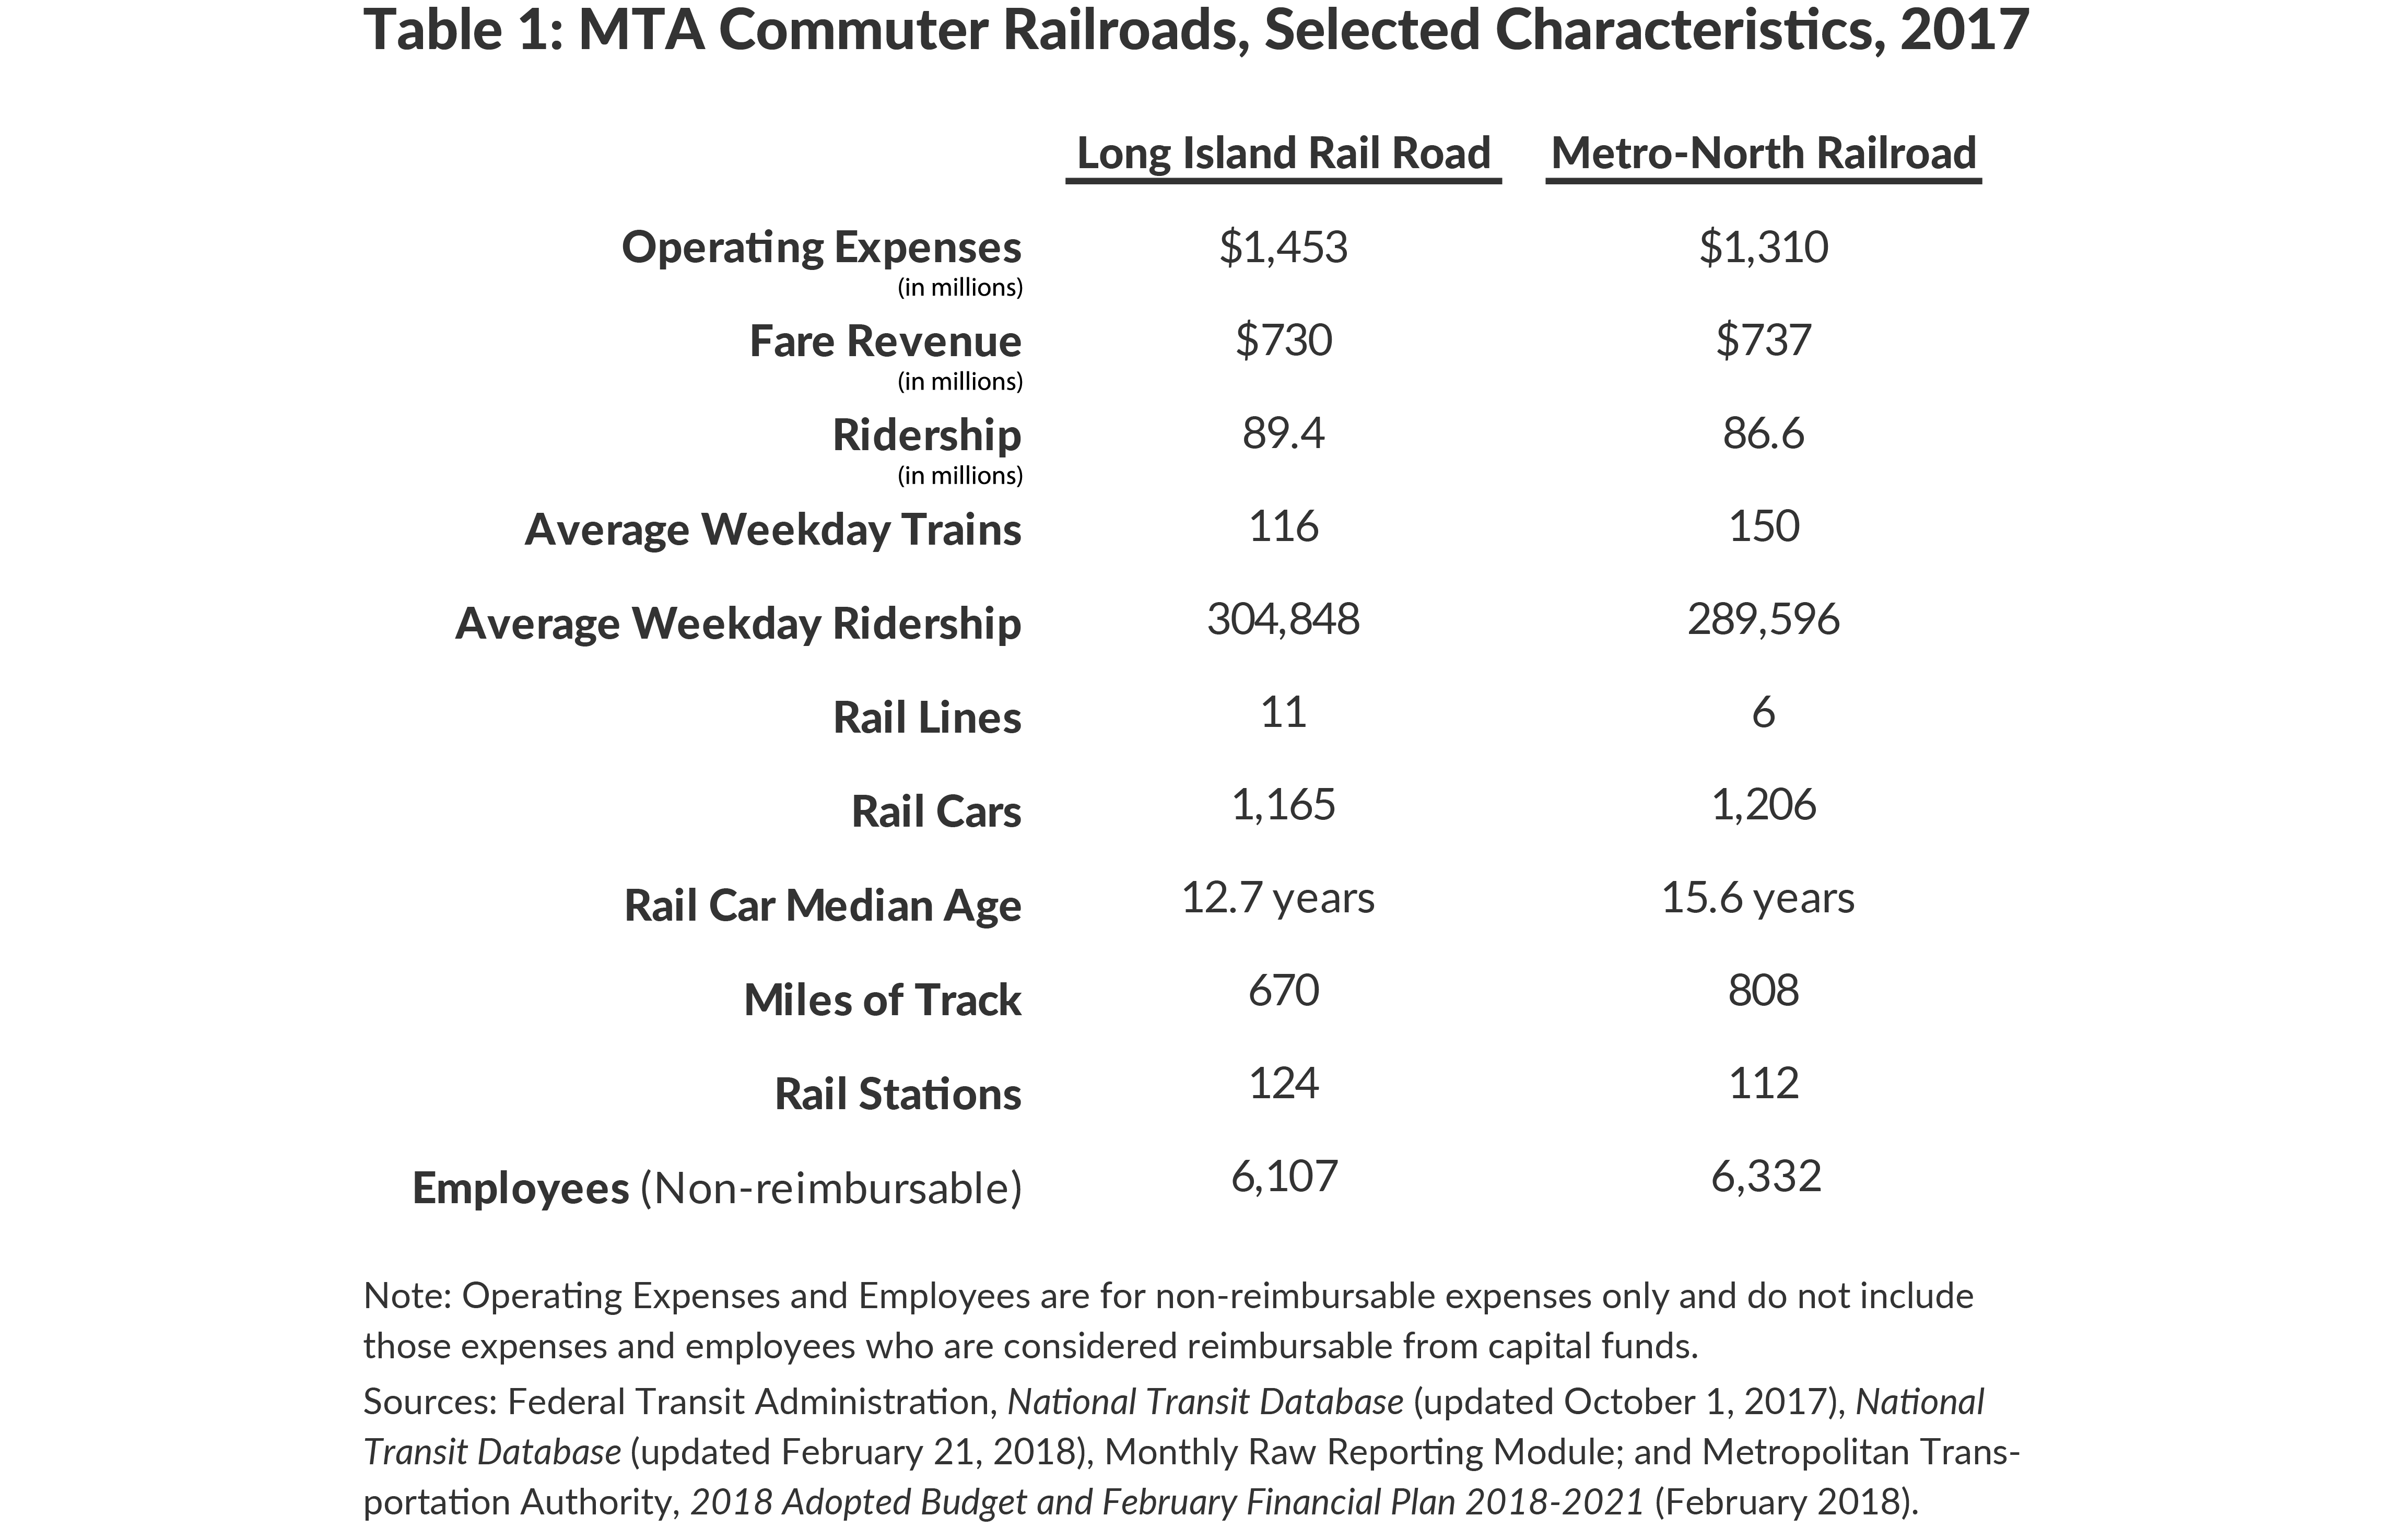
Yet despite distinct histories and operational idiosyncrasies, the railroads share many similarities. Both serve multicounty regions surrounding New York City and bring commuters into major transportation hubs in Midtown Manhattan. Both rely on unionized workforces that collectively bargain on a pattern basis. The railroads have similar numbers of stations, railcar fleets, and daily scheduled trains, although the LIRR operates 24 hours per day while Metro-North operates approximately 20 hours per day.4 (See Table 1.) After years of significant growth at Metro-North, annual ridership for the two railroads was nearly equal in 2016. Logistical differences in serving two different parts of the region persist, but both railroads have become more alike since joining the MTA.
The Long Island Rail Road is less efficient than Metro-North Railroad
In 2017 LIRR operating expenses totaled $1,453 million, 11 percent more than Metro-North’s $1,310 million.5 According to data compiled by the Federal Transit Administration (FTA), the LIRR spent more per hour of service, mile of service, and ride than Metro-North.6 (See Table 2.)
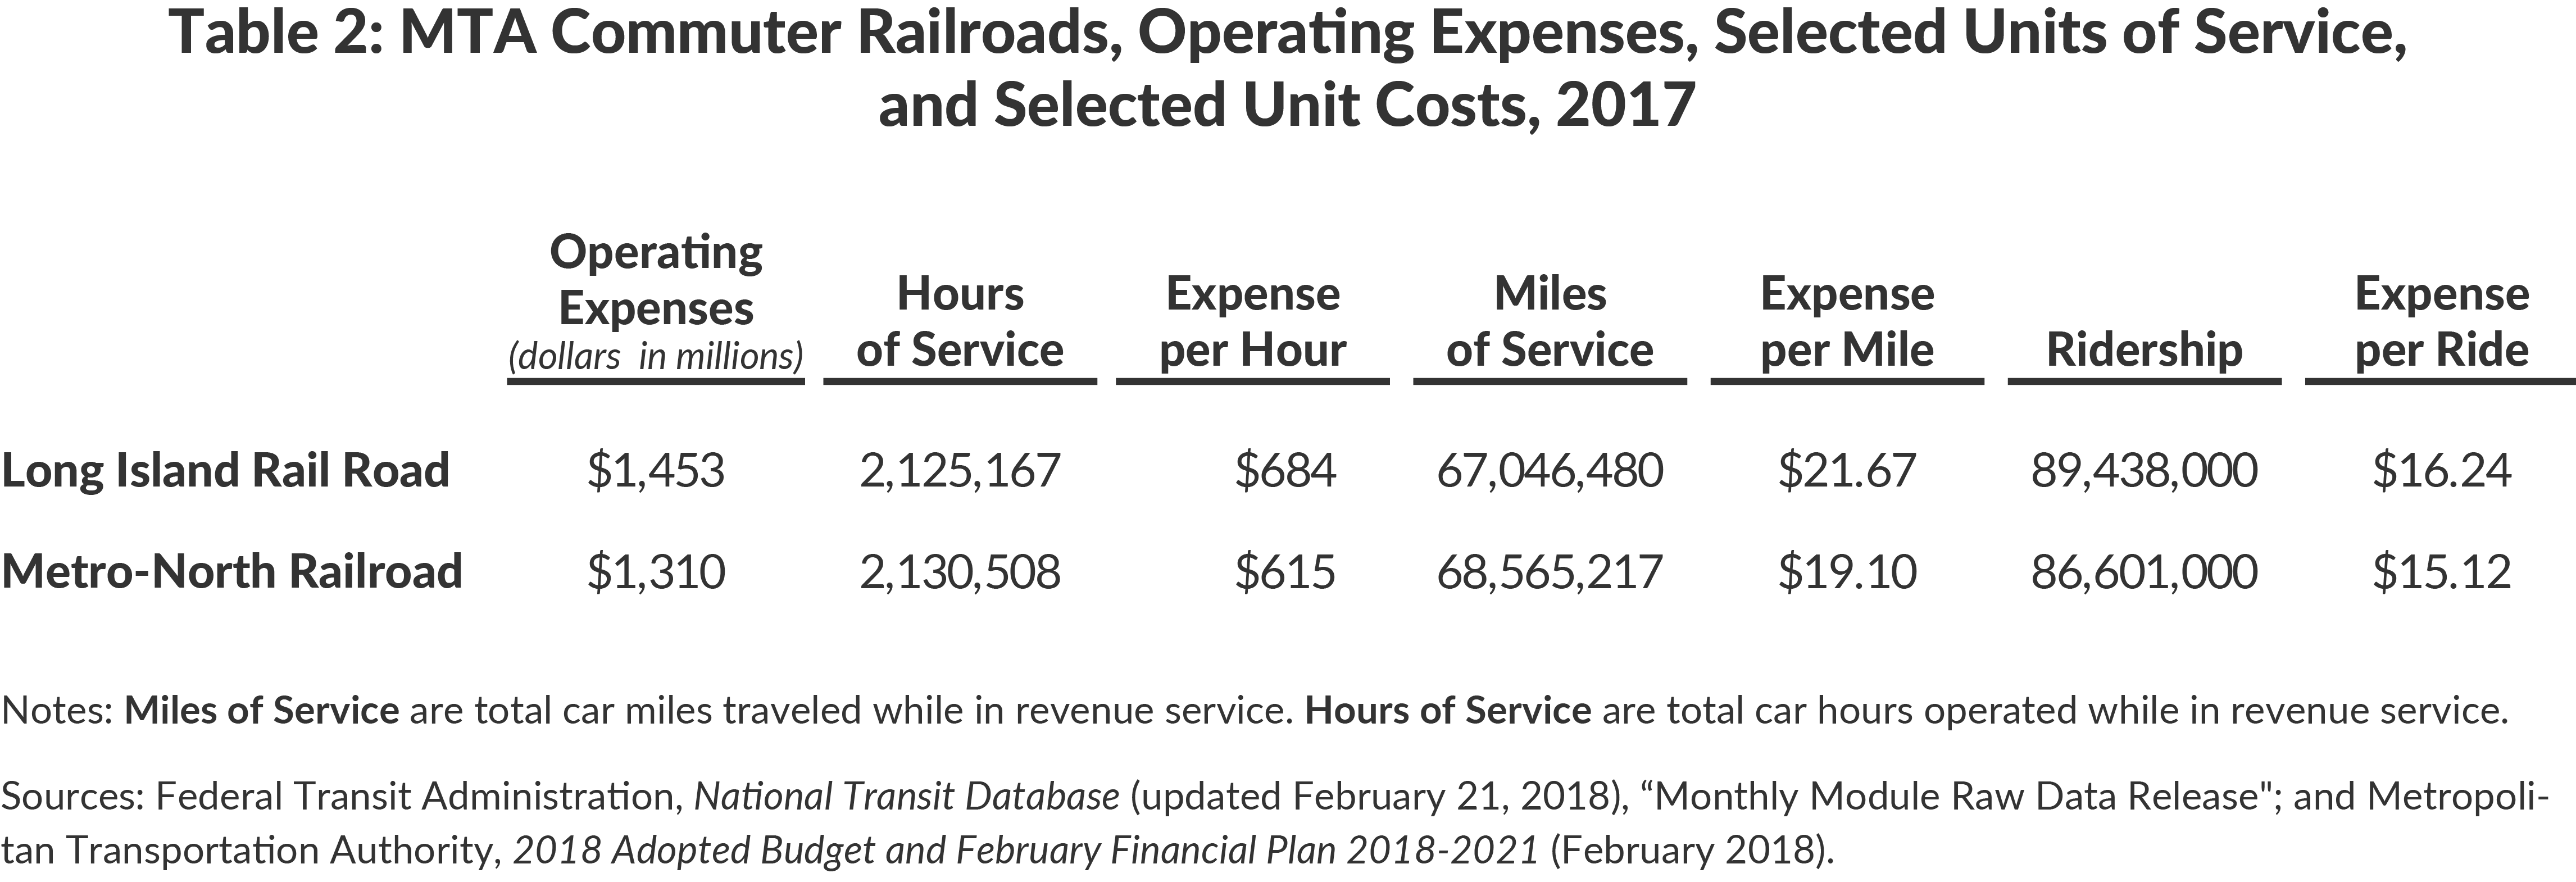
LIRR operating expenses per hour, per mile, and per ride were 11 percent, 13 percent, and 7 percent higher than corresponding figures at Metro-North. Aligning LIRR per-mile costs with Metro-North in 2017 would have saved $172 million, the equivalent of a 12 percent reduction in railroad operating expenses in that year.
A driver of these unit cost differences is the impact of certain legacy costs at the LIRR. Having continually operated since its original charter, the LIRR provides health benefits to a greater number of retirees. The LIRR also underwrites a closed and underfunded pension plan that has required significant catch-up payments in recent years.7 In 2017 LIRR retiree health insurance expense was $60 million compared to $33 million at Metro-North, and payments to cover the unfunded portion of the closed LIRR pension plan surpassed $32 million. Removing the pension expense related to the LIRR’s closed plan and current retiree health care expenses from unit cost calculations tightens the gap between the two railroads: the LIRR’s operating expenses per hour, per mile, and per ride would be 7 percent, 9 percent, and 3 percent higher than corresponding figures at Metro-North. With these adjustments aligning LIRR per-mile costs with Metro-North in 2017 would have saved $121 million.
Total labor expenses accounted for nearly 72 percent of operating expenses at the commuter railroads in 2017. These expenses include salaries and wages and benefits including pensions, health care for workers and retirees, and other fringe benefits. LIRR labor expenses were 14 percent greater than Metro-North’s—$1,051 million to $925 million; however, the LIRR employed 3.6 percent fewer workers—6,107 to 6,332.8 (See Figure 1.)
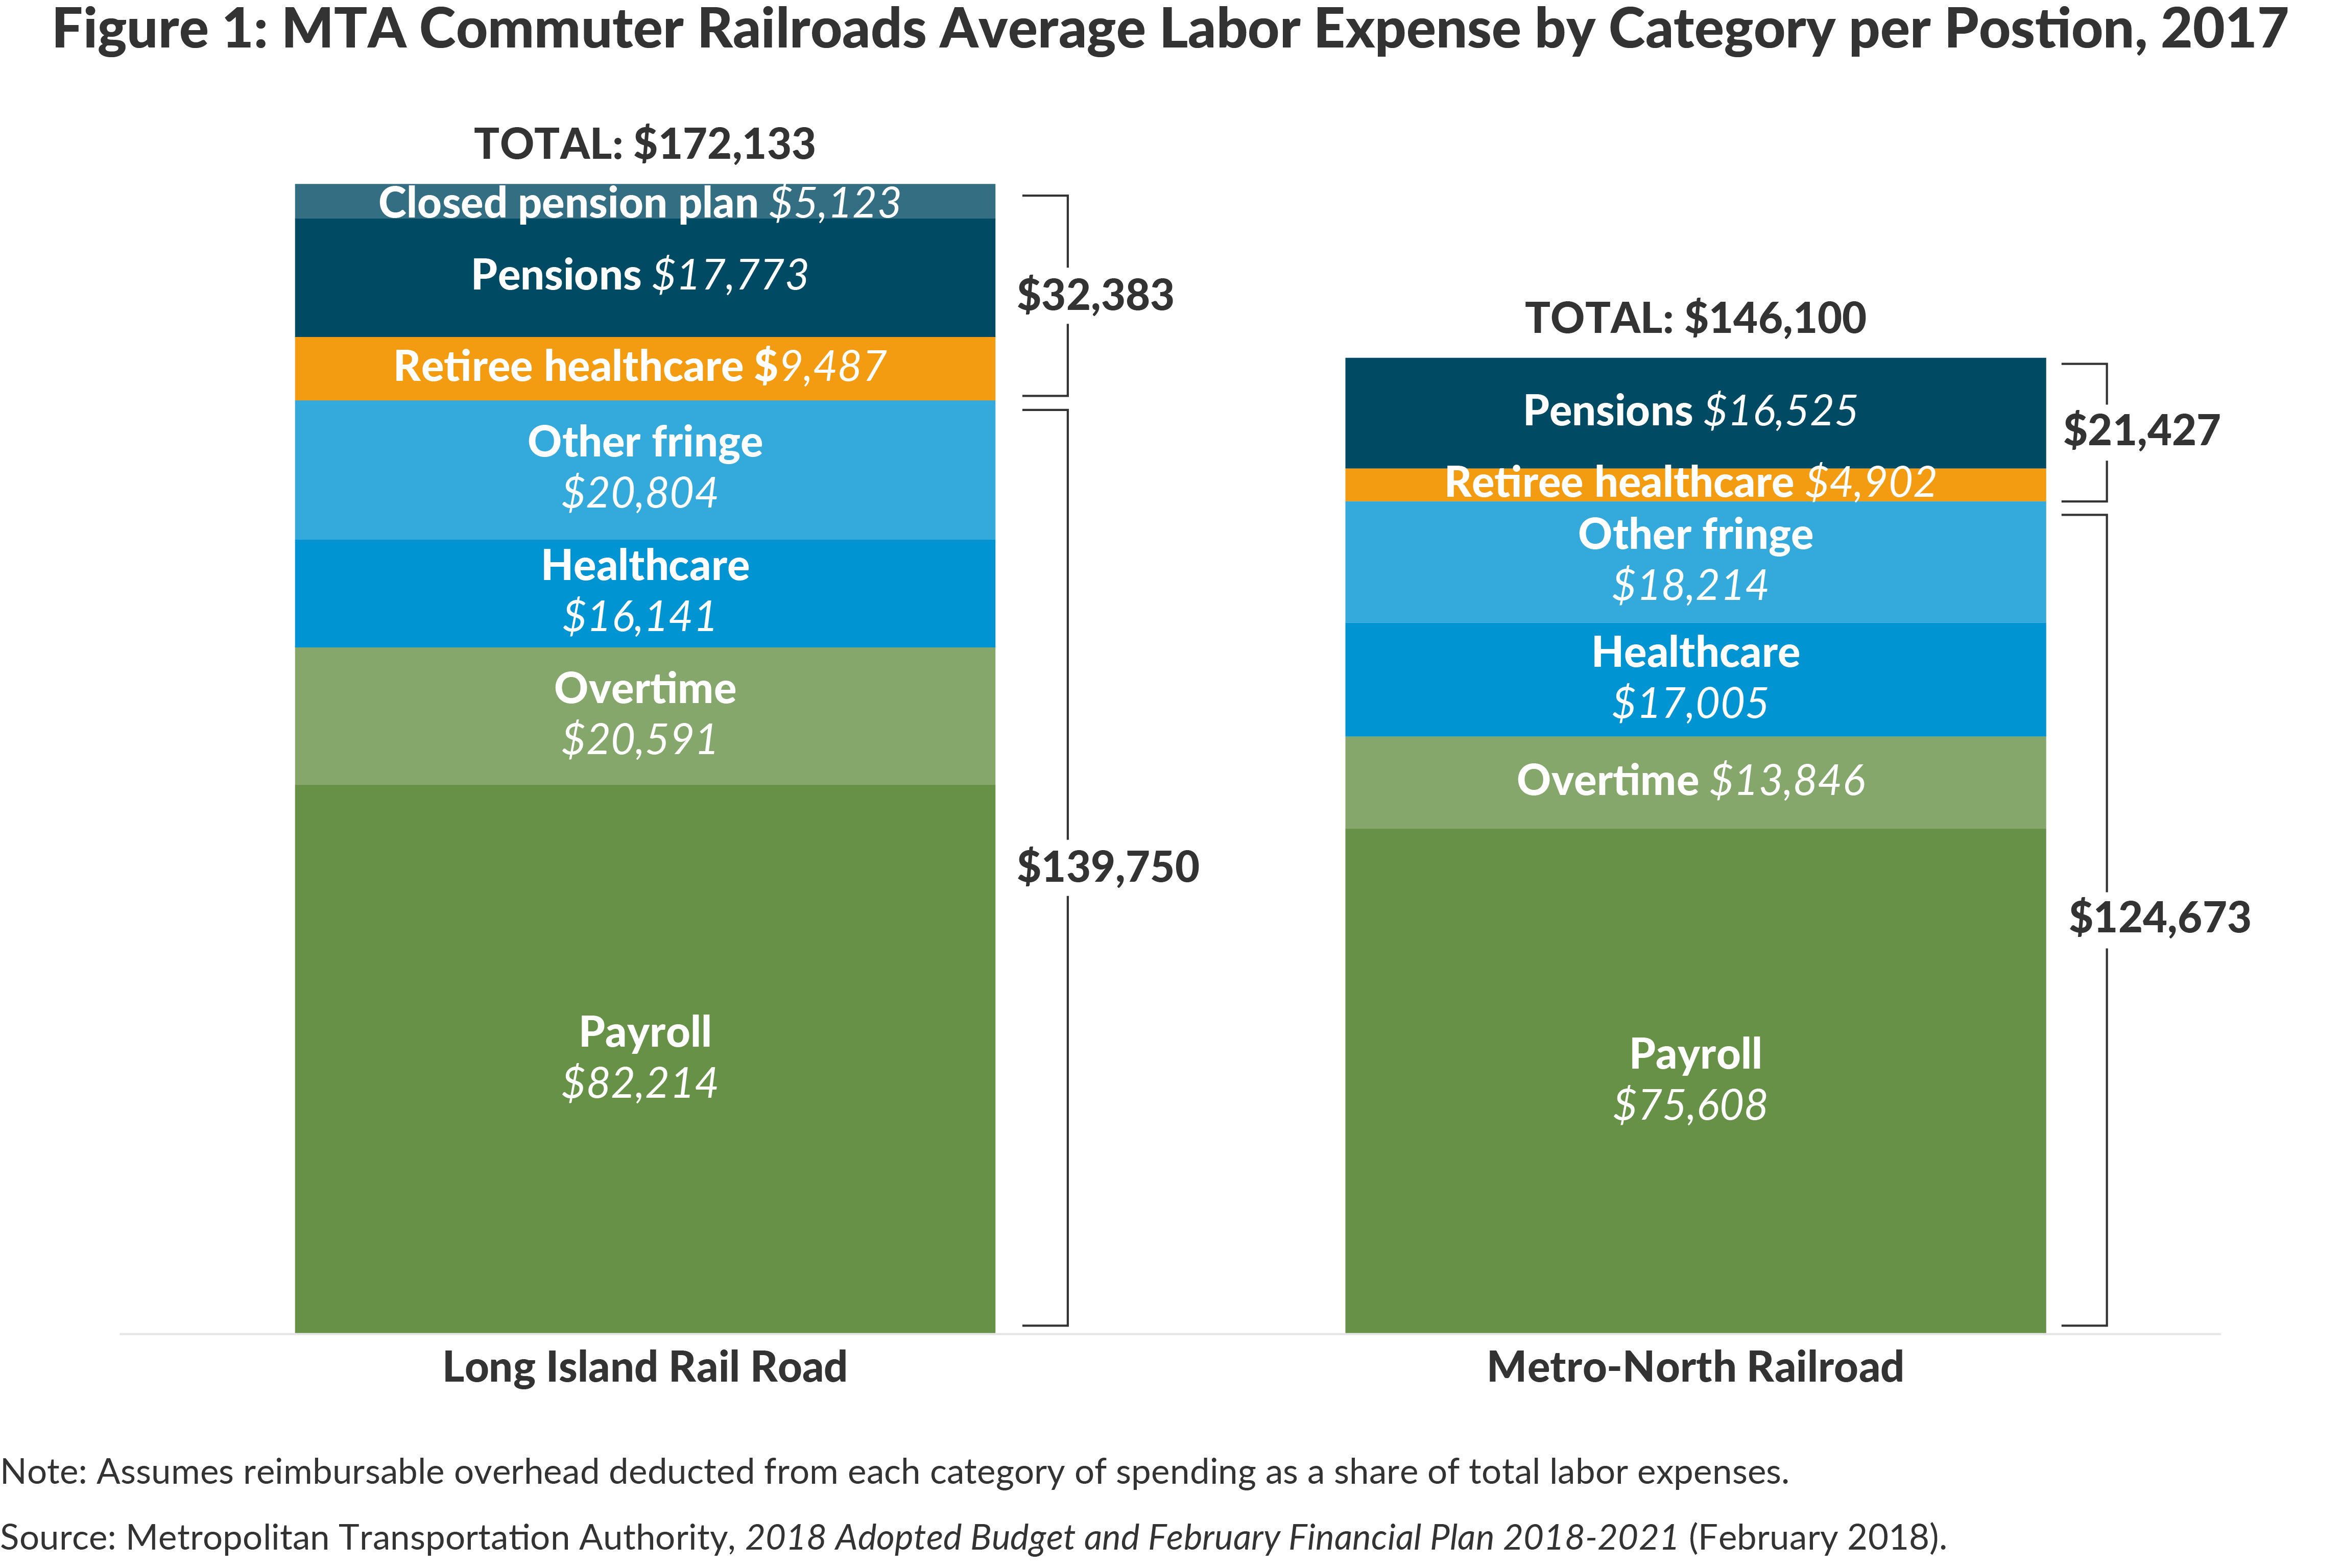
More than half of the difference in total labor expenses paid per position between the two railroads is due to aforementioned legacy costs—current payments for retiree health insurance and pensions. Removing retiree health care and pensions brings the LIRR per employee labor expense to $139,750 compared to Metro-North per employee labor expense of $124,673. Of the remaining difference, higher costs at the LIRR are due to higher payroll, overtime, and other fringe benefit expenses per employee, offset by slightly higher employee health insurance costs at Metro-North.
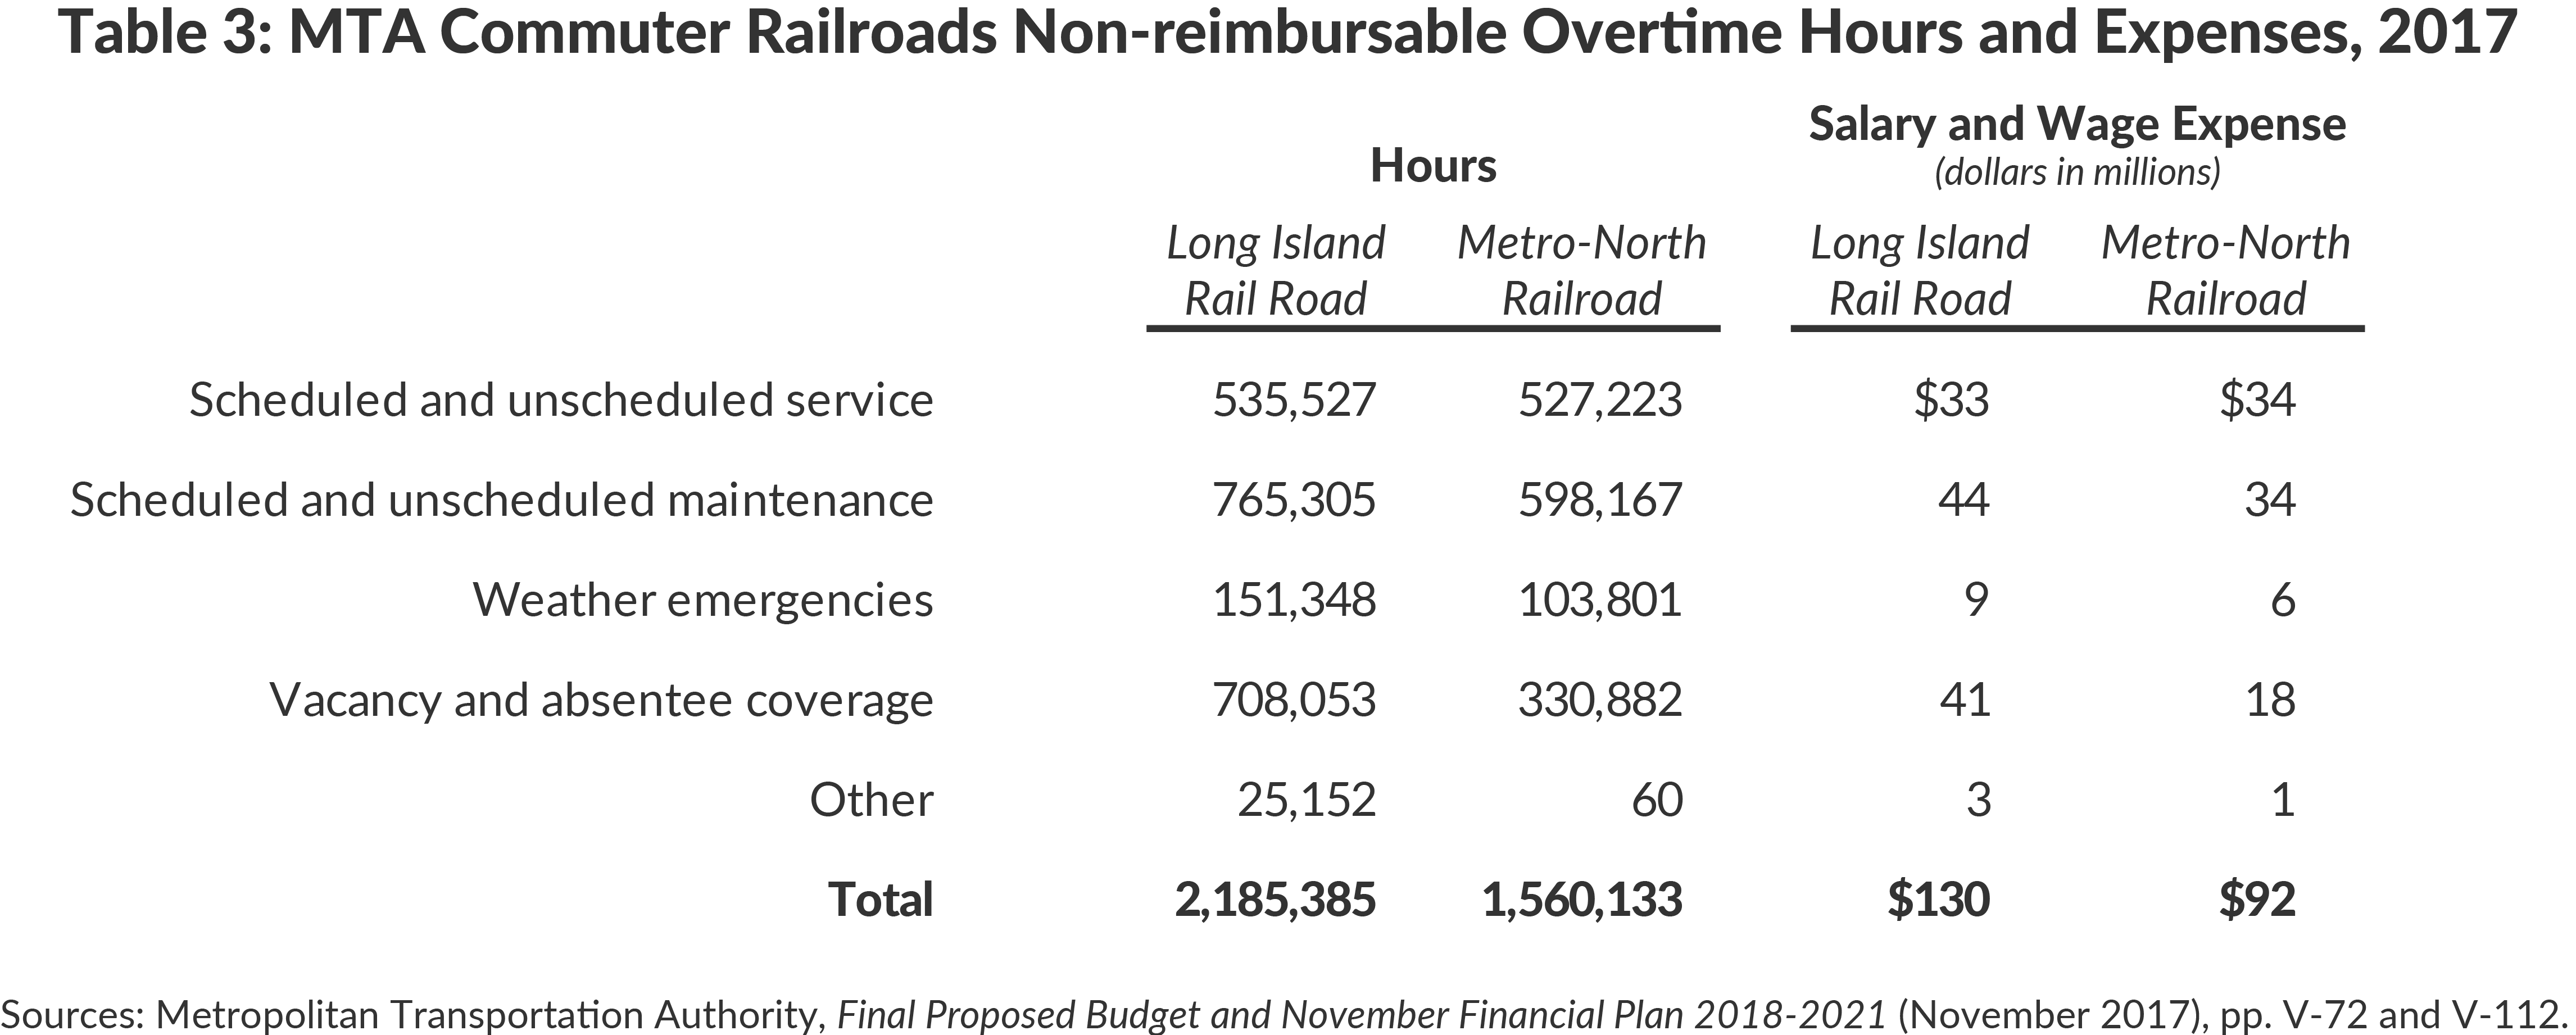
Overtime per position at the LIRR was 49 percent greater than at Metro-North. In 2017 this came from nearly 2.2 million hours in LIRR overtime versus 1.6 million hours for Metro-North, or overtime expenses of $130 million versus $92 million.9 Two areas that required significantly more overtime at the LIRR include scheduled and unscheduled maintenance, which required 28 percent more hours and 29 percent greater expense than Metro-North, and vacancy and absentee coverage, which required 114 percent more hours and 133 percent greater expense than Metro-North.10 (See Table 3.)
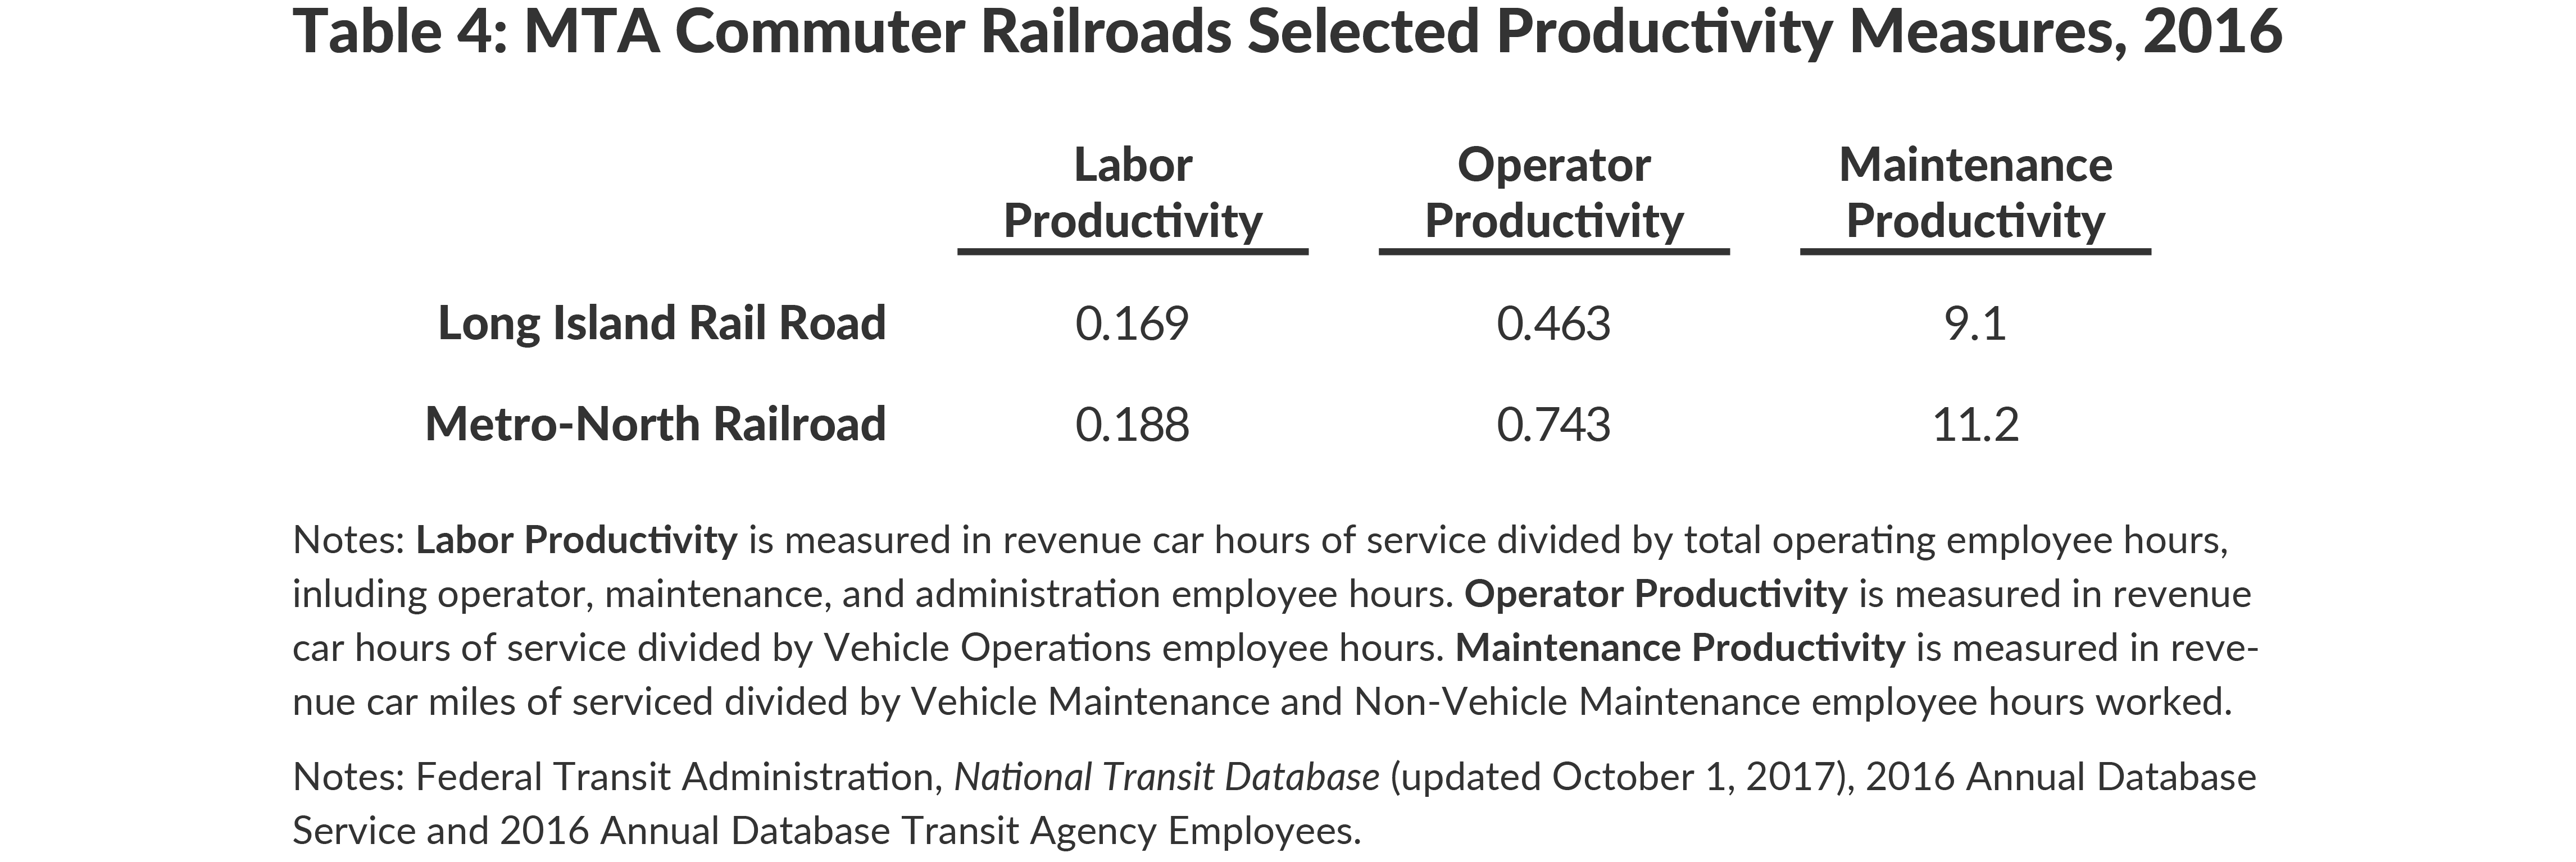
The LIRR not only spends more per worker, but uses more workers per unit of service than Metro-North.11 According to the most recent annual data compiled by the FTA, in 2016 labor productivity—the number of hours of service provided per employee hour worked—at the LIRR was 0.169, 10 percent less than Metro-North’s 0.188.12 (See Table 4.) The distinction is greater for operator productivity, which was 38 percent less at the LIRR than at Metro-North.13 Maintenance productivity—measured in the number of miles of service per maintenance employee hour worked—was also lower at the LIRR than Metro-North, with the LIRR supplying 9.1 miles per maintenance hour worked versus 11.2 miles per maintenance hour worked at Metro-North. Maintenance productivity is lower at the LIRR despite having a slightly lower average age of rolling stock and fewer track miles to maintain.14
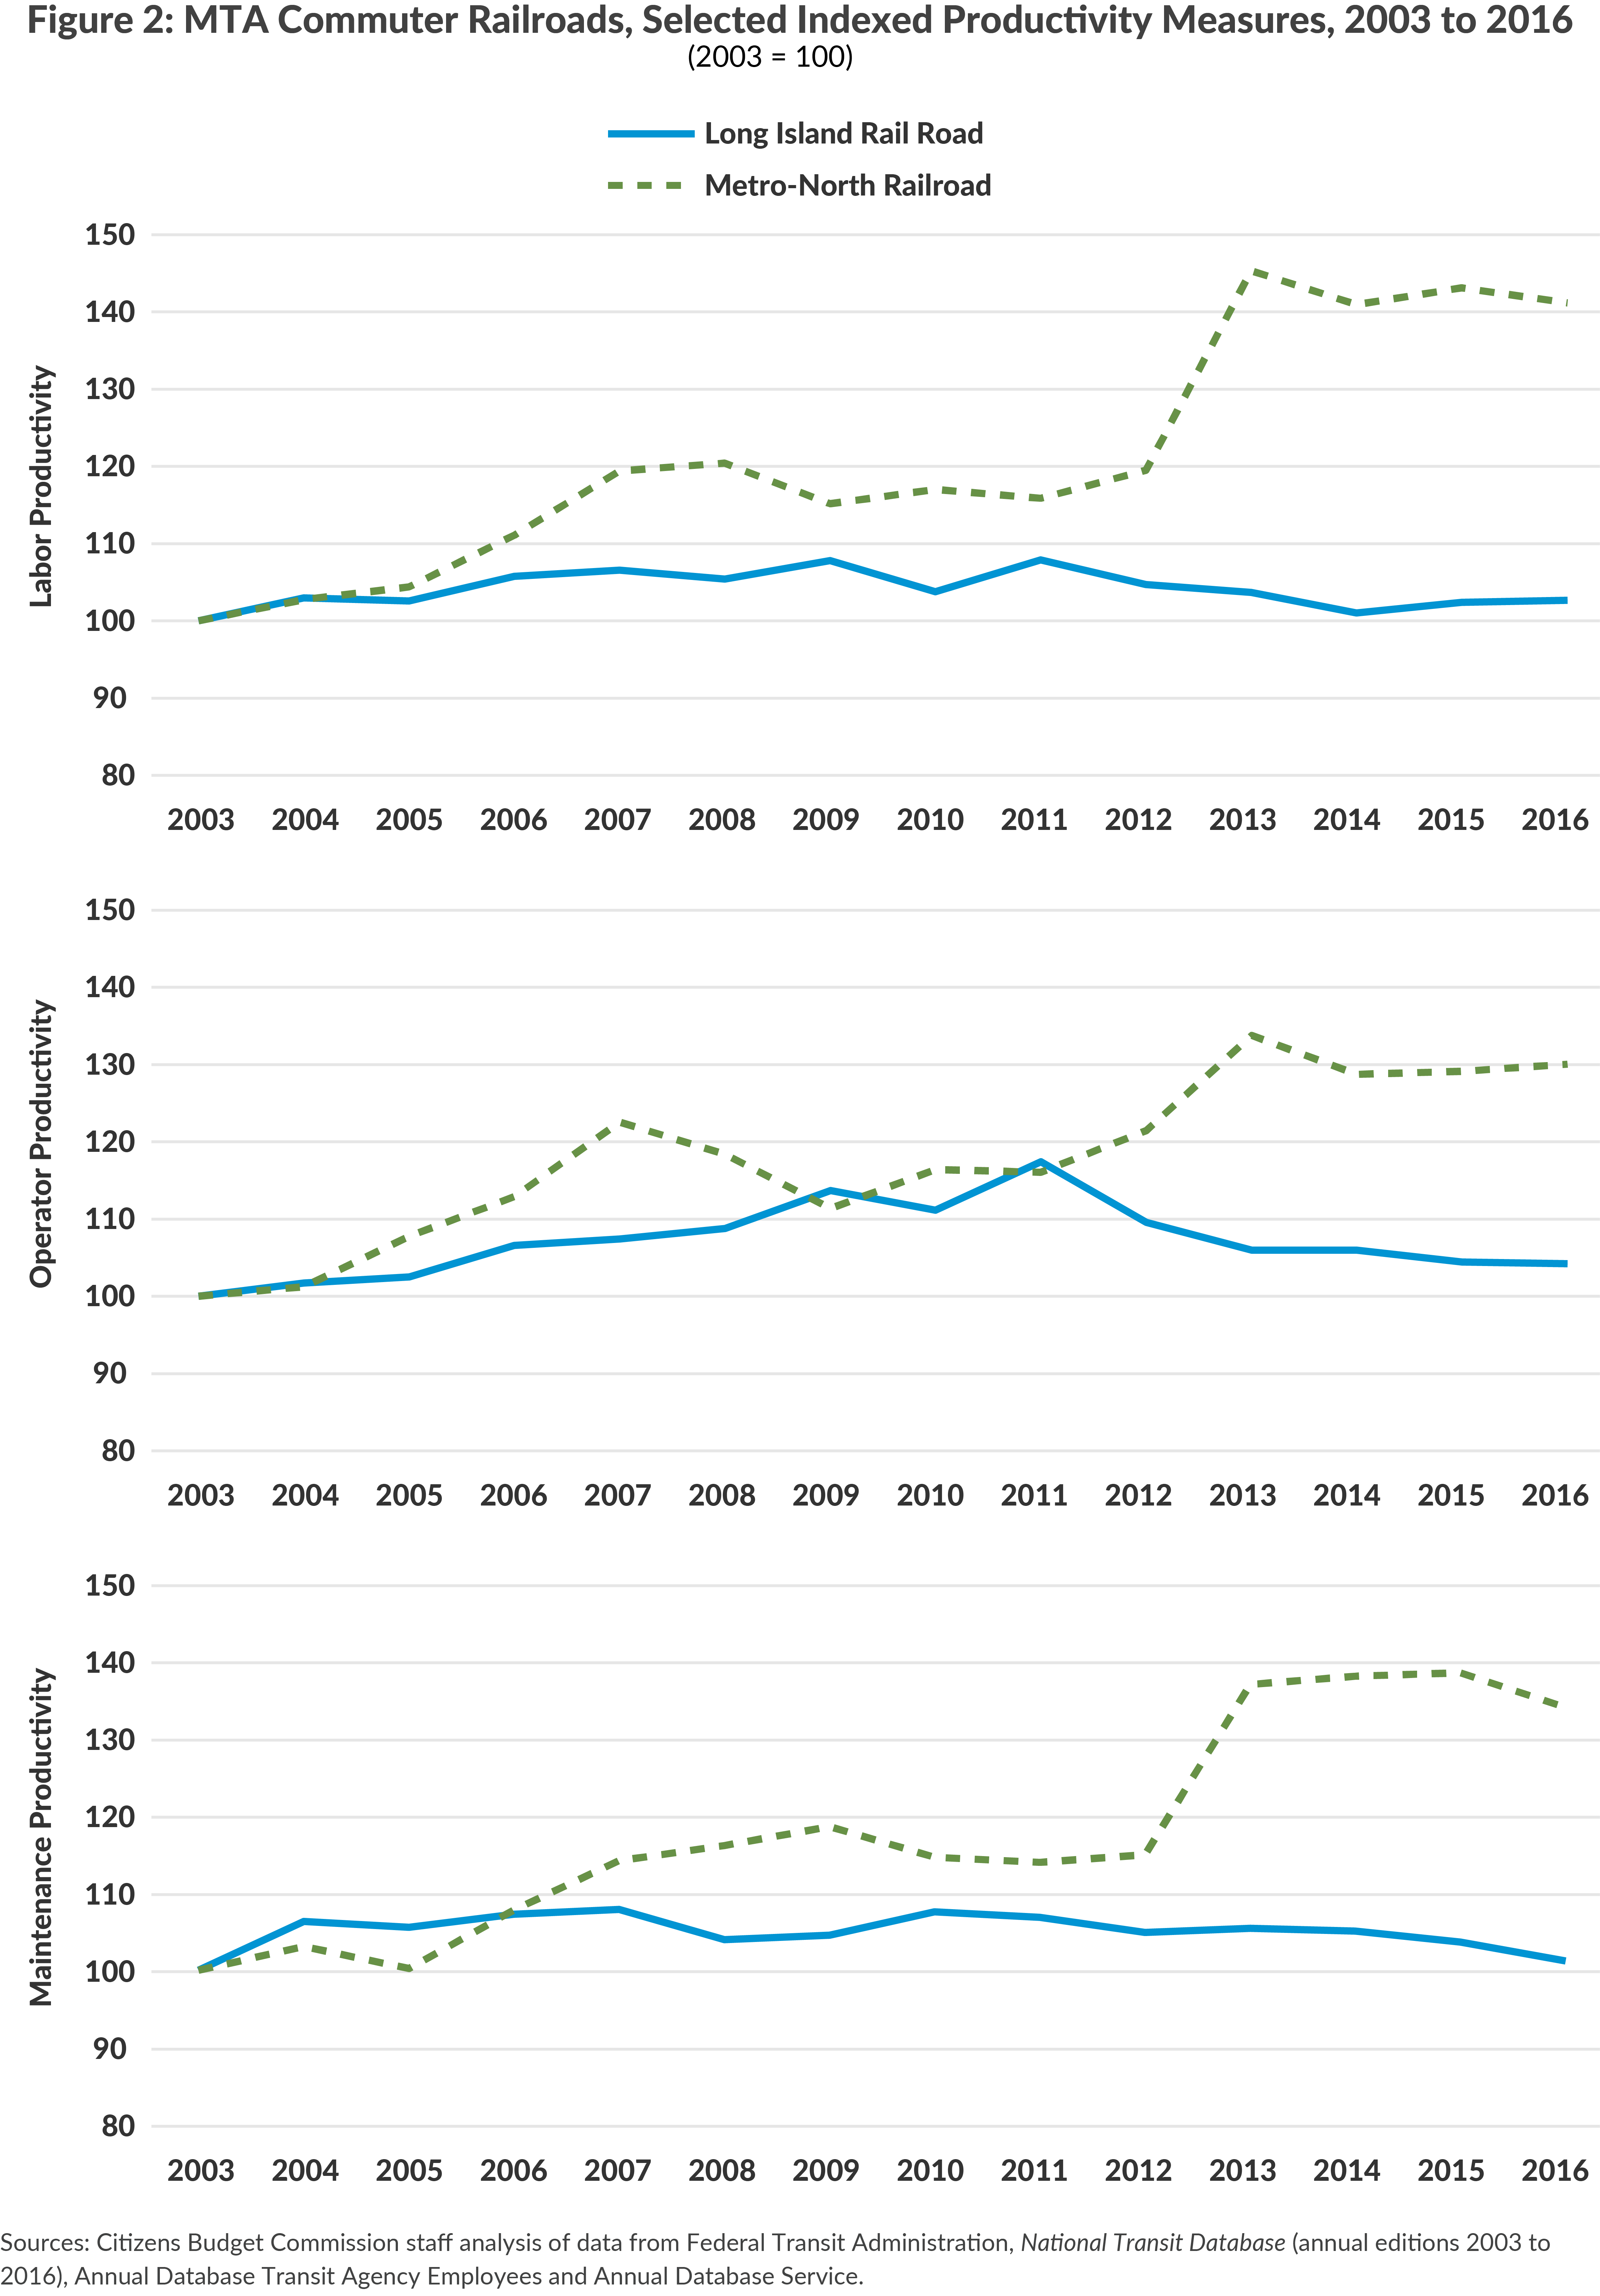
Lower productivity at the LIRR has not always been the case. In 2003, the first year for which data are available, the LIRR was more productive in each of these three metrics. However, while Metro-North productivity grew significantly over the ensuing 13 years, LIRR productivity stayed relatively flat. (See Figure 2.) Metro-North hours of service per employee hour increased 41 percent versus 3 percent at the LIRR; Metro-North hours per vehicle operator hour increased 30 percent versus 4 percent at the LIRR; and Metro-North miles per maintenance hour grew 34 percent, versus 1 percent at the LIRR. If the LIRR had matched the total productivity growth of Metro-North over the studied period, it would have required 27 percent fewer employee hours in 2016.15
Taxpayers—not Long Island Rail Road riders—pay most of the cost of its inefficiency
Like most public transit agencies, the MTA’s commuter railroads receive general tax subsidies and cross-subsidies from motorists. The gap between the railroads’ operating expenses and fare revenues is funded from other revenue sources including rentals, advertising, MTA Bridges and Tunnels surpluses, and dedicated taxes and subsidies. But the LIRR covers less of its operating costs than Metro-North; the LIRR’s operating loss accounted for 57 percent of the total for the two commuter railroads in 2017.
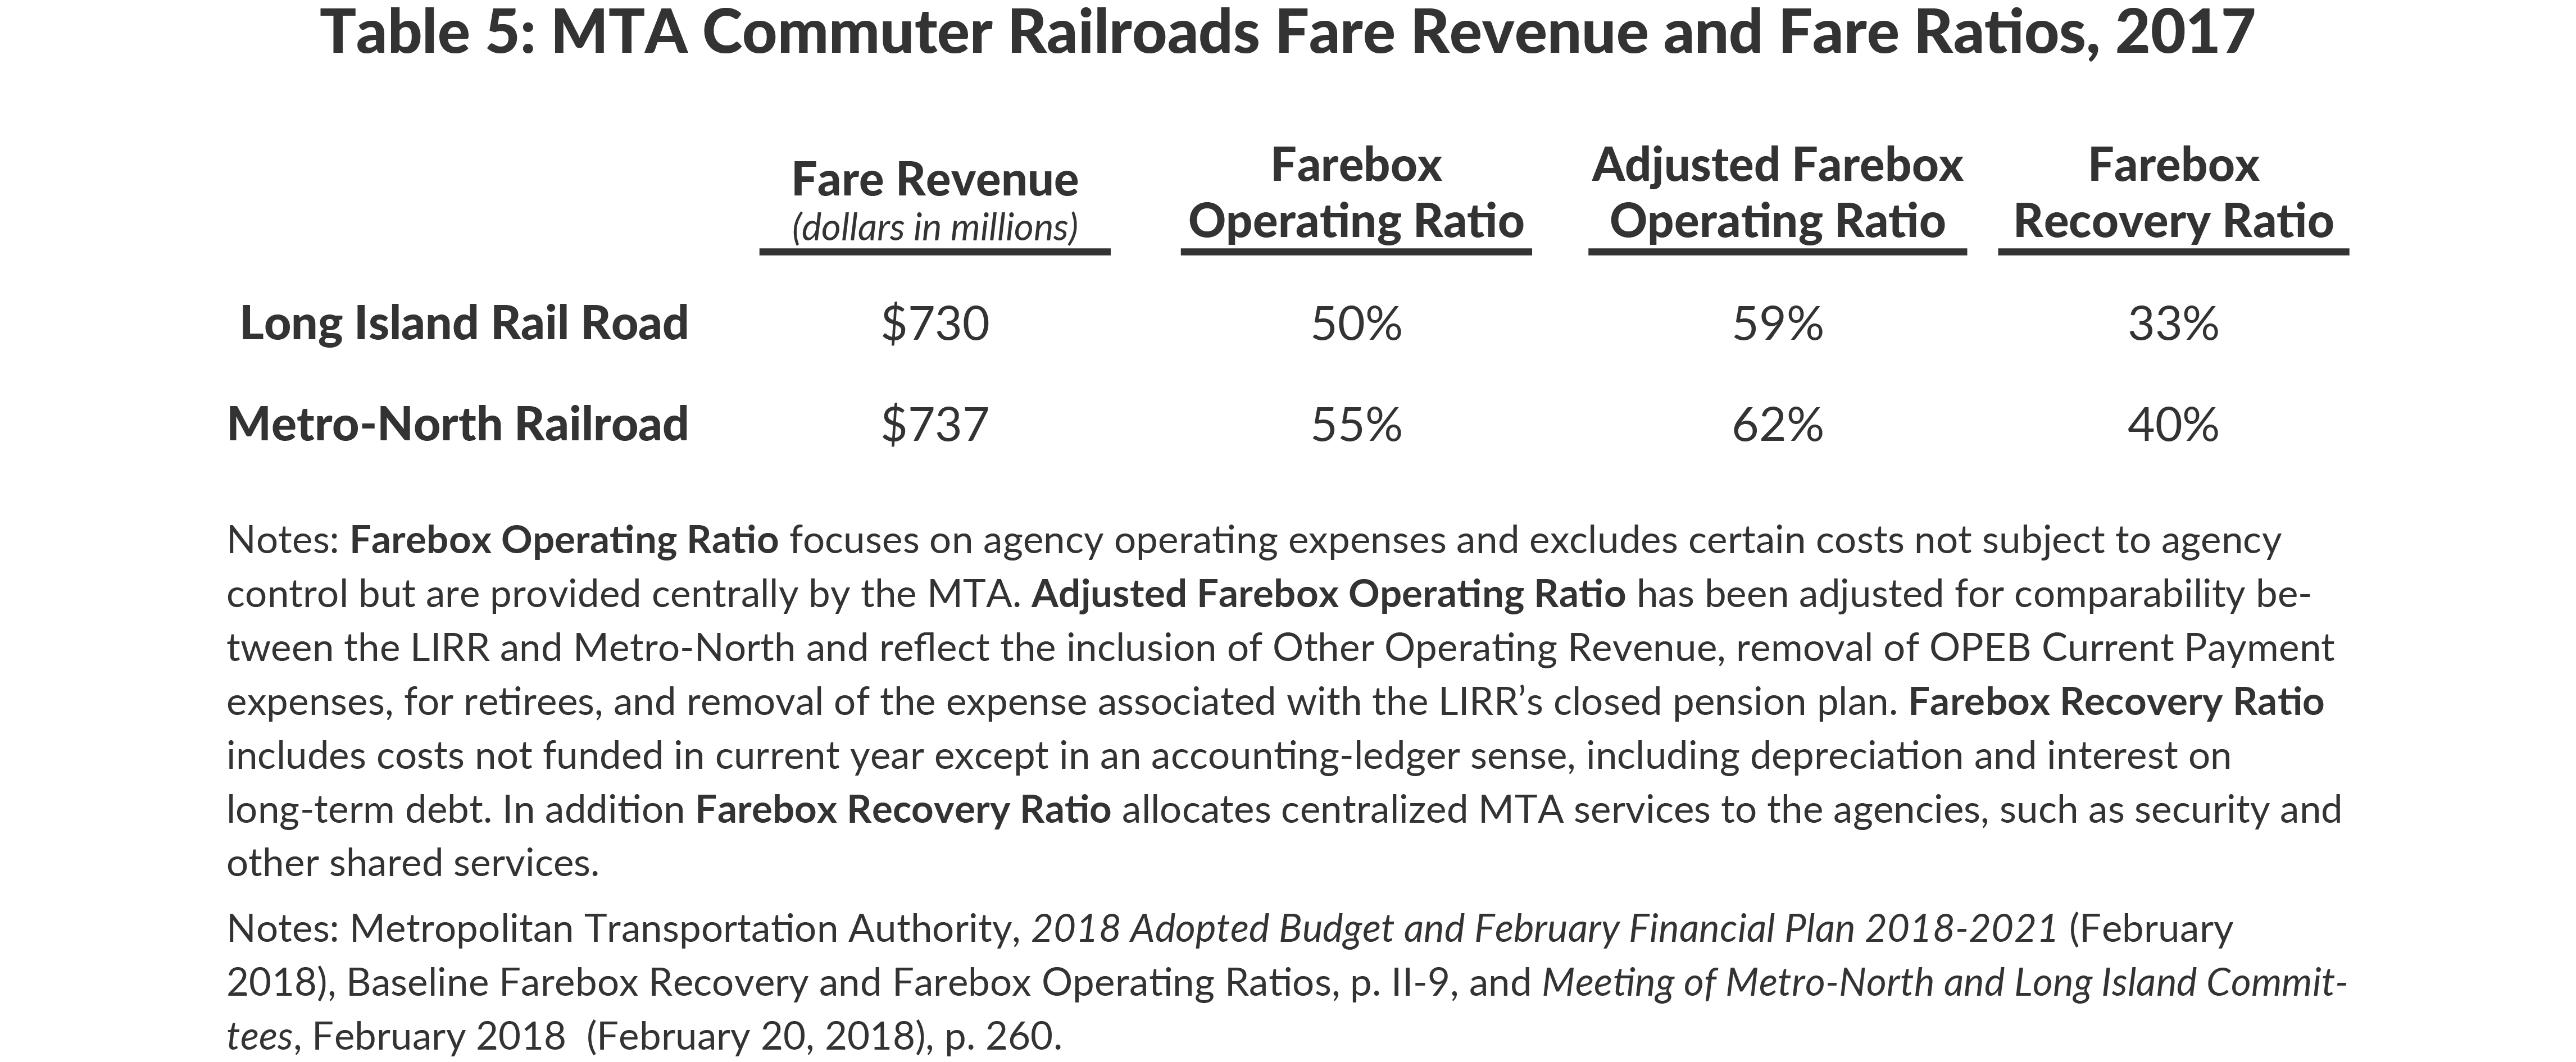
LIRR fare revenue of $730 million covered approximately 50 percent of its operating expenses, while Metro-North’s $737 million covered 55 percent. The MTA also calculates an adjusted operating ratio that modifies for comparability between the LIRR and Metro-North.16 In 2017 the LIRR’s adjusted operating ratio was nearly 59 percent, while Metro-North’s adjusted operating ratio was 62 percent. The difference between 59 percent and 62 percent of LIRR operating expenses is approximately $47 million.
The MTA also compares the railroads’ recovery ratios, which include debt service and other centralized MTA costs allocated to each railroad and does not include the aforementioned adjustments. For this measurement LIRR fare revenue is 33 percent of total expenses compared to 40 percent for Metro-North. (See Table 5.) Increasing the share of all LIRR costs covered by fares to the same level as Metro-North would have yielded an estimated $170 million additional fare revenue in 2017.
Reducing these inefficiencies requires productivity reforms
Labor expenses account for more than half of all commuter railroad costs and grew at an average annual rate of 3.7 percent, more than three times the rate of regional inflation over the past five years.17 Many of the variables in addition to wage rates that drive labor expenses—rules that govern assignments, scheduling and deployment of the workforce, and health benefits and pensions—are subject to collective bargaining. For the MTA commuter railroads, management must come to agreement with as many as 21 different bargaining units.18 Over the last two rounds of collective bargaining the MTA has made progress in generating savings by achieving employee contributions to benefits; however, there has been less success in introducing work rule reforms.
Simply standardizing work rules across the two railroads could help generate savings. For example, Metro-North train crews may be scheduled for split-shift time, meaning they earn a reduced rate during the down time between morning and evening peak periods while LIRR crews cannot. An analysis compiled in 2011 indicated that applying the split shifts to the LIRR could save $13 million annually in overtime alone. Additionally work rules and limited terminal rights at Penn Station coalesce to trigger certain penalty payments to LIRR workers. For example, once an LIRR train enters a yard, work rules state only a yard engineer may move a train; however, in order to meet tight schedules the revenue-service engineer may do the work, triggering a penalty payment in addition to normal wages.19
In 2014 the MTA and the commuter railroad unions reached an agreement on a largely retroactive six and one-half year contract that provided wage increases totaling 17 percent.20 This agreement for the first time required that employees contribute to the cost of their health insurance and that new employees contribute to their pensions for 15 years.21 But the agreement did not contain commitments to increase productivity.
The 2014 deal expired in January 2017, and in the subsequent month the MTA signed a 28-month agreement with the LIRR’s two largest unions that included wage increases totaling 5 percent and a one-time $500 bonus.22 Based on this agreement, the MTA does not expect to gain productivity commitments from this round of collective bargaining, representing a lost opportunity to impact meaningfully the finances of the commuter railroads. However, another round of bargaining will take effect in early 2019, and MTA management should begin identifying its agenda for improved productivity.
This policy brief is based on research completed by CBC Public Policy Fellow Peter Cipriano. It was prepared by Jamison Dague, Director of Infrastructure Studies. Carol Kellermann, President; Maria Doulis, Vice President; Timothy Sullivan, Director of Research; and Charles Brecher, Senior Advisor for Health Policy, provided editorial guidance. The report was edited by Laura Colacurcio and formatted for publication by Kevin Medina.
A draft of this policy brief was sent to the Metropolitan Transportation Authority officials, as well as other interested parties. We are grateful for their comments and suggestions.
Download Report
4 Things You Should Know About the MTA's Commuter RailroadsFootnotes
- Those lines east of the Hudson River were part of the New York Central Railroad, and those railroads west of the Hudson River were part of the Erie Lackawanna Railroad.
- See: Harvard Business School, Baker Library Historical Collections, “Penn Central Transportation Company” (accessed October 19, 2017), www.library.hbs.edu/hc/lehman/company.html?company=penn_central_transportation_company; Derek Stadler, “The Modernization of the Long Island Rail Road,” Long Island History Journal (December 2016), https://lihj.cc.stonybrook.edu/2016/articles/the-modernization-of-the-long-island-rail-road/; and Congressional Budget Office, Economic Viability of Conrail (August 1986), pp. 1-4, www.cbo.gov/publication/15210?index=5016&type=1.
- Additionally many passengers transfer at Jamaica. This can increase the number of delays as trains must wait for other trains before departing, and it requires the LIRR to check tickets twice, requiring additional conductors to perform these checks before trains reach their final destination.
- The first train arrives at Grand Central Terminal at 5:30 a.m. and the last train departs at 2:00 a.m.
- All 2017 budget figures are final estimates from the MTA’s February financial plan update. See: Metropolitan Transportation Authority, 2018 Adopted Budget, February Financial Plan 2018-2021 (February 2018), pp. VI-39 and VI-61, http://web.mta.info/mta/budget/.
- Federal Transit Administration, National Transit Database (updated February 21, 2018), Monthly Module Raw Data Release, www.transit.dot.gov/ntd/ntd-data.
- Even if the LIRR closed tomorrow, the MTA would still be liable for funding this closed plan, known in the MTA’s financial statements as the Additional Plan.
- These employee figures refer to non-reimbursable employees. See: Metropolitan Transportation Authority, 2018 Adopted Budget, February Financial Plan 2018-2021 (February 2017), Baseline Total Non-Reimbursable Positions by Agency, p. III-27, http://web.mta.info/mta/budget/.
- Final estimates for overtime hours and overtime salary and wage expense for 2017 from MTA’s November financial plan as the February financial plan does not include 2017 figures. See: Metropolitan Transportation Authority, 2018 Final Proposed Budget, November Financial Plan 2018-2021 (November 2017), pp. V-72 and V-112, http://web.mta.info/mta/budget/.
- Though 2017 may have required more overtime hours from LIRR workers coping with the railroad’s “Summer of Hell,” discrepancies in overtime persist since the MTA began reporting the data as part of its financial plan updates in 2012.
- Part of this is owing to the difference in the labor required to provide each unit of service owing to operational idiosyncrasies at the LIRR.
- Citizens Budget Commission (CBC) staff analysis of data from Federal Transit Administration, National Transit Database (updated October 1, 2017), 2016 Annual Database Transit Agency Employees and 2016 Annual Database Service, www.transit.dot.gov/ntd/ntd-data.
- A major driver of lower operator productivity at the LIRR is the need for additional conductors to check tickets twice before and after transfers at Jamaica.
- Federal Transit Administration, National Transit Database (updated October 1, 2017), 2016 Annual Database Revenue Vehicle Inventory and 2016 Track and Roadway, www.transit.dot.gov/ntd/ntd-data.
- CBC staff analysis of data from Federal Transit Administration, National Transit Database (annual editions 2003 to 2016), Annual Database Transit Agency Employees and Annual Database Service, www.transit.dot.gov/ntd/ntd-data.
- This adjustment excludes unfunded actuarial accrued liability associated with the LIRR’s closed pension plan and OPEB Current Payment representing non-pension benefits for retirees. It includes other operating revenue and additional fare revenue if Connecticut fares were equalized with Metro-North’s New York fares. See: Metropolitan Transportation Authority, Meeting of Metro-North and Long Island Committees, February 2018 (February 20, 2018), p. 260, http://web.mta.info/mta/news/books/.
- Metropolitan Transportation Authority, Adopted Budget, February Financial Plan (annual editions 2014 to 2018), http://web.mta.info/mta/budget/; and U.S. Department of Labor, Bureau of Labor Statistics, Consumer Price Index – New York-Newark-Jersey City (accessed March 30, 2018), All Urban Consumers – (CPI-U), www.bls.gov/regions/new-york-new-jersey/data/xg-tables/ro2xgcpiny1967.htm.
- Moreover, commuter railroad labor relations are governed by the Federal Railway Labor Act (RLA) and not the New York State Taylor Law, which applies to transit workers who operate and maintain buses and subways. The RLA specifies the negotiation and mediation procedures that unions and employers must use. Moreover, unlike employees beholden to the Taylor Law, RLA covered employees may strike. See: Linda Greenhouse, "High Court Rules LIRR Employees May Go On Strike," New York Times (March 25, 1982), www.nytimes.com/1982/03/25/nyregion/high-court-rules-lirr-employees-may-go-on-strike.html.
- Metropolitan Transportation Authority, Budget Division, An Analysis of, and Proposed Changes to, Farebox Operating Ratios for the Long Island Rail Road and Metro-North Railroad (May 16, 2011).
- This settlement followed a Presidential Emergency Board citing the 17 percent proposal by labor leaders as "reasonable." See: Alfonso Castillo, "LIRR unions backed by 2nd Obama board in MTA contract battle," Newsday (May 20, 2014), www.newsday.com/long-island/lirr-unions-backed-by-2nd-obama-board-in-mta-contract-battle-1.8109518.
- The deal also introduced a longer wage scale progression. See: Metropolitan Transportation Authority, Memorandum of Understanding Between the Long Island Rail Road Company and Transportation Communications Union (July 2014), pp. 3-4, and “Governor Cuomo Announces Labor Agreement Between MTA and LIRR” (press release, July 17, 2014), www.mta.info/news-lirr-long-island-rail-road-strike-labor-unions-governor/2014/07/17/governor-cuomo-announces.
- These agreements are modeled on the agreement reached with the Transport Workers Union (TWU) in February 2017. They are expected to cover a 28-month period and will provide a 2.5 percent wage increase in January 2017 and in February 2018, as well as one-time bonuses of $500 in March 2019. Though Metro-North unions have yet to settle on a contract, the MTA assumes a similar outcome to the TWU contract. See: Metropolitan Transportation Authority, 2018 Preliminary Budget and July Financial Plan 2018-2021 (July 2017), p. II-17, http://web.mta.info/mta/budget/; and Transport Workers Union Local 100, MTA and TWU Term Sheet (January 2017), www.twulocal100.org/sites/twulocal100.org/files/contract_mou_2017-2019.pdf.