An Assessment of Performance Reporting by Regional Economic Development Councils
Since 2011, Regional Economic Development Councils (REDCs) have been the centerpiece of a comprehensive program for coordinating economic development efforts across the state. REDCs are tasked with developing long-term strategic plans for economic growth for their respective regions. In this role, REDCs coordinate the funding application process in their regions, and in conjunction with Empire State Development (ESD), assure that strategies are linked to measurable outcomes and that progress is reported to the public. When the REDC initiative was announced in 2011, the Citizens Budget Commission (CBC) praised it as an opportunity to streamline and improve economic development programs in New York State. Four recommendations were offered: (1) consolidate economic development entities; (2) standardize metrics and pay for performance; (3) improve transparency; and (4) maximize effectiveness of existing funding streams before increasing funds. After four years of funding, CBC is assessing how well the REDC initiative has performed against these standards.
Despite enhanced coordination of regional stakeholders, a widespread lack of reporting on project outcomes has limited the State’s ability to track performance at both the regional and project levels. This lack of reporting results in the absence of a feedback mechanism for the REDC strategic planning process. Examining the available data on regional and project level performance, CBC finds a weak relationship between funding and positive outcomes. Recent changes in reporting indicate some of these limitations have been recognized; CBC now offers additional recommendations on setting goals and collecting standardized data so ESD can better use project performance to support REDCs in directing economic development funds more efficiently.
Background on REDCs
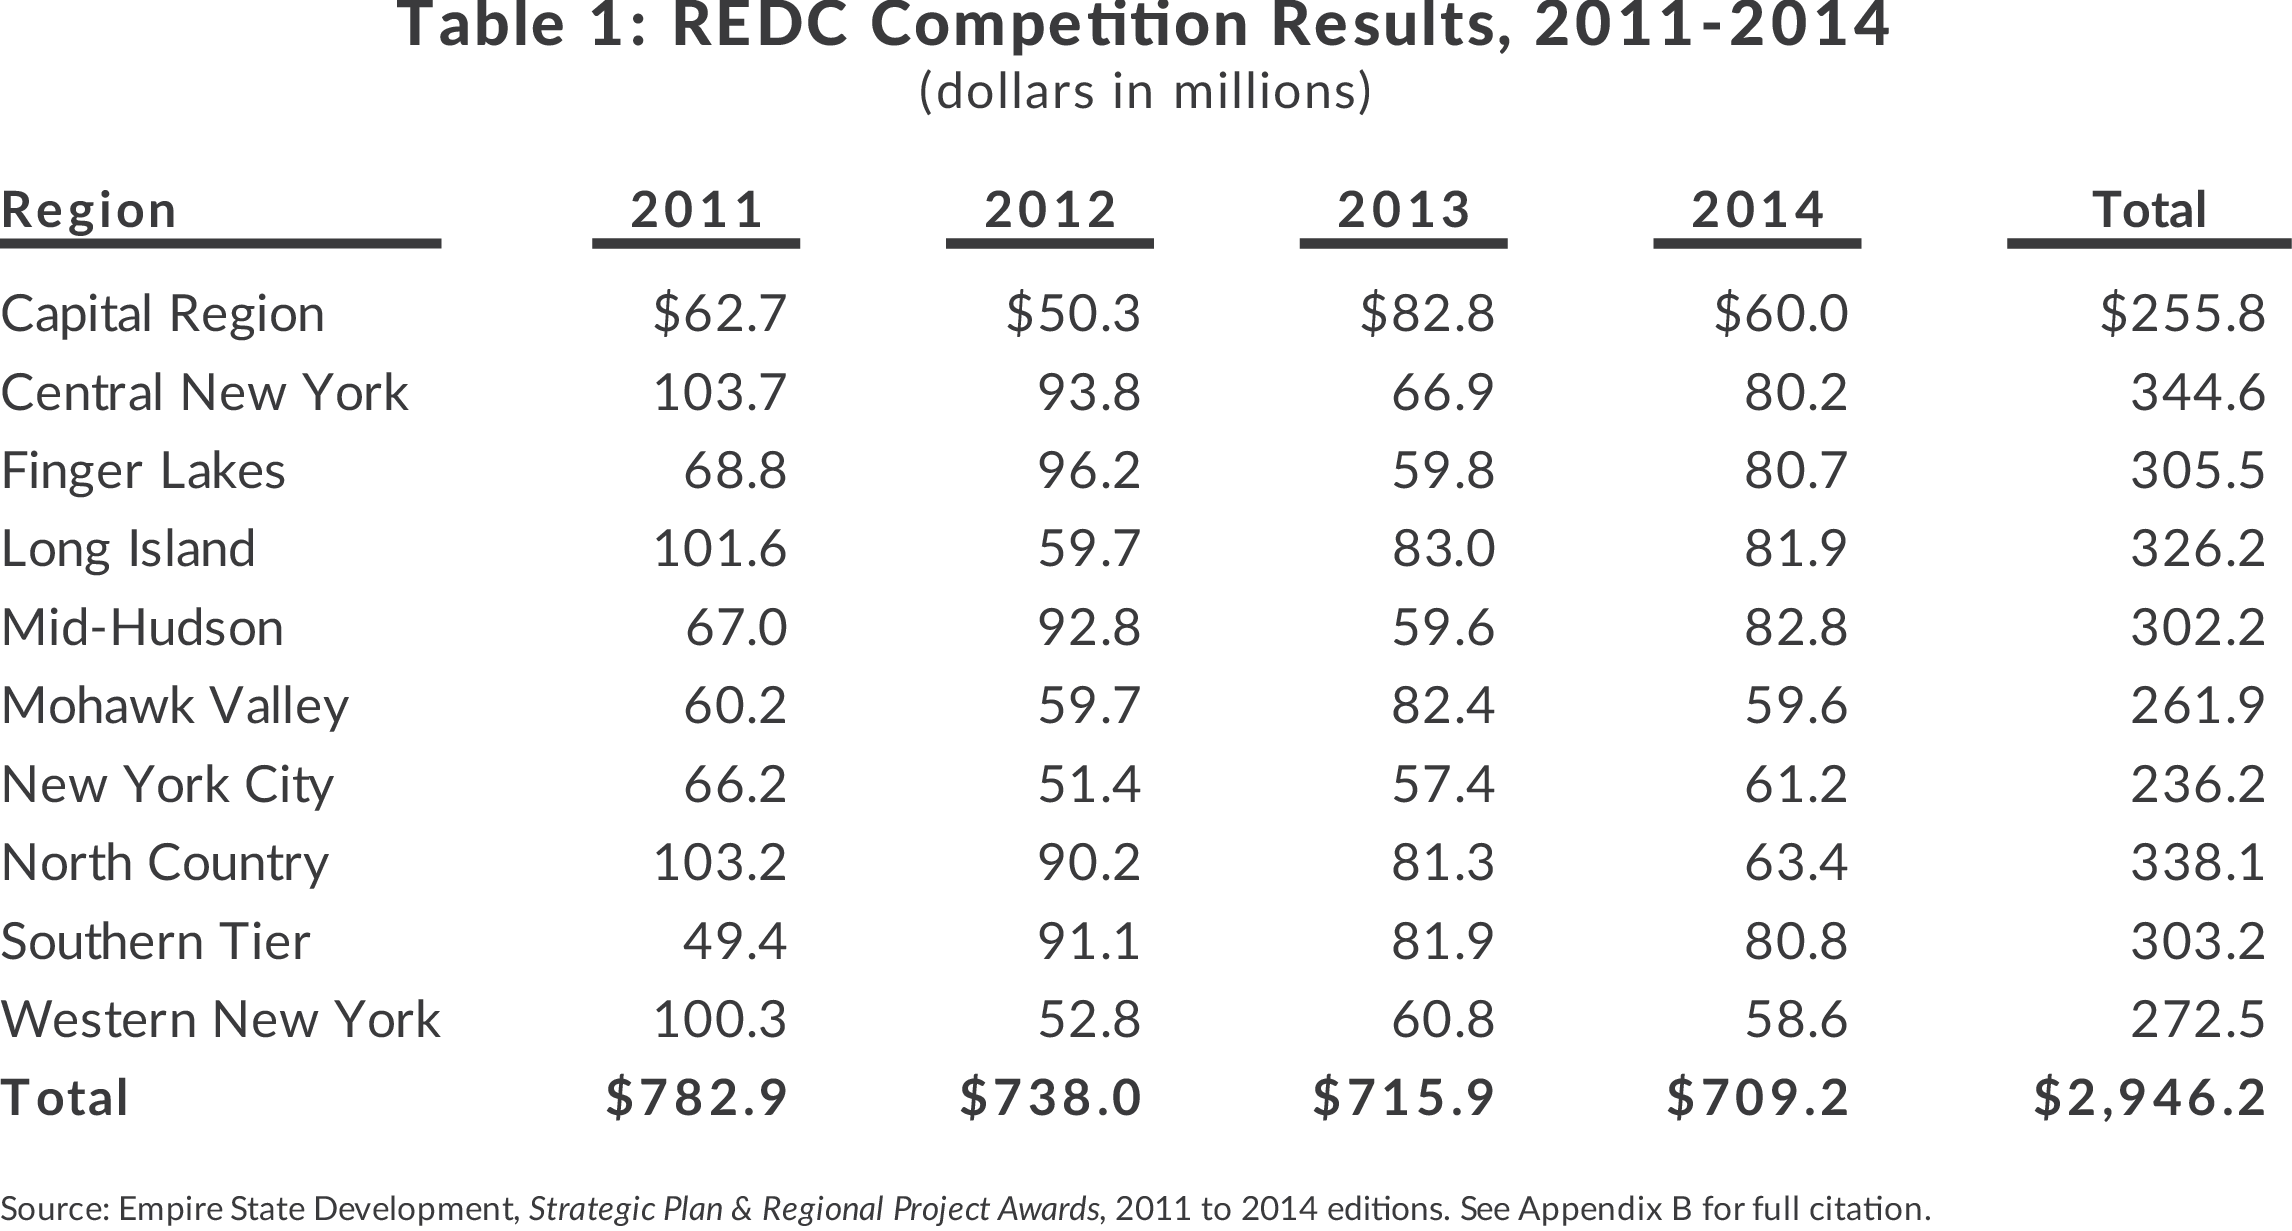
In support of its regional economic development strategies, the State has committed nearly $3 billion to projects reviewed by REDCs, including more than $1 billion from ESD, $1.1 billion through industrial development bonds, and another $700 million from other state agencies, through 2014. In addition to the competitive awards shown by region in Table 1, a fifth round of awards totaling $750 million will be announced at the end of 2015. The REDCs will also play an advisory role in the allocation of $1.5 billion to be distributed to three upstate regions based on the competition entitled the “Upstate Revitalization Initiative.”
The primary purpose of REDCs is to serve as strategic planning units for coordinating State economic development funding in order to encourage regional economic growth. Funding is made available by a number of state agencies with the REDCs coordinating the application, award, and monitoring process. REDCs are made up of stakeholders in business, higher education, nonprofits, and labor, plus representatives from local, county, and state governments.1
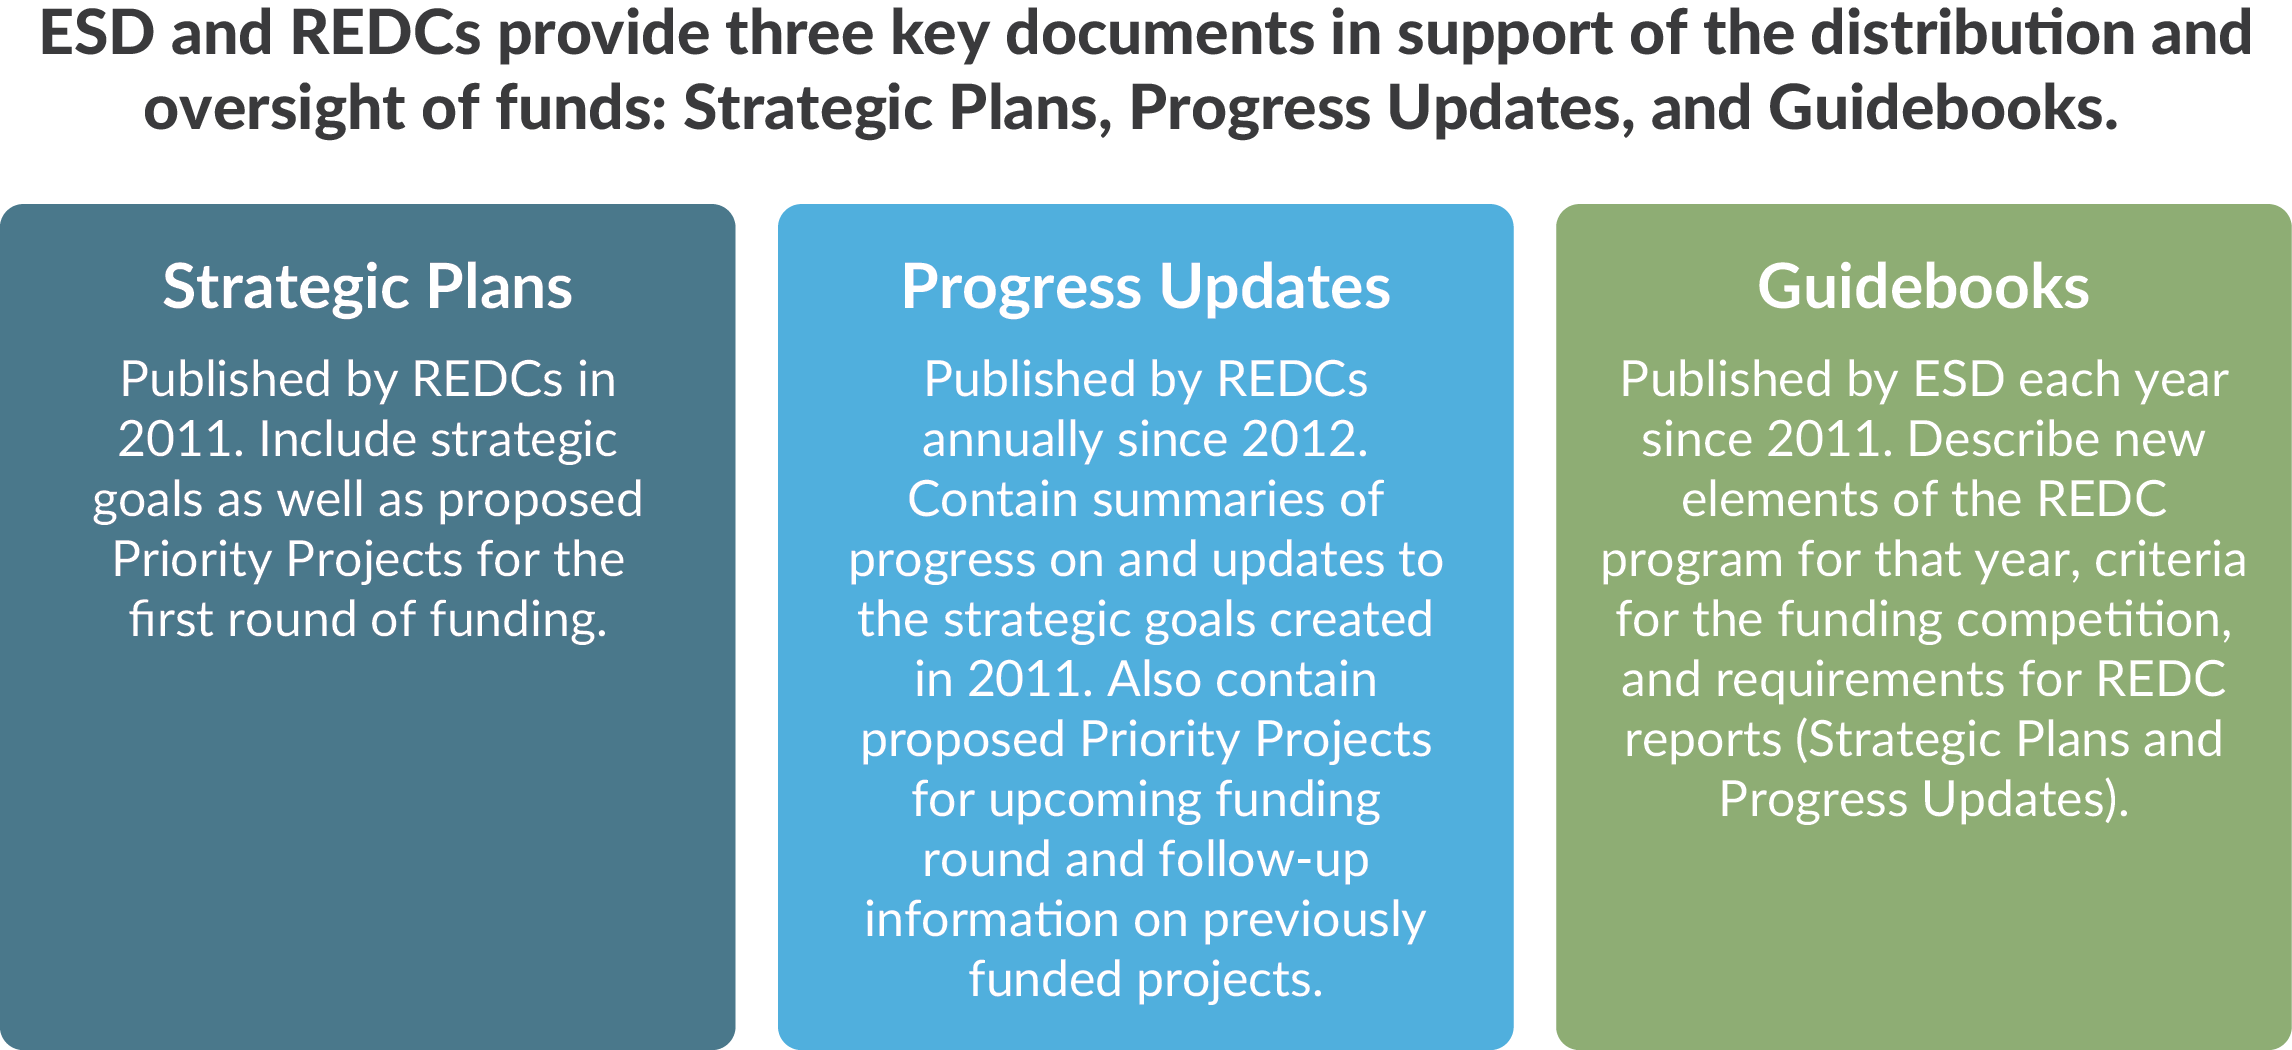
During the first round of funding, REDCs created five-year “Strategic Plans” to establish priorities and guide investment based on strategic goals. Once the regional strategy is set, projects are selected annually for each round of funding; successive rounds are meant to be guided by the original strategy. The process requires monitoring progress on each project as well as assessing project outcomes against their original goals. (See box.)
After funds are awarded, approved projects are monitored and evaluated. Annual “Progress Updates” summarize monitoring and evaluation data, provide information on the status and performance of projects, and update regional metrics. These reports are the centerpiece of the competition, meant to determine the size of each region’s funding award from ESD.2 In order to continue monitoring and evaluation of performance, progress updates are created in accordance with ESD’s annual “Guidebook,” which lays out the format and requirements for that year’s reports. These annual Guidebooks outline new criteria for that year’s funding competition and performance reporting requirements to provide “clear metrics to measure progress and success.”3 REDCs select their own performance metrics, to be measured and reported in the subsequent progress updates.
The REDC Award Process
Awards are made based on a five-step process. (See Figure 1.) The process provides a streamlined method for applying, scoring, and determining awards granted by appropriate agency commissioners.
Businesses, nonprofits, and local governments submit applications through the Consolidated Funding Application (CFA), a single application portal for grants from 10 participating state agencies, including ESD, New York State Energy Research and Development Authority, and Homes and Community Renewal, among others.4 Applicants that receive funding can apply for additional funding in later rounds, and several large projects have received multiple CFA awards for successive project phases over the first four years of the program.
Once CFAs are submitted, they are scored by both the relevant REDC and state agency. The REDC’s score is worth 20 percent of the total score and top projects are labeled “Priority Projects.” The remaining 80 percent is determined by the state agency (or agencies) from which the project is requesting funding. Agencies give a technical score based on whether the project meets the requirements of the grant program and have final approval on which projects are funded. 5
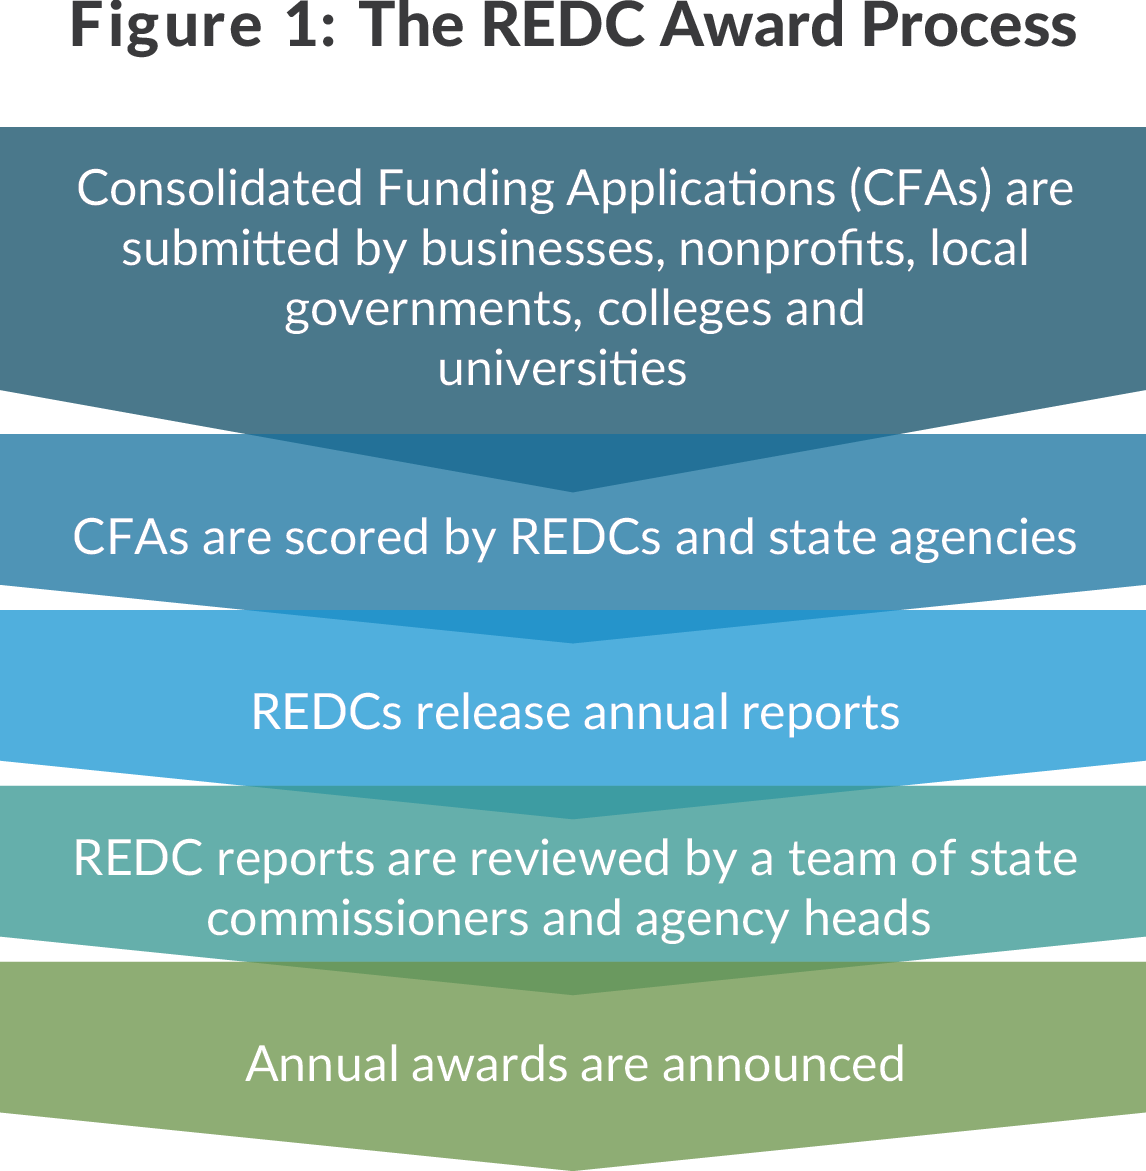
After CFAs are scored, REDCs prepare progress updates, with a detailed section on Priority Projects and a list of other, non-priority projects the REDC endorses. Out of a total of 3,323 projects which have been awarded funding since the initiative’s inception, 2,000 have been considered Priority Projects subject to these ongoing reporting requirements. Progress updates are submitted for evaluation to the “Strategic Implementation Review Team,” a group of state agency heads and commissioners. These reports are considered based on Guidebook criteria; the 2014 competition, for example, focused on “1) Implementation of regional strategic economic development plans; 2) Performance in encouraging economic growth through job creation and investment; and 3) Identification of global marketing and export strategies.”6
The outcome of this competition determines the size of ESD’s award to each region, consisting of both capital grants and Excelsior tax credits. Regions chosen as winners in each round receive the largest total ESD awards, but every region receives substantial ESD funding. The remainder of funding comes from private activity bonds and state agencies participating in the CFA and is distributed based on the agency’s technical scoring of project applications.
Analysis of REDC Reporting
Monitoring performance is a key step for strategic planning. Identifying indicators for goal setting, collecting data on metrics, and reporting performance over time are required to manage funds effectively. There are two levels of performance metrics on which to evaluate the REDC process: regional economic indicators to assess progress and where development funds are most needed; and project-level metrics to determine how well the funded projects perform against their specific goals. There should be a feedback loop so that project-level performance influences the extent of later rounds of funding.
Reporting at both the regional level and the project level varies widely in quality and consistency.
Regional Metrics Are Inconsistent and Unstandardized
In 2011 the REDC Guidebook stated ESD would publish an annual report on the REDC program, including “a set of standard economic and demographic elements that will be measured and benchmarked across all regions.”7 In the four years since the beginning of the program, this report has not been published. Instead, REDCs report on their own regional performance.
The Guidebook requires REDCs to develop metrics linked to their strategies to “monitor and evaluate the effectiveness of the strategic plan.”8 For example, the Capital REDC reported in its strategic plan that it would measure the number of working farms, the number of wire service stories about the region with a business tagline, and cargo tonnage at the Port of Albany, along with 52 other proposed metrics.9 In contrast, the Long Island REDC reported it would measure progress creating freight rail hubs, workers trained in green energy technologies, and placement of STEM graduates in STEM disciplines, along with 15 other proposed metrics.10
Although regional metrics are not uniform, there is some overlap in categories measured. Common categories measured were wages, business creation, and employment indicators. Still, an analysis of the metrics chosen by the ten REDCs in the first four rounds found that not one metric was chosen by all 10 REDCs—not even general measures of the regional economy such as unemployment or poverty rate.11 Decentralization of performance metrics is intended to allow for the variety of needs and objectives among the regions but the absence of a set of basic common metrics has resulted in fragmented, changing, and non-standardized metrics, making it difficult to compare regional progress over time.
In addition, many selected regional metrics had data collection or measurement flaws. Several REDCs chose too many metrics to reasonably measure: three listed more than 30 metrics in their strategic plans. Some of the metrics chosen are difficult to measure, such as the number of STEM graduates, or relied on data not available on an annual basis, such as regional “business friendliness” rankings or data with reporting lags.
Specific regional examples show differences in reporting among REDCs. The Finger Lakes REDC had the highest share of its initial metrics from 2011 also reported in the 2014 progress update. In contrast, the Capital Region REDC proposed 38 metrics in 2011 but only 4 of these were reported in the 2014 progress update. (See sidebar for examples of performance reporting.)
Project-level Reporting Suffers from Insufficient Requirements and Lack of Follow-up
Project-based reporting is even more important to properly gauge performance. Improvement across an entire region is a very slow process and even this level of funding can only make small changes to a regional economy. Measuring and reporting on project performance, however, is a basic requirement for evaluating whether projects are effective in creating or retaining jobs and triggering investment.
Project data is provided in two places: the CFA “Data Table” managed by ESD, and individual REDC Progress Updates. The Data Table provides a centralized location for project information, but captures only basic information such as project and applicant names, agency, region, and award amount. This data is insufficient for measuring performance.
In many cases, REDCs’ progress updates provide more comprehensive data than what is offered in the Data Table. Unfortunately, data presented in REDC reports is also insufficient for measuring performance. As was the case with regional indicator reporting, ESD guidebooks did not initially require standardized reporting of project performance indicators. The 2014 Guidebook was the first to require total cost information, for priority projects only, and details on the sources and uses of the funds.12 ESD has required REDCs to include additional metrics in 2015.
This lack of centralized and robust project information stands in contrast to other state economic development programs. A model for more complete reporting is the Excelsior Jobs Program in which each business must commit to investment and job creation or retention goals and must submit performance metrics confirming commitments are being met. ESD publishes a quarterly report listing the businesses in the program, their performance on their commitments, and actions taken on any business that falls more than 15 percent below its commitments for that period.
Assessing Project-Level Reporting on Priority Projects
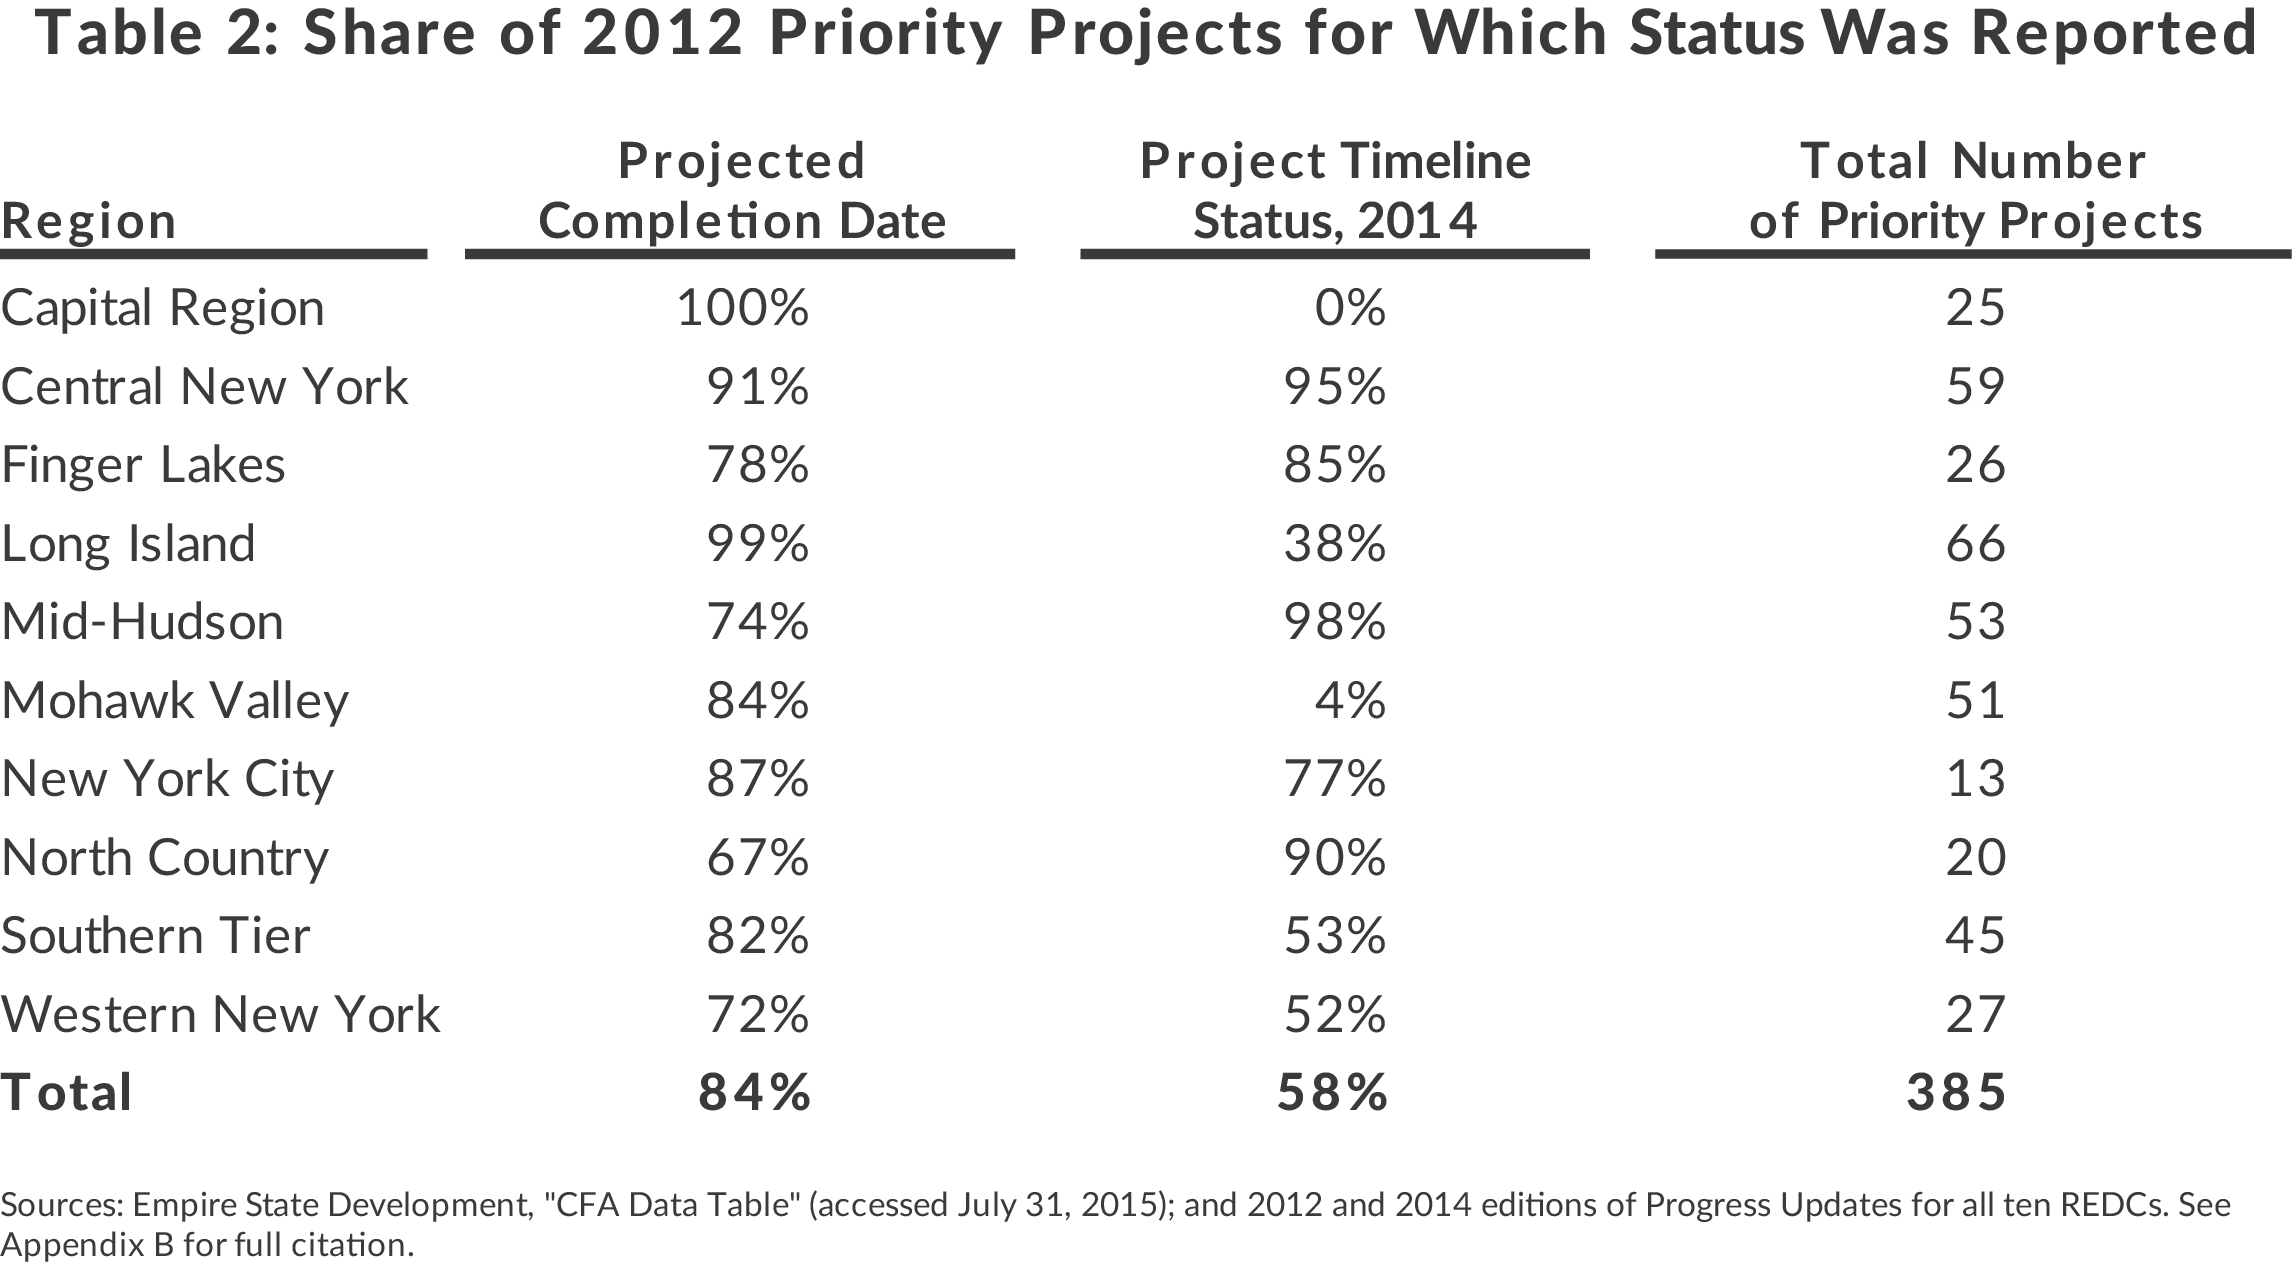
A subset consisting of all 385 Priority Projects begun in 2012 was selected for more detailed analysis. This subset allows examination of two years of follow-up data on project progress and outcomes; choosing the second year of the program provides a balance between length of time for follow-up and quality of initial reporting. The sample is limited to Priority Projects because the reports only provide detailed information on these projects.
Project timeline information was reported with the greatest frequency; anticipated completion dates were available for 84 percent of these projects, and current completion status was reported for 58 percent of projects in 2014. Individual project timeline reporting varied among REDCs; the Capital and Mohawk Valley REDCs do not report individual completion status, in contrast to Central New York and Mid-Hudson, each of which reported on more than 95 percent of projects.13 (See Table 2.)
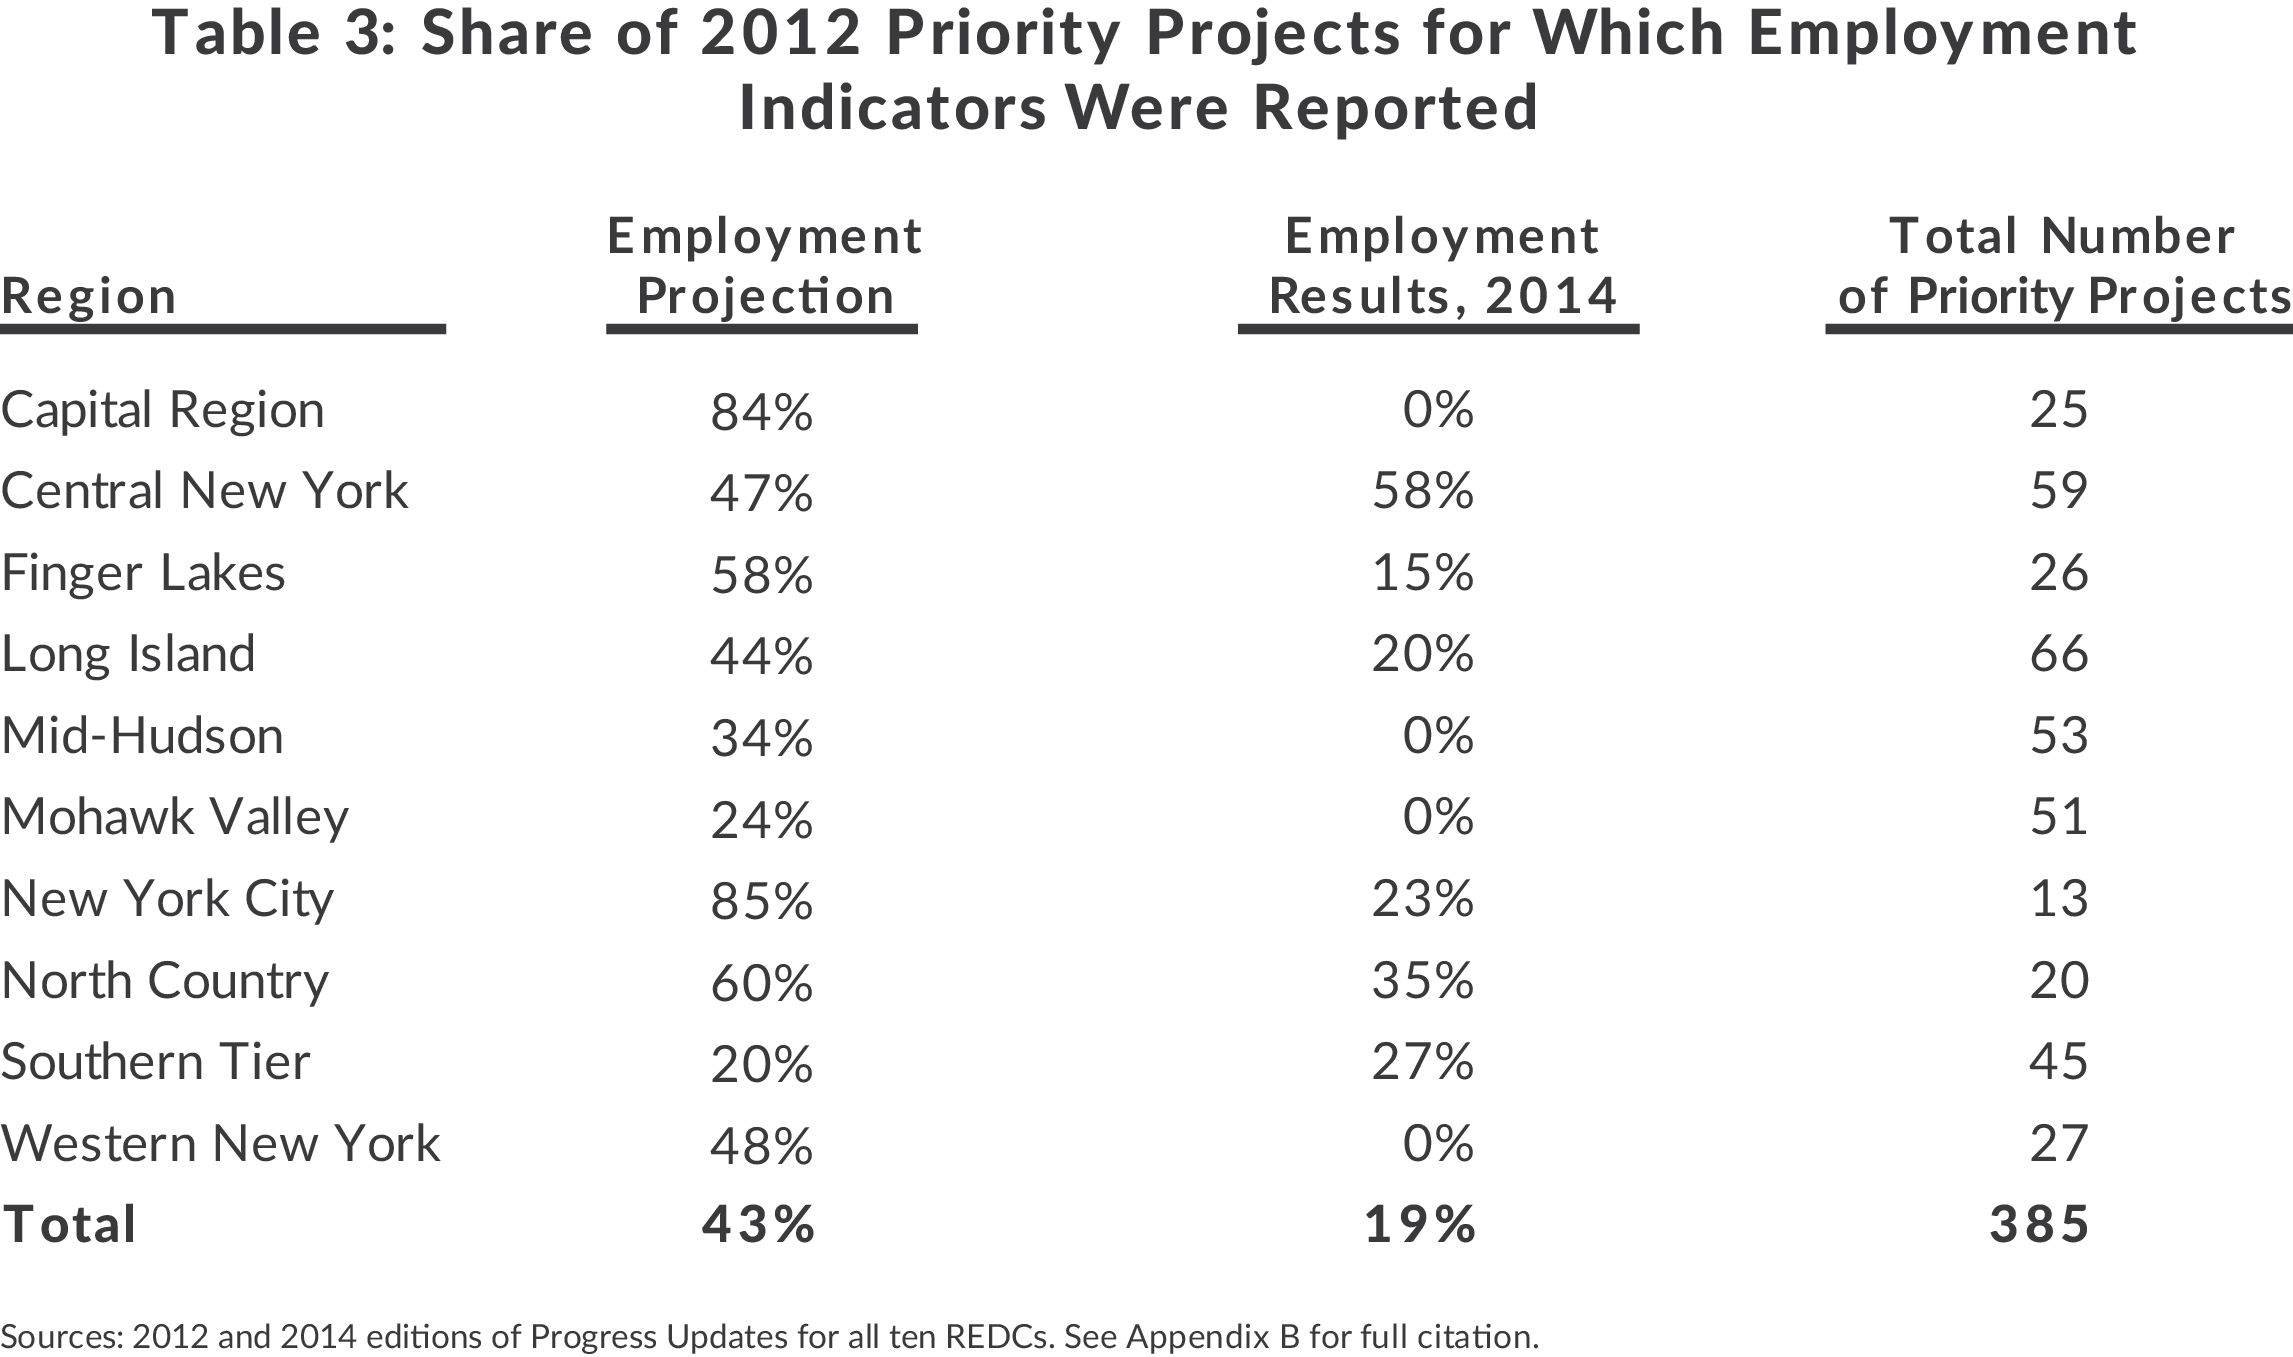
Reporting on employment projections and employment results were worse than for project timeline status. Less than half of analyzed projects reported initial job projections and only 19 percent of analyzed projects included employment results in 2014. Additionally, some of the employment projections presented did not differentiate between job projection types, such as created or retained and permanent or temporary. 14 (See Table 3.)
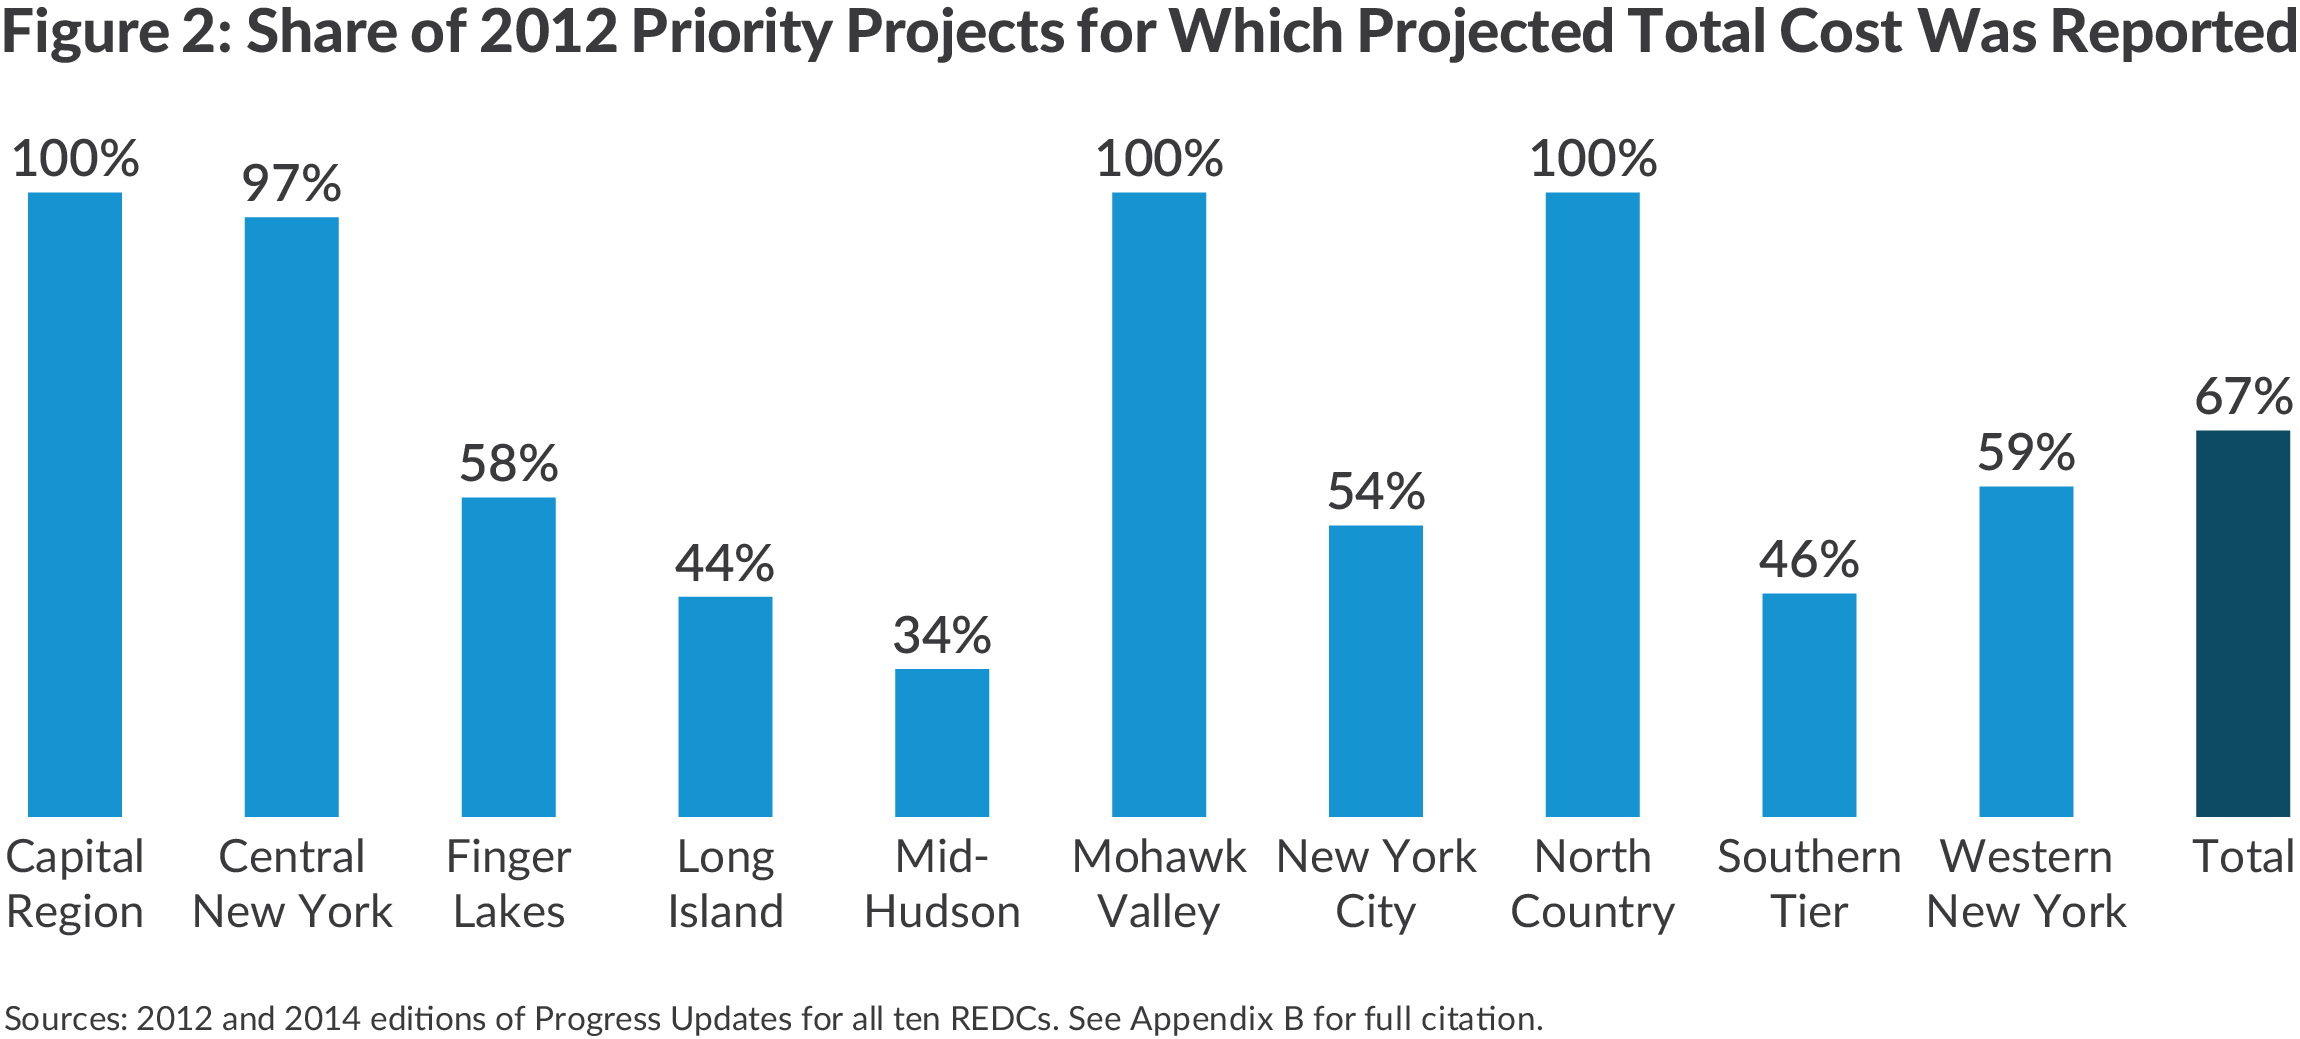
Cost and investment information is also lacking. Cost projections were reported for 67 percent of 2012 Priority Projects, but reporting by REDCs varies substantially. Although four REDCs reported project cost estimates for nearly all priority projects, three REDCs reported for fewer than half of their projects. (See Figure 2) In contrast to project timeline status and employment results, actual spending information is not reported at all, making leverage ratio calculation impossible to determine.
Assessing REDC Performance
As REDCs approach their fifth round of funding awards, with $2.25 billion to be awarded based on progress updates this year, it is important to examine progress and results so far, notwithstanding the noted limitations in reporting.15
Measuring Regional Performance
Regional measures have been emphasized in REDC guidebooks as a way to “monitor and evaluate the effectiveness of the strategic plan.”16 But three important limitations to assessing regional economic outcomes exist. First, there are many variables, such as crime, population, and schools, which can significantly affect local economic performance. Second, although $3 billion has been awarded in in the first four rounds of the REDC initiative, the award amounts are small relative to the sizes of the regional economies. Finally, many projects are still in progress, and even complete projects may lag in their effect on a regional economy.
Despite the problems relating regional economic performance to REDC funding, there are strategic benefits to regional measurement. A regional outlook helps the members of the REDCs to gauge the needs and strengths in the regional economy in order to prioritize projects, define strategies, and coordinate the various economic development bodies in the region around a single strategic plan. For example, the Western New York REDC chose advanced manufacturing as one of its key priorities and has worked to build collaborations between private business, universities, and government agencies within this industry.
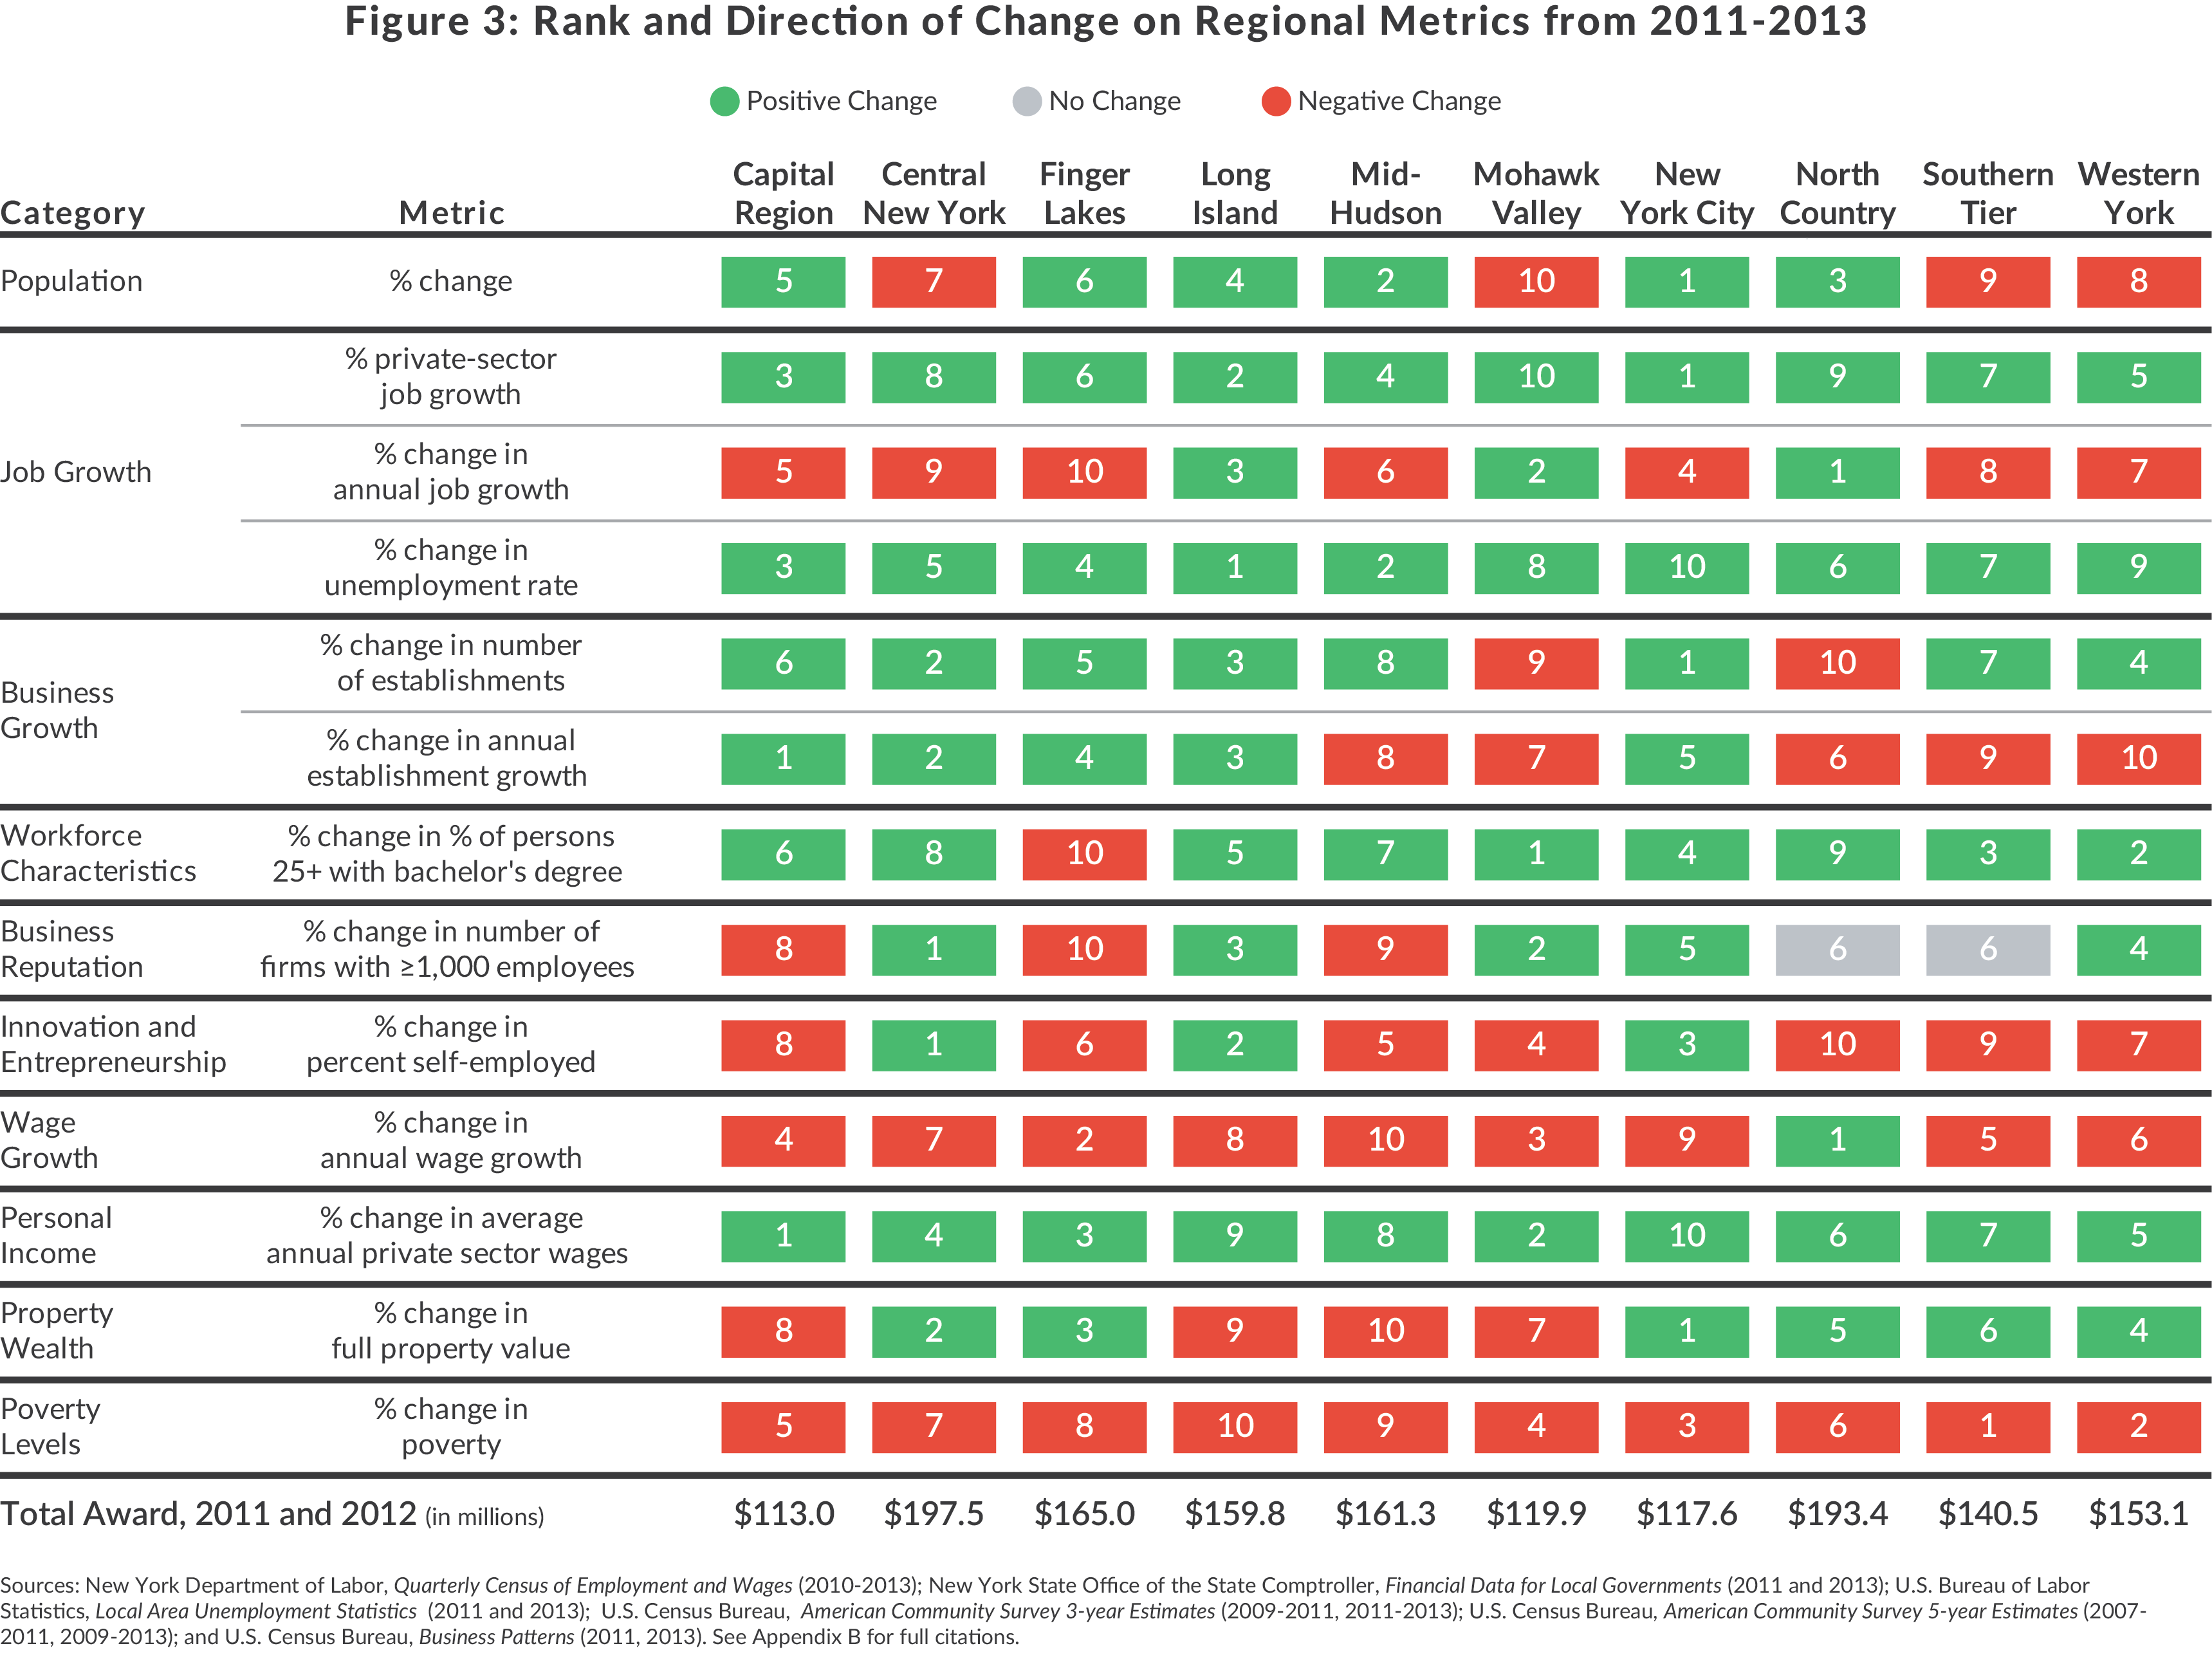
The categories measured in this analysis are population, job growth, business growth, workforce characteristics, business reputation, innovation and entrepreneurship, wage growth, personal income, property wealth, and poverty levels. The metrics, drawn from recommendations in the 2011 CBC report, Avoiding Past Mistakes: Principles for Governing Regional Economic Development Councils, were selected to include “not only the traditional output measures (e.g., jobs) but also outcome measures that reflect the economic health and growth in the regions.”17 Metrics included were specifically drawn from a list of categories ESD initially intended to provide at the initiative’s outset.18
For each metric and region, the data shows the region’s rank by two-year change, from 2011 to 2013, the most recent year for which data is available for all variables. The bottom row of Figure 3 shows the cumulative funding awarded to each region in the first two rounds. Coloring shows whether change was positive or negative. (See Appendices A and B for further detail on regional metrics in Figure 3.)
Central New York received the largest award over the first two rounds, and ranked highly on several metrics on this scorecard. North Country, which received the second-largest award over the first two rounds, ranked generally in the middle. The remaining large awards went to Long Island, which ranked in the top four on all but five of the metrics in this analysis, and the Finger Lakes, which performed generally in the middle of the group.
The smallest awards went to New York City and the Capital Region, which nonetheless performed well, and to the Mohawk Valley, which had one of the poorest-performing regional economies in the state. From this limited comparison, no clear relationship yet emerges between the amount of the award and a region’s economic performance.
Measuring Project Performance
As noted earlier, project-based indicators were poorly reported, making it difficult to analyze the value gained from the initiative’s spending. In order to assess project performance, a minimum of four types of information should be reported for each project.
- Project Timeline: Projected start date, end date, and current completion status.
- Employment Projections: Initial employment, projected employment growth, and projected employment retention, by type of employment (temporary/permanent, direct/indirect).
- Employment Results: Current employment, including measures for jobs created and retained compared to initial baseline employment, by type of employment.
- Cost and Investment: Total projected and actual project costs, broken out by public and private investment.
This analysis assesses project performance using the subset of 385 Priority Projects from 2012.
Timeline
Of the 385 priority projects in 2012, nearly half (42 percent) did not report completion status in their 2014 progress updates. (See Table 4.) The most common reported status was “underway,” for about 38 percent of projects. Only 9 percent of projects were “completed.” It is worth reiterating that this data is only available for priority projects; non-priority projects did not report on their project timelines.
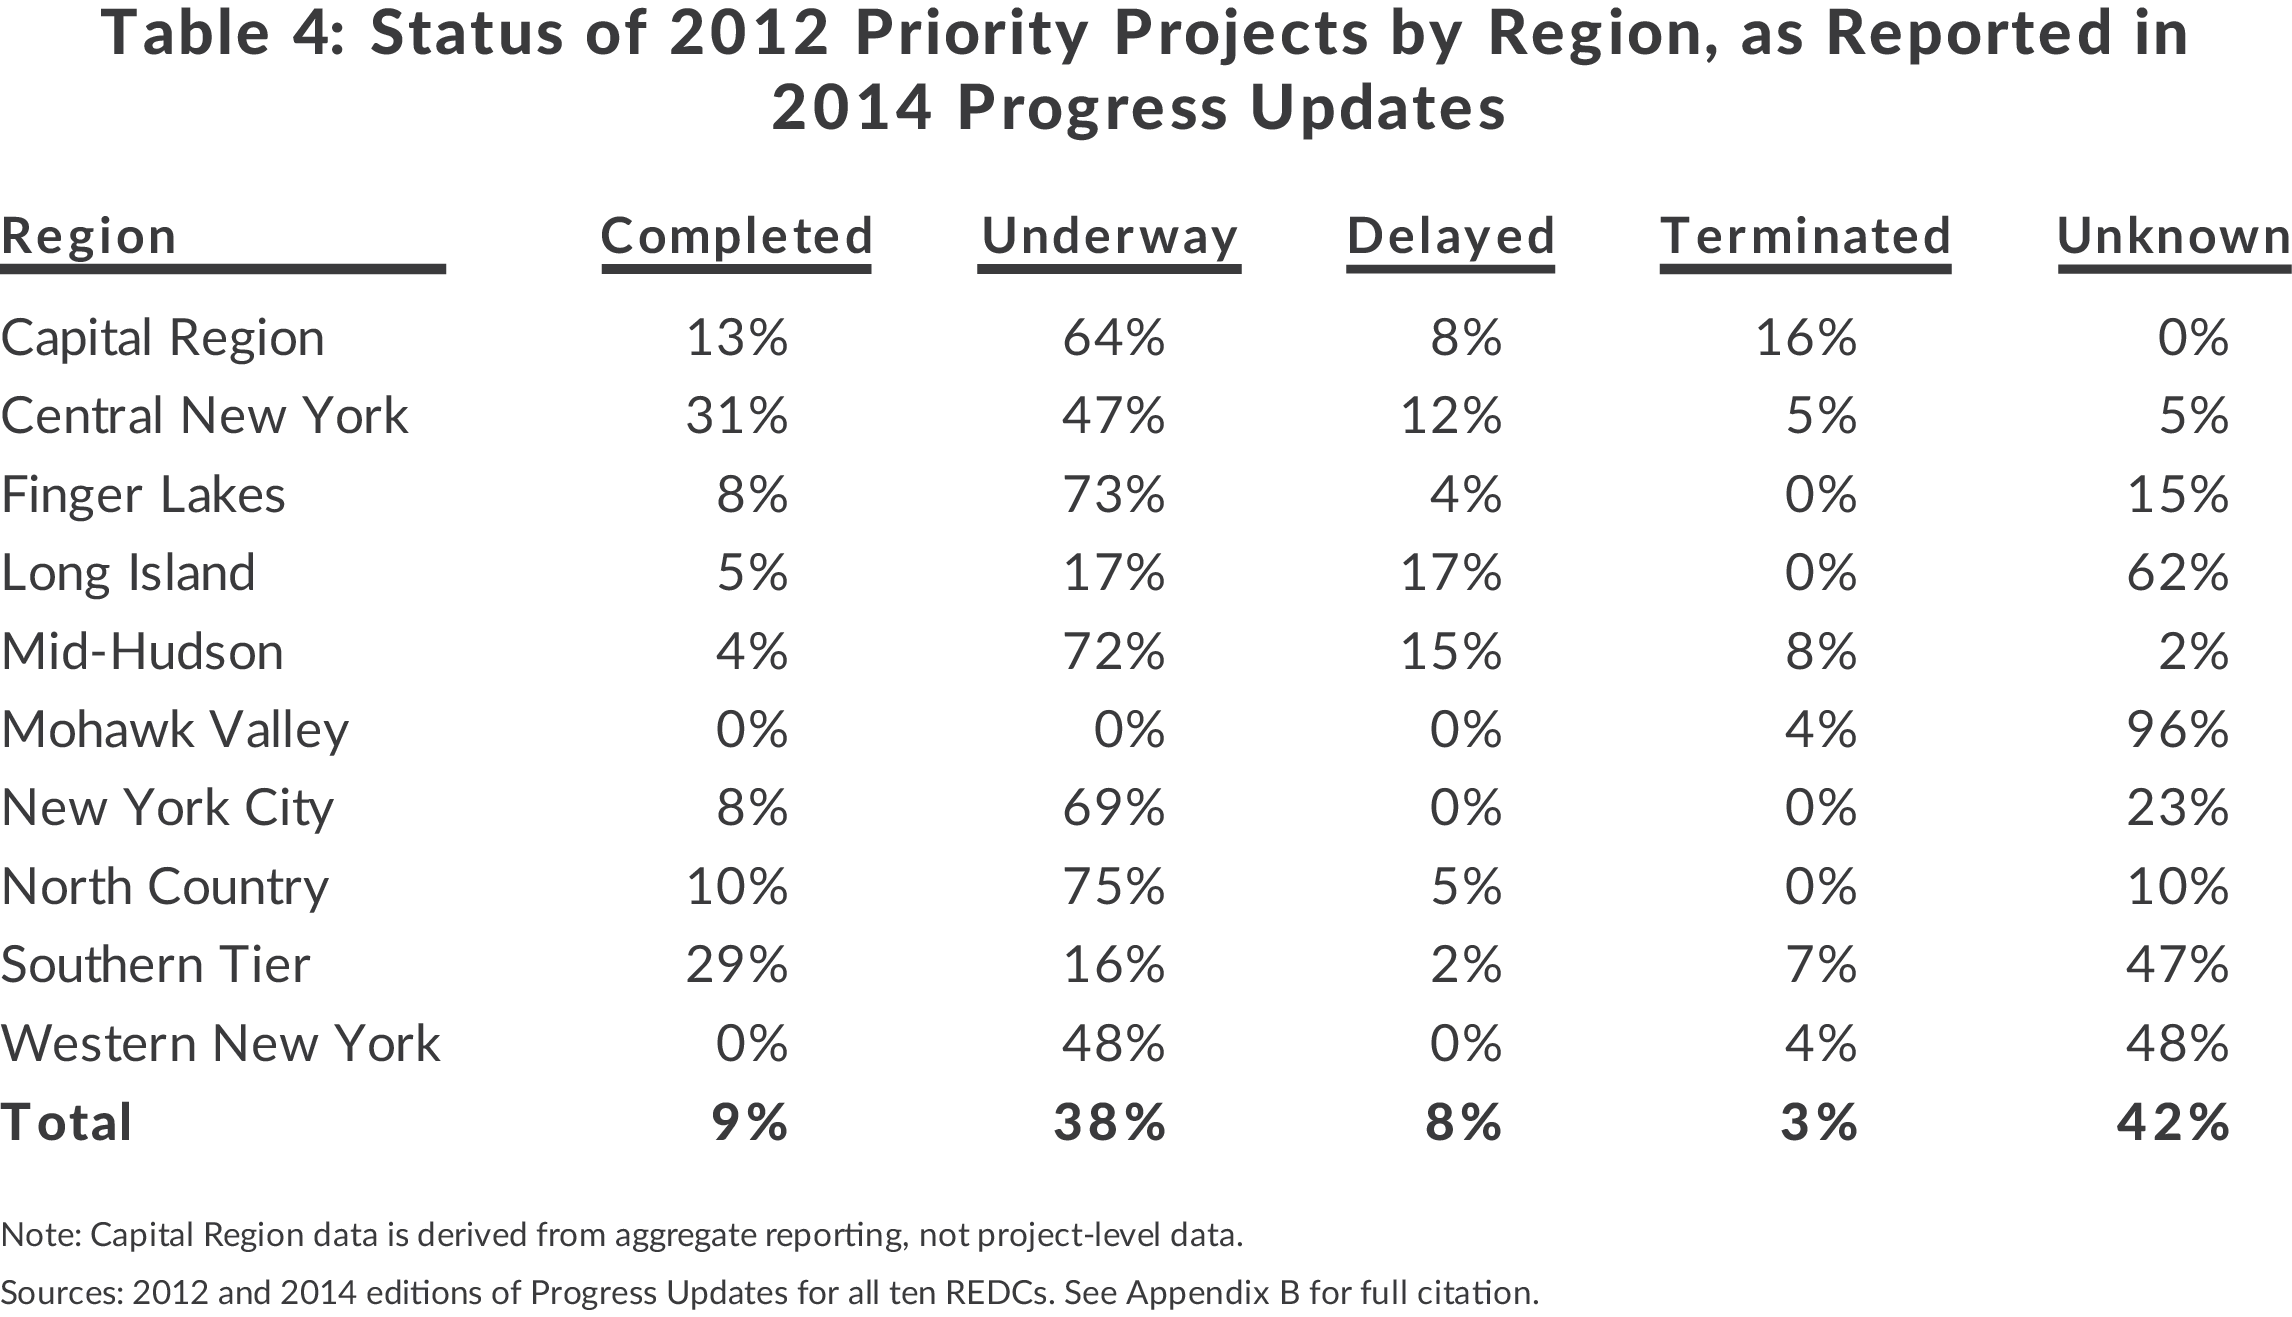
Of those REDCs with higher rates of reporting, the North Country and Finger Lakes performed well based on project timeline; at least 8 out of every 10 projects were completed or underway. More than half of the projects in Long Island, the Southern Tier, and Western New York had an unknown, delayed, or terminated status. 19
Employment Results: Job Creation and Job Retention
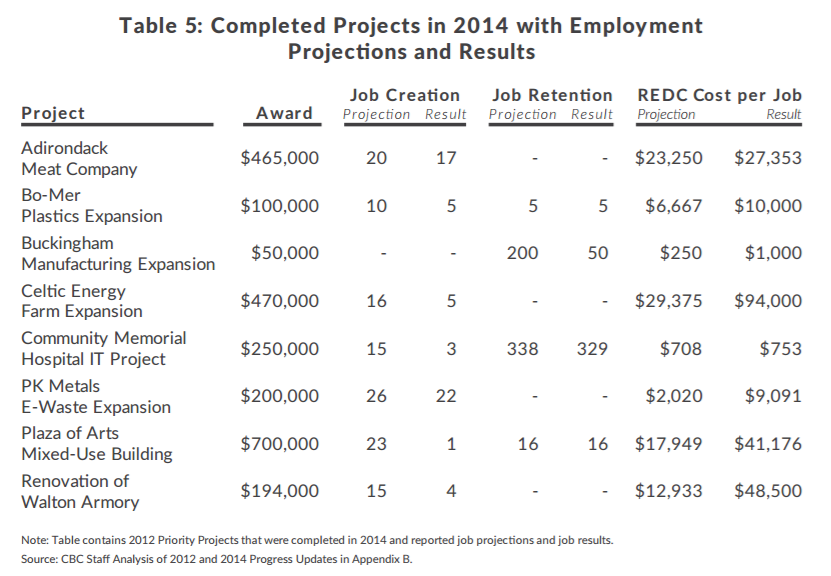
The pursuit of employment opportunities is one of the stated goals of the REDC initiative, yet only 7 percent of sampled projects reported both job creation projections and actuals. Reporting for job retention was even worse; only 3 percent of all projects reported initial employment and actual retention results. Making the analysis more difficult, only 8 of 385 projects in the database were complete in 2014 and reported on employment indicators. The findings on these eight projects were not encouraging; none of the projects achieved their job creation targets and only 60 percent reached their retention targets. These results highlight the importance of comparing actuals to projections to assess performance and how the lack of reporting makes it difficult to decide where funds are being used effectively. Most of the jobs created cost tens of thousands of dollars per job: Based on initial projections, the public subsidy per job varied widely, from $753 per job to $94,000 per job.20 (See Table 5.) No rationale for the differences in the cost per job – based on industry or wages – is provided.
Cost and Investment
As noted earlier, REDCs are not required to report actual cost information for individual projects. The leverage ratio, gauging the amount REDCs are able to leverage in private investment through access to public investment, is another measure of cost effectiveness. Using initial projections, projected leverage in some regions is 10 times higher than others. This analysis only uses projections of private funding, however; it is not clear what the actual funding was and therefore the leverage ratio is unknown.
Sunlight Ahead? Changes to Reporting in 2015
The most recent guidebook published by ESD in 2015 includes more robust requirements for reporting than in the past, which suggests that ESD recognizes the past level reporting was insufficient. The new guidebook is a positive step towards better transparency and reporting at the regional level, but is still limited in providing project-level detail for performance analysis. This section covers some of the changes that address issues outlined in this analysis and where to make improvements.
Changes to Regional Performance Reporting
For the first time, the 2015 guidebook requires REDCs to provide a standardized list of general economic indicators and quality of life indicators. REDCs generally followed new requirements for regional reporting in their 2015 Progress Updates, with most reporting 75 percent or more of the indicators required.
The newly required regional indicators cover many of the categories in the 2011 Guidebook and analyzed in this report, including: employment and unemployment, business growth, poverty levels, and wage growth. Most REDCs now provide data from past years as well as the present to illustrate trends and allow for comparison. The New York City, Central New York, and North Country REDCs do a particularly thorough job of reporting on indicators over time.
Changes to Project Reporting
The 2015 Guidebook also improves project-level reporting on timeline, employment projections, and projected cost, but leaves room for improvement because it does not include results on actual job creation and project cost. Information on individual non-priority projects is still lacking; the few reporting requirements are only for aggregate data. (See Table 6.)
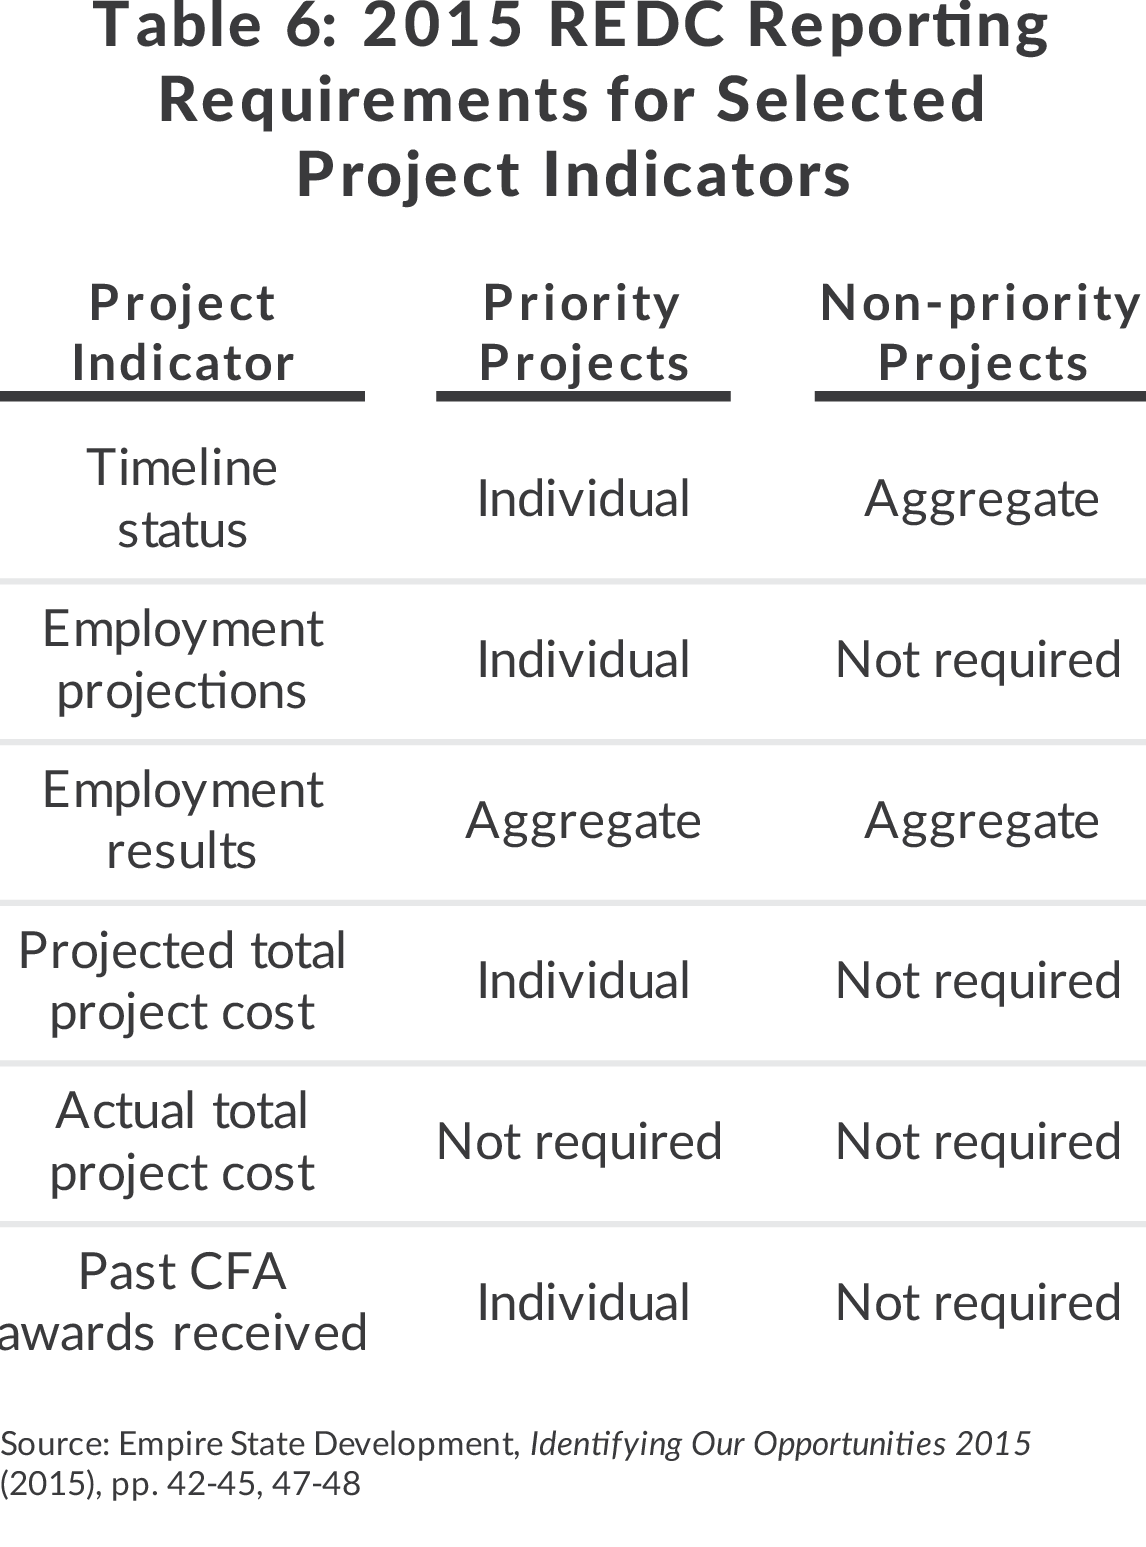
Project timeline status will now be standardized and comprehensively reported for priority projects; non-priority projects that are delayed, terminated, or have concerns are also required to be listed individually with the reason(s) for the problem.
For priority projects, employment projections are now required for direct and permanent jobs created, indirect and construction jobs created, and, where applicable, jobs retained. Employment projections are not required for individual non-priority projects, but REDCs are now required to provide an aggregate employment projection for non-priority projects in a given year.
Despite better data on employment projections for priority projects, actual employment results are not required to be reported on an individual basis. This omission makes it impossible to assess individual project performance on job creation and retention, which are generally the most important goals for economic development projects. Non-priority projects continue to have no reporting requirement at all for individual employment results.
Project cost and investment information was also enhanced in the most recent Guidebook. The new guidebook still requires priority projects to include projected costs, but not actual costs. Since neither priority nor non-priority projects are required to report actual project investment, the calculation of actual leverage ratios and cost per job figures remains impossible. Finally, the guidebook requires that REDCs indicate any past CFA funding received by the priority projects proposed, which will help to capture the full scope of the state’s investment.
Actual project reporting in 2015
In general 2015 REDC progress updates followed the 2015 Guidebook’s requirements for project-level reporting as specified, whether in aggregate or for individual projects.
The 2015 Guidebook represents a step back for reporting of employment results in some REDCs. In 2014, seven REDCs reported job creation and/or retention results for at least a portion of their individual projects. In 2015 Central New York and the Southern Tier were the only REDCs to continue doing so. All others aggregated employment results in a summary table, with no data on individual projects.
In some cases, reporting fell short of the level of detail required by the Guidebook. For example, some REDCs combined projections for job retention and job creation into a single number. Project timeline reporting did not improve significantly, despite the new standardized system and requirement for reporting status of individual Priority Projects. Reporting of the sources and uses of project funds also fell below the requirement. It remains to be seen how non-compliance with Guidebook requirements will affect funding for regional awardees.
Findings and Recommendations
As the State continues to use the REDC model, incorporating it into the process this year of distributing $1.5 billion in “Upstate Revitalization” funds, it is important to consider how effectively the past five years of funding have been deployed. This analysis has identified issues with reporting, and therefore measuring, actual performance of funded projects.
Without proper reporting for monitoring and feedback on the use of funds, little is known about which projects and REDCs are undertaking effective strategies for supporting job creation and investment. A subset of completed projects that did provide sufficient information suggests a weak link between performance and funding and high costs per job created or retained. Better monitoring and performance evaluation is both necessary for analyzing the use of limited state resources for economic development and assessing which projects are successful in leveraging private funds.
ESD’s recent overhaul of the 2015 Guidebook, requiring comprehensive and standardized reporting of performance indicators, is a good step forward. New criteria also suggest REDC’s ability to measure and manage projects for performance may play more of a role in allocating funding than in the past. In particular, the development of regional metrics to measure success, impact on job creation and retention, and advancement and completion of prior round priority projects, have been identified as criteria for funding awards this year.21
Despite these advancements, the new reporting requirements fall short in two major ways: job results are reported in aggregate, not by individual project, and many reporting requirements do not apply at all to the hundreds of projects which are not designated as “priority.” Reporting job results in aggregate does not allow for tracking how individual projects are performing relative to their projections. In addition, actual project-level information on total costs, jobs created, and jobs retained for all projects should be collected and published annually.
Finally, ESD should collect more information for its centralized CFA Data Table to allow for comparisons across year of award, industry sectors, state agencies, and project types (public or private). Doing so would allow the agency and local regional leaders to assess performance based on a variety of project features. Findings on the features of successful and unsuccessful projects will provide valuable feedback to REDCs and guide ESD in selecting projects more likely to create and retain jobs or spur investment.
The REDC initiative was created to better plan economic development funding through a merit-based approach. This model requires a demonstration of how effectively past funds have been used to justify continued investment in this approach The recommendations here will ensure REDCs are able to carry out their mission of encouraging economic growth in a measurable, cost-effective manner.
Download Appendices
Regional Economic PerformanceFootnotes
- Empire State Development, Open for Business: a New State Government Approach to Economic Growth (2011), http://regionalcouncils.ny.gov/assets/documents/ResourceGuidebook.pdf.
- While ESD funding is determined by this competition, funding from other agencies is determined solely on the basis of scores given to each application by the REDC and by the funding agency.
- Empire State Development, Open for Business: A New State Government Approach to Economic Growth (2011), p. 23, http://regionalcouncils.ny.gov/assets/documents/ResourceGuidebook.pdf.
- Other participating agencies are: New York State Department of Agriculture & Markets; New York State Council on the Arts; New York State Canals Corporation; New York State Department of Environmental Conservation; New York State Department of State; New York State Department of Labor; New York State Environmental Facilities Corporation; and New York State Parks, Recreation & Historic Preservation.
- Empire State Development, 2015 Application Manual (2015), p. 25, www.ny.gov/sites/ny.gov/files/atoms/files/2015_CFA_Application_ManualFINAL.pdf.
- Empire State Development, Regional Partners, Global Success (2014), p. 30, http://regionalcouncils.ny.gov/assets/documents/REDC_2014_Guidebook.pdf.
- Empire State Development, Open for Business: A New State Government Approach to Economic Growth (2011), p. 21, regionalcouncils.ny.gov/assets/documents/ResourceGuidebook.pdf.
- Empire State Development, Open for Business: A New State Government Approach to Economic Growth (2011), p. 32, regionalcouncils.ny.gov/assets/documents/ResourceGuidebook.pdf.
- Capital Region Regional Economic Development Council, Success Today Opportunity Tomorrow (November 14, 2011), pp. 65-67, http://regionalcouncils.ny.gov/themes/nyopenrc/rc-files/capitalregion/CREDCStrategicPlan2011_onlineversion.pdf.
- Long Island Regional Economic Development Council, A New Beginning for Nassau and Suffolk Counties (November 14, 2011), p. 74, http://regionalcouncils.ny.gov/themes/nyopenrc/rc-files/longisland/LongIslandsFutureEconomy.pdf.
- CBC staff analysis of 2011 REDC Strategic Plans. See Appendix B for full citations.
- Empire State Development, Regional Partners, Global Success (2014), p. 37, http://regionalcouncils.ny.gov/assets/documents/REDC_2014_Guidebook.pdf.
- The Mohawk Valley REDC reported individually only on the 4 percent of its 2012 Priority Projects which were terminated.
- All data on reporting of job projections and results includes only nonzero projections and results, because it was generally difficult to distinguish between meaningful zeros and placeholders.
- Empire State Development, New York Upstate Revitalization Initiative: Competition Guidelines (April 2015), p. 2, www.ny.gov/sites/ny.gov/files/atoms/files/2015UpstateRevitalizationInitiative_FINAL1.pdf.
- Empire State Development, Regional Economic Development Council Strategic Planning Manual (2011), p. 23, http://regionalcouncils.ny.gov/assets/documents/RC_MANUAL_FINAL.pdf.
- Citizens Budget Commission, Avoiding Past Mistakes: Principles for Governing Regional Economic Development Councils (2011), p. 6, www.cbcny.org/sites/default/files/REPORT_RegionalCouncils_09132011.pdf.
- Citizens Budget Commission, Avoiding Past Mistakes: Principles for Governing Regional Economic Development Councils (2011), p. 6, www.cbcny.org/sites/default/files/REPORT_RegionalCouncils_09132011.pdf; and Empire State Development, Open for Business: A New State Government Approach to Economic Growth (2011), p. 21, http://regionalcouncils.ny.gov/assets/documents/ResourceGuidebook.pdf.
- The Capital Region and Mohawk Valley REDCs reported project status data in aggregate in 2014, so individual project status is unknown. In Table 9, Capital REDC project status data comes from the data that the REDC reported in aggregate. The Mohawk Valley REDC did not separate project status reporting by round, and only reported individually on projects that had been terminated.
- This calculation does not take into account the other intended impacts of the funding, beyond job creation and retention, as well as giving equal weight to new and retained jobs. It does not reflect true cost per unit, but it is all that is possible with the limited data reported. In comparison, in ESD’s Excelsior Jobs Program, the average value of credits issued per net job created from 2012-2014 was $2,455.
- David Copeland and Rahul Jain, “Learning from Past Mistakes: Examining Changes to the Excelsior Jobs Program,” Citizens Budget Commission Blog (October 21, 2015), www.cbcny.org/cbc-blogs/blogs/learning-past-mistakes-examining-changes-excelsior-jobs-program#11.
- Regional Economic Development Councils, Identifying Our Opportunities 2015 (2015), pp. 35-36,
- www.ny.gov/sites/ny.gov/files/atoms/files/REDC_Guidebook_9-10-15.pdf.