A Better Foundation Aid Formula
Funding Sound Basic Education with Only Modest Added Cost
In the current school year New York State is providing more than $24 billion in aid to local school districts; yet many advocates and public officials claim this spending is insufficient and are calling on the State to add $3.8 billion next year. These calls focus on increasing funding distributed through the Foundation Aid program, which supplements local funding for school districts to help provide sufficient resources for an adequate education. The Foundation Aid program’s distribution formula, however, includes features that provide excessive resources to some districts while shortchanging others. First implemented in 2007, the formula now relies on outdated data and includes numerous adjustments that result in district allocations straying far from the basic goal of enabling all districts, regardless of local wealth and property tax resources, to provide their students with a sound education.
Far less than $3.8 billion is needed to provide all districts with the school aid they need. Adding billions to an aid program with a flawed distribution formula is an extremely costly way to avoid the political challenge of reallocating funding from districts that already spend a great deal on their schools to those that need state aid to spend enough. Moreover, spending so much to accommodate the demands of wealthy districts may prove fiscally unsustainable in the face of potentially increasing State budget gaps.
It is time to reform the Foundation Aid program. Fixing the formula would redirect $2.7 billion to needy districts and require only $569 million, not $3.8 billion, more in annual State funding to support a sound basic education in all of New York’s school districts. While a reformed formula would give some districts less, or no, Foundation Aid, the consequences of a more equitable distribution mechanism demonstrate how distorted the current allocations have become and that a serious effort to rationalize them should be undertaken. This policy brief explains why the Foundation Aid formula was developed and how it works, what is wrong with it, and how to make it better.
Why Foundation Aid Was Created and How It Works
While public education is delivered primarily by local school districts, the State has ultimate responsibility for educating residents and provides financial aid to offset disparities in local property wealth and student need. In 1993 an advocacy group, the Campaign for Fiscal Equity (CFE), sued the State of New York contending New York City public schools did not provide students with a “sound basic education,” as the courts have specified is required by the State Constitution, because they did not receive sufficient funding. In 2003 the Court of Appeals ruled in CFE’s favor. State leaders subsequently adopted the State Education Budget and Reform Act of 2007 to increase school aid over four years by $7 billion annually, including $3.2 billion for New York City. As part of this legislation, 30 aid programs were consolidated into “Foundation Aid” with the goal of better targeting the money to school districts lacking sufficient financial resources.
In the year it was initiated, school year 2007-2008, Foundation Aid was $14.9 billion, or 77 percent, of $19.3 billion in state school aid.1 Since that time Foundation Aid has increased considerably, but some of the planned increases were delayed by the fiscal impact of the Great Recession of 2008. In school year 2016-2017, state school aid totals $24.3 billion, of which Foundation Aid is $16.5 billion.2
Although New York’s statewide average per pupil spending, $22,556, is the highest in the nation, the figure varies substantially among districts.3 This is primarily due to the large role of local tax support. In school year 2014-2015, New York’s schools spent a total of $62.7 billion. Local resources supplied $38.1 billion, while state aid was $22.6 billion and federal aid was $2.0 billion.4
A new lawsuit proceeding in New York State Supreme Court claims underfunding continues to deny students a sound basic education.5 Advocates argue an additional $3.8 billion in Foundation Aid is necessary to adequately fund basic education statewide. In order to analyze this contention appropriately, it is necessary to understand how the Foundation Aid formula works.
Foundation Aid was intended to be the primary vehicle for distributing school aid increases, and to do so in a progressively targeted way.6 The basic formula used to determine Foundation Aid for each district is:
- Establish an amount needed per pupil for a sound basic education. Referred to as the “foundation amount,” this is based on the average per pupil cost of general education in successful school districts as determined by the New York State Education Department (NYSED). For the 2016-2017 school year this amount is $6,340.7
- Adjust for variation in regional costs. The state is divided into nine regions, and non-education labor costs are used as a proxy measure for all operating costs. The North Country and Mohawk Valley regions are the base value (1.0), and the New York City-Long Island region is the highest cost region (1.425).
- Increase funding based on the prevalence of students with special needs, English language learners, and impoverished students. These students often require additional services or instruction.8 The adjustments in steps 2 and 3 raise the statewide average per pupil amount from $6,340 to $15,695 with variations from $7,962 to $22,705 among districts.9
- Subtract the expected local contribution per pupil to arrive at Foundation Aid. The local contribution is calculated based on a district’s wealth per student, with wealth measured by taxable property value and adjusted gross income.
- Multiply the adjusted per pupil Foundation Aid amount by the number of students in the district to determine total Foundation Aid funding for the district.
FOUNDATION AID ILLUSTRATION
To illustrate how the Foundation Aid formula works, consider this simplified, hypothetical example. A school district on Long Island has 3,000 students, of whom 25 percent are from families in poverty and 15 percent are English language learners. In addition, 150 students are classified as needing special education services. The district’s taxable actual property value is $610,610 per pupil, about 10 percent above the statewide average. The district’s adjusted gross income is $264,000 per pupil, also about 10 percent above the state average. Under these circumstances, the Foundation Aid formula would first multiply the standard per pupil amount ($6,340) by the Long Island regional cost index (1.425) to yield a per pupil amount of $9,035. The student characteristics relating to English language and poverty are given standard weights that raise the figure to $12,648. A statewide target local property tax rate (1.57 percent) is increased by 10 percent to account for the district’s adjusted gross income per student compared to the statewide average, raising the local tax rate to 1.73 percent. The adjusted tax rate is then applied to the per pupil taxable actual value to yield a target local tax contribution per pupil ($10,545); this amount is subtracted from the adjusted total per pupil need of $12,648 to yield the per pupil Foundation Aid amount of $2,103. The per pupil amount is multiplied by the total enrollment, adjusted to count the special education students as 2.41 students (3,211.5 students), to yield total Foundation Aid of $6,753,994.
What's Wrong With the Foundation Aid Formula?
When Foundation Aid was developed, lawmakers intended most school aid to flow through this program and for increases to be targeted to low-wealth districts with needy students. However, they also agreed that no district would receive less under the Foundation Aid formula than it had previously received; as a result, the formula was modified with features to hold districts harmless from any decreases. Likewise, provisions were included to ensure virtually all districts, regardless of need, would share in any increases in aggregate Foundation Aid. In addition, because aid was to be increased to a target amount over several years, a “phase-in” factor was incorporated to adjust the amount to be distributed in a given year; however, the adjustment was not set uniformly among districts and varies for different categories of districts. The impact of these provisions has increased over time and dramatically distorted the targeting of Foundation Aid.
Three aspects of the Foundation Aid formula are troublesome:
- Inconsistent local share calculations do not uniformly and fairly account for a district’s ability to pay;
- Arbitrary floors, ceilings, phase-ins, and add-ons to aid amounts distort final funding distributions; and
- Outdated measures of poverty understate or overstate need in many districts.
Inconsistent and Unfair Local Share Calculations
Two options are available for calculating a local district’s expected contribution. Each has flaws.
The first utilizes the Income Wealth Index (IWI), the ratio of a district’s adjusted gross income (AGI) per pupil to the statewide average. For example, an IWI of 3 means the district has AGI per pupil three times the state average and would therefore be expected to contribute three times as much as the average district. However, the formula arbitrarily limits the maximum IWI to 2 and the minimum to 0.65. Accordingly a very poor district with 0.25 IWI is treated the same as a district with 0.65 IWI. These minimums and maximums make the neediest districts in the state seem less needy, while the state’s wealthiest districts seem less wealthy.
The formula multiplies the IWI by the local tax factor, a statewide rate set annually by the NYSED Commissioner, and then applies that rate to the taxable actual value of property in the district.10 Without the limitations on IWI highlighted above, this option would be a logical and fair method for sharing the cost of providing education between the state and the 674 local school districts.
The second option is much more problematic. It allows for the determination of a minimum local contribution from the most favorable result of four alternative calculations of a district’s relative property and income wealth.11 In many cases, the local contribution pursuant to the alternative calculations is far less than under the IWI, and 644 of the 674 districts used the alternative local share method in 2016-2017. As a result, districts calculated contribution is less and they receive more Foundation Aid: the median increase in state share under the alternative method is $1,501 per pupil.12
It should be noted that while the formula sets a local contribution for the purpose of determining a state contribution, the State does not require districts to pay the local contribution or limit their ability to spend far more, which many do.
Arbitrary Floors, Ceilings, Phase-Ins, and Add-Ons
When Foundation Aid was created, a hold harmless provision guaranteed that no district would receive less school aid as a result of the reforms. This impedes the goal of directing state resources based on need. Districts with increasing wealth or decreasing enrollment continue to receive the same level of Foundation Aid—or even increases in years when minimum increases are specified, as they were in 2016-2017.13
The element of the current formula with the most dramatic impact on the distribution of Foundation Aid is the “phase-in factor,” which limits growth in districts’ Foundation Aid. It applies a percentage limit to the increase from the prior year’s Foundation Aid which would result from application of the formula in the current year. To illustrate, if the formula indicates a district should receive $10 million this year, up from $8 million in the prior year, its phase-in factor (for example, 13.6 percent) is applied to the $2 million difference—meaning the increase will be limited to $272,000.
The phase-in factor varies from 0.47 percent to 13.6 percent, with specific rates for the five largest city school districts (New York City, Buffalo, Rochester, Syracuse, and Yonkers) and more general rates for other districts based on district demographics.14
“Add-Ons” refer to aid amounts that are included with Foundation Aid payments, but are not calculated using the Foundation Aid formula. They are added to Foundation Aid payments after the formula calculations based on other criteria specified in budget legislation. This year’s budget includes two add-ons: $266 million distributed based on criteria in the Governor’s Executive Budget proposal and $100 million in “Community Schools” program funding distributed as specified by statutory language enacted by the Legislature.
Outdated Measures of Poverty
The formula directs additional resources to high-need districts via the calculation of the Pupil Needs Index (PNI), which accounts for the relative poverty of students, poverty of the community, the number of English language learners, and population sparsity of the district15 But the community poverty data used to calculate the index are outdated; the data are from the 2000 Census and do not account for shifts in income over the last 16 years. As a result, the formula benefits districts that have seen economic improvements while harming districts that have seen poverty increase. Data availability is not an issue: updated school district level data is available from the Census Bureau’s Small Area Income and Poverty Estimates.16
Because each element of the formula affects the others, eliminating any one distorting element will not itself necessarily significantly improve the distribution of school aid. As one distortive aspect is removed, another will prevent some districts from experiencing the full impact of the change. This is especially true of the hold harmless provisions; almost 40 percent of districts (252) receive more Foundation Aid than the formula would provide because of the hold harmless provision.17
The basis for advocate claims of “underfunded” school districts is the phase-in factor; eliminating it would increase Foundation Aid statewide by $3.8 billion. More than 400 districts would see an increase, with an average district increase per pupil of almost $1,400. New York City would gain $1.6 billion or $1,509 per pupil. However, this approach does nothing to correct the aspects of the formula that misallocate aid to districts that are wealthy or have experienced shifts in student need, enrollment, or wealth. In short, while many school districts do not receive enough school aid given their low wealth and the needs of their students, the magnitude of the purported “underfunding”—$3.8 billion—is exaggerated because it accepts large misallocations of funds built into the faulty formula. Simply eliminating the phase-in factor would still misallocate billions of dollars to wealthy districts that are willing and able to support very high levels of school spending through local resources.
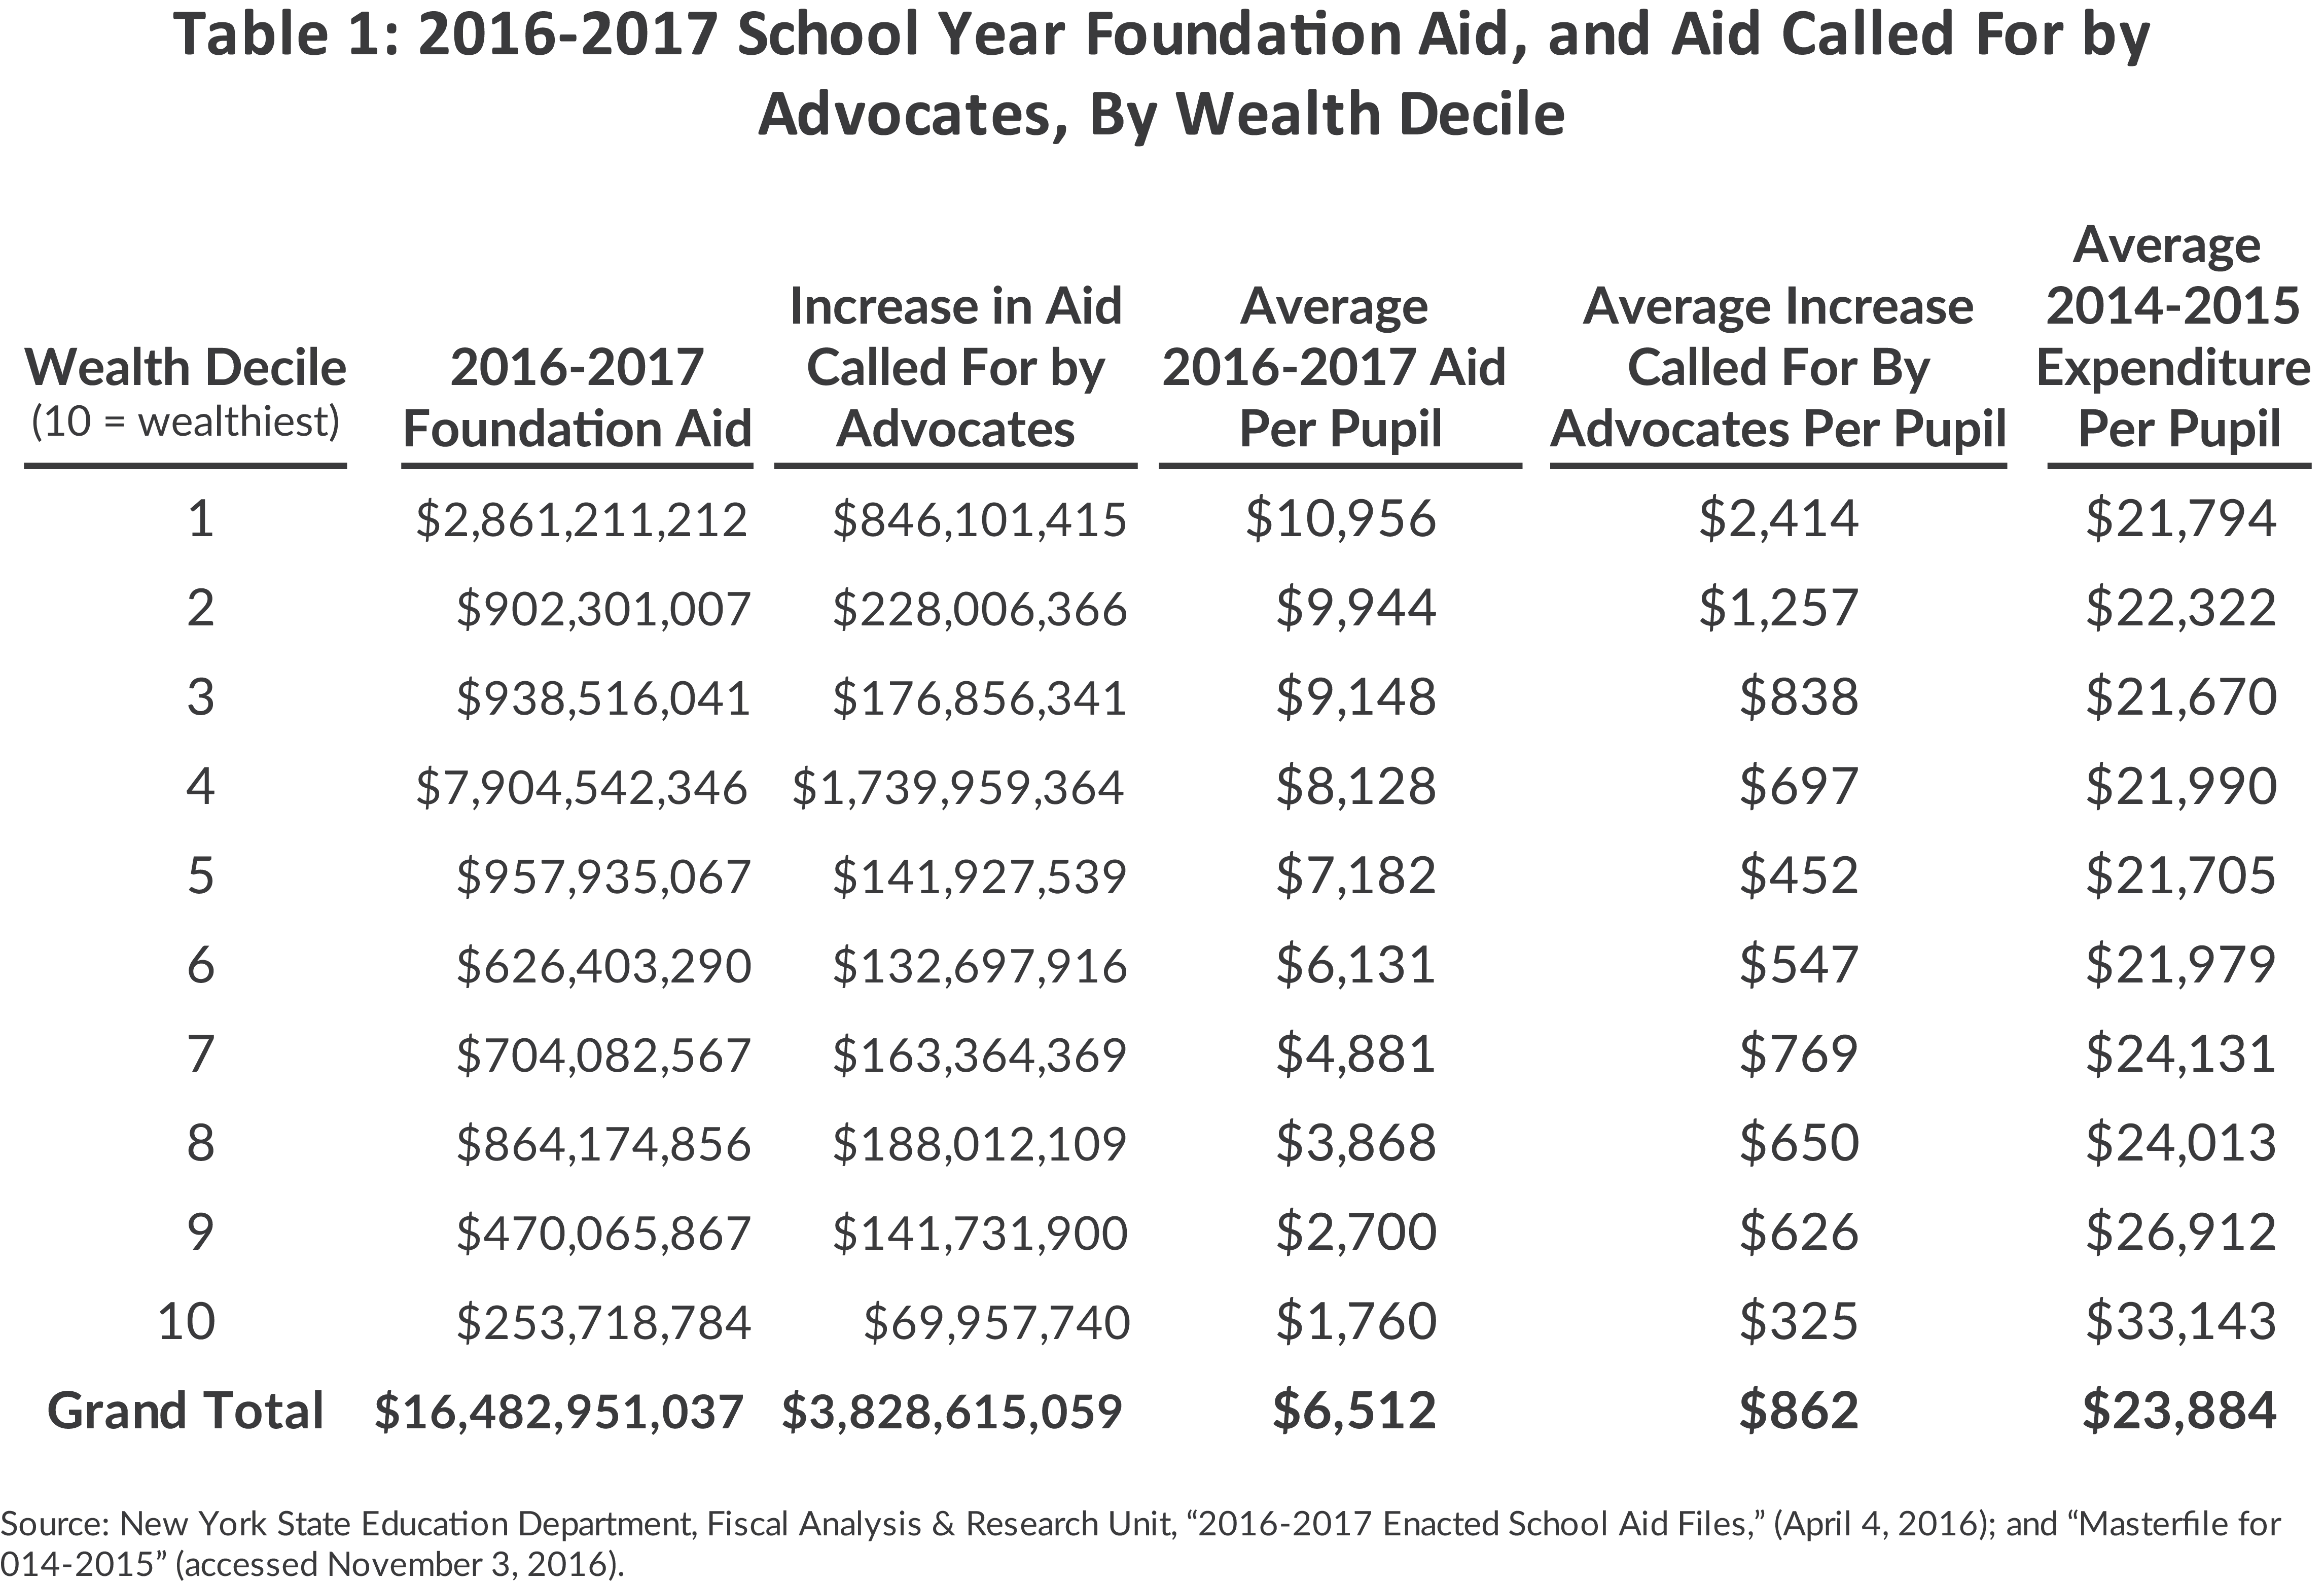
Table 1 illustrates the misallocation of funds that would result from a $3.8 billion increase in unreformed Foundation Aid. It shows the distribution of the added funding among districts by the wealth decile of the districts; districts are categorized in deciles ranging from the poorest (1) to the wealthiest (10).18 Increasing Foundation Aid $3.8 billion would provide the wealthiest decile districts, which already spend on average more than $33,000 per pupil per year, with additional unnecessary funds. Districts in the three other highest wealth deciles that spend more than $24,000 per year per pupil would also receive further unwarranted benefits.
How to Fix Foundation Aid
State education aid needs to be better targeted, not substantially higher. Three sets of reforms are needed. Appendix A explains how each district’s aid would be calculated under a reformed, and simplified, Foundation Aid formula.
- Establish a more equitable basis for setting the expected local funding. The current formula permits districts to select the option for calculating expected local share. A single method should be used that applies a uniform local tax factor and adjusts only for one other factor – the local Medicaid financing burden. Unlike in most states, local taxpayers in New York pay a large share of Medicaid costs. This mandate disproportionately affects property taxpayers in counties with high Medicaid costs due to the larger share of residents enrolled in Medicaid.19 It is appropriate to adjust expected school tax contributions to account for this strain on local resources. The local tax factor, currently 1.57 percent, should be adjusted based on the proportion of the property tax burden in the district’s county attributable to Medicaid. For districts with a below average Medicaid burden, the tax factor would increase above 1.57, while districts with above average Medicaid burdens would see their tax factor decrease.
- Eliminate arbitrary adjustments. Hold harmless provisions, phase-in percentages, caps, and other adjustments in the current formula should be eliminated.
- Increase the additional resources allocated to needs of students in poverty. Research shows persistent poverty has a significant and lasting impact on educational outcomes.20 Increasing the weighting for poverty from 0.65 to 0.75 in the calculation of the PNI incorporated in the formula would more appropriately distribute Foundation Aid.
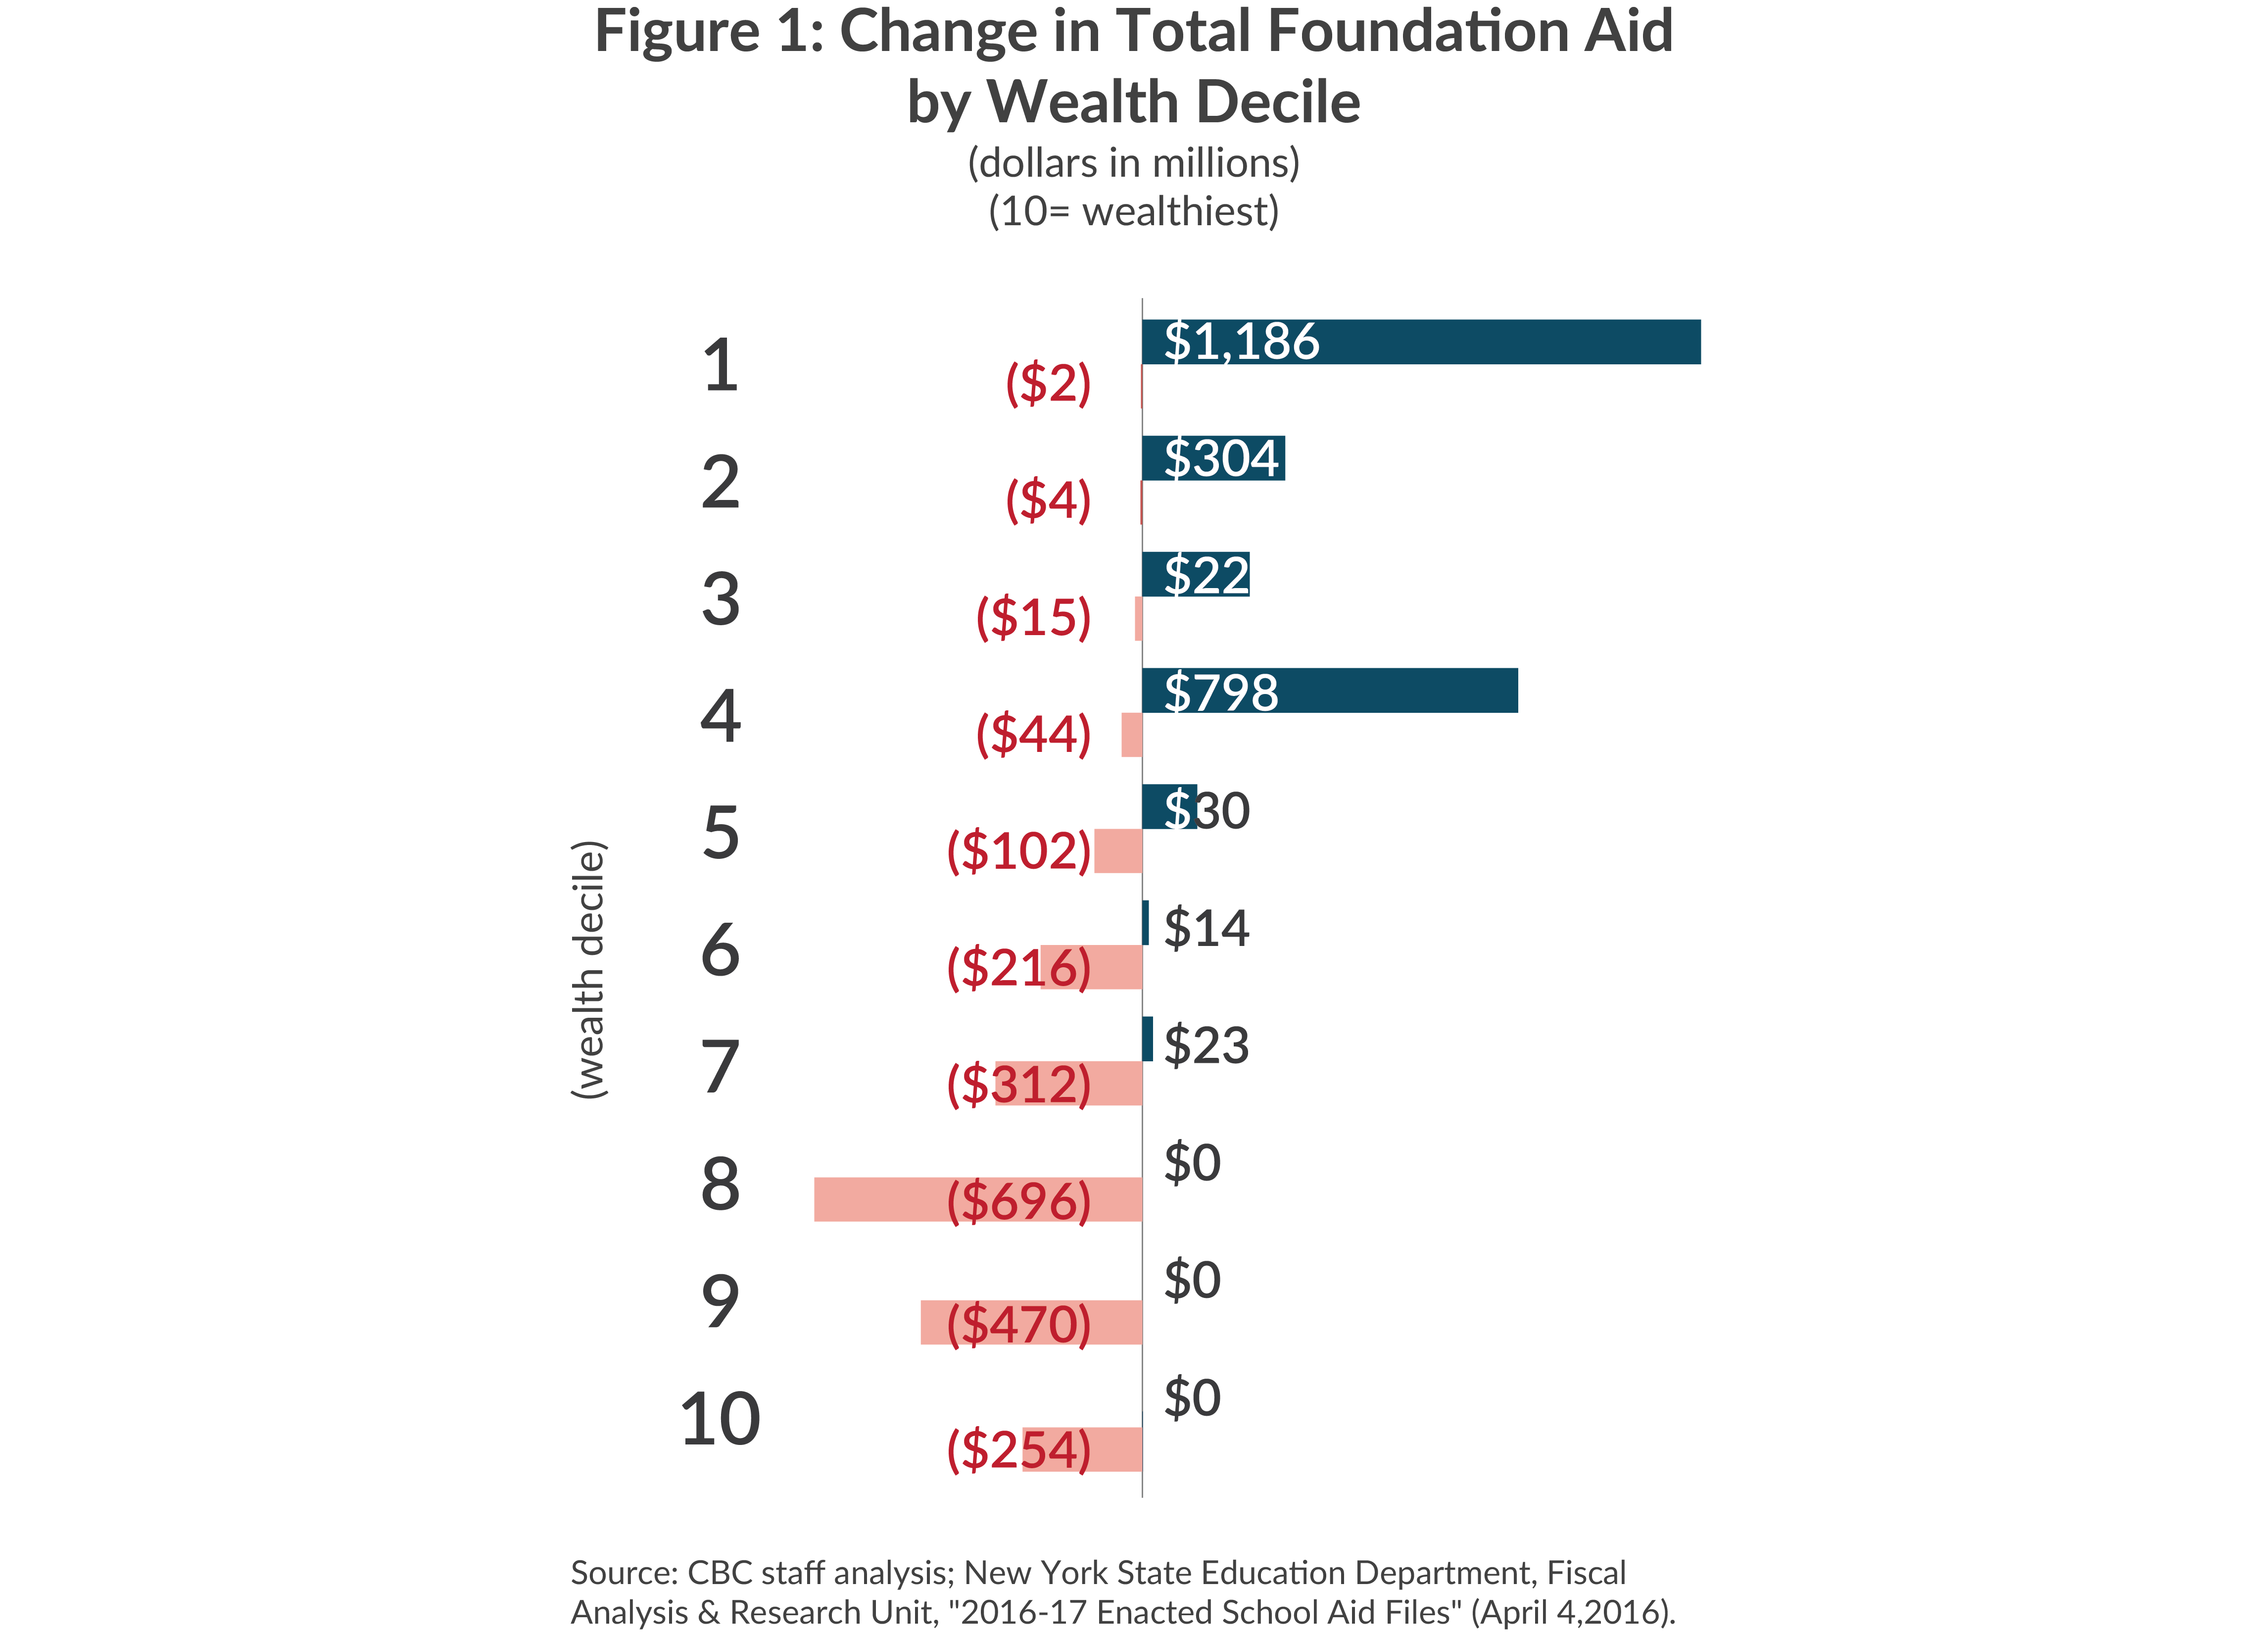
Implementing this package of reforms would increase required total annual Foundation Aid by $569 million. The districts in the wealthiest five deciles would experience a net loss of approximately $1.9 billion that would go to the less wealthy deciles. (See Figure 1.) On a district-by-district basis $2.7 billion would be redirected to districts that need the resources. The poorest decile of districts would receive an increase of almost $1.2 billion.
What would your district receive?
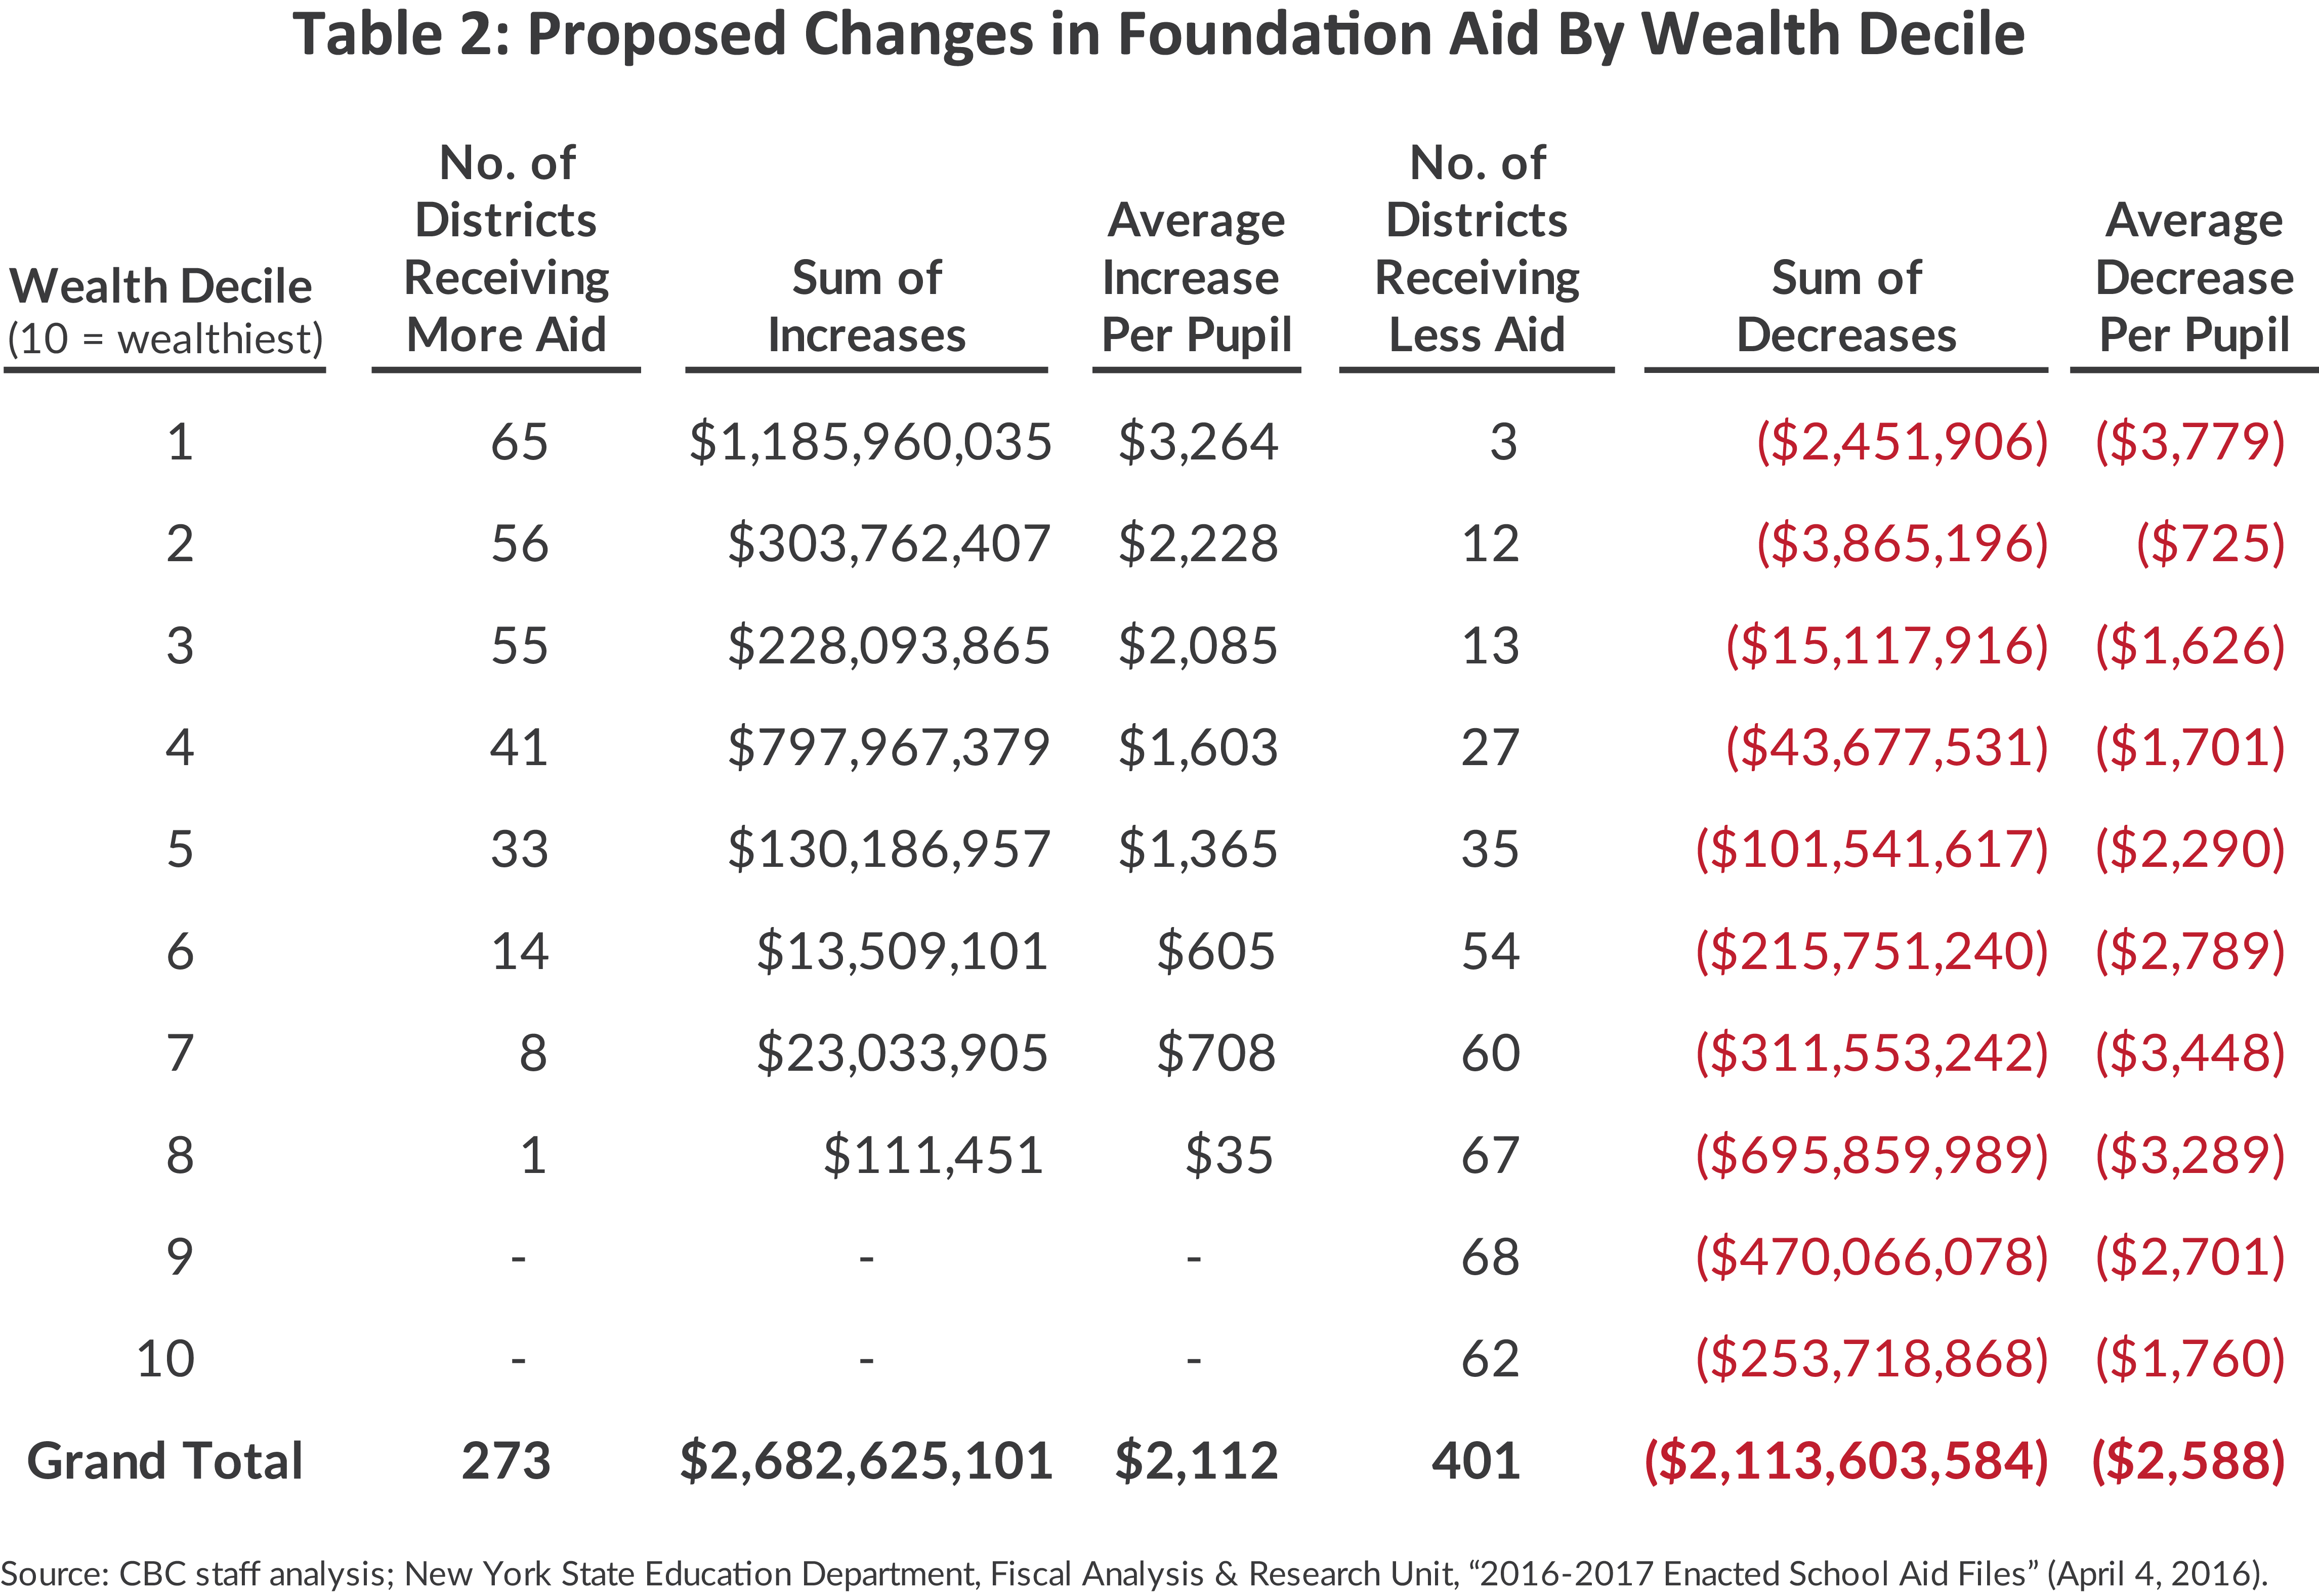
Appendix of District ResultsTable 2 provides a more detailed description of the changes in Foundation Aid under the proposed formula. Additional aid would go to 273 districts, and 401 districts would experience a decrease. The average increase per pupil would be $2,112; in the poorest decile of districts, the average increase would be almost $3,300 per pupil. Due to changes in enrollment, student demographics, and other metrics, decreases and increases for individual districts would occur each year. The average decrease for districts receiving less Foundation Aid would be $2,588 per pupil; this includes 215 districts which would no longer receive any Foundation Aid because their local resources are sufficient to fund basic needs.
In considering the impact on wealthier districts, particularly those that would receive no Foundation Aid, it is important to recognize those districts would continue to receive other State aid. Of the $7.8 billion in expense-related aid this year, $2.0 billion went to districts in the top five wealth deciles. For districts receiving no Foundation Aid under the revised formula, the average per pupil distribution of expense-related aid is $2,257.21 The 130 districts in the top two wealth deciles receiving no Foundation Aid would continue to receive an average of $1,845 per pupil under expense-related aid categories. Likewise, although not technically school aid, the School Tax Relief (STAR) program provides considerable financial benefits to school districts, with greater benefits to wealthier districts.22 Of the $3.3 billion in STAR provided to school districts in FY 2014-15, $1.5 billion went to the wealthiest five deciles. Moreover, the average STAR benefit per pupil is actually higher among the wealthiest five deciles than the poorest – $1,663 versus $1,314 per pupil. For districts receiving no Foundation Aid under the revised formula, the average district will still receive $1,741 per pupil in STAR benefits.23
The wealthiest decile’s average per pupil loss of $1,760 in Foundation Aid is in the context of current per pupil spending of $33,143 annually. Wealthier districts with aid reductions would consider spending less on nonessential services or increasing local support to sustain those services.
On a regional basis, the distribution of aid would shift. (See Table 3.) New York City’s share would grow from 43.2 percent to 45.6 percent, an increase of $645 million. The share for seven other regions would change by less than one percentage point. The Lower Hudson Valley and Capital regions would each decrease about one percentage point. The largest decrease in share would be for Long Island, dropping from 11.6 percent to 9.4 percent, a decline of nearly $300 million. Every region outside New York City would have some districts receiving more aid and others less.
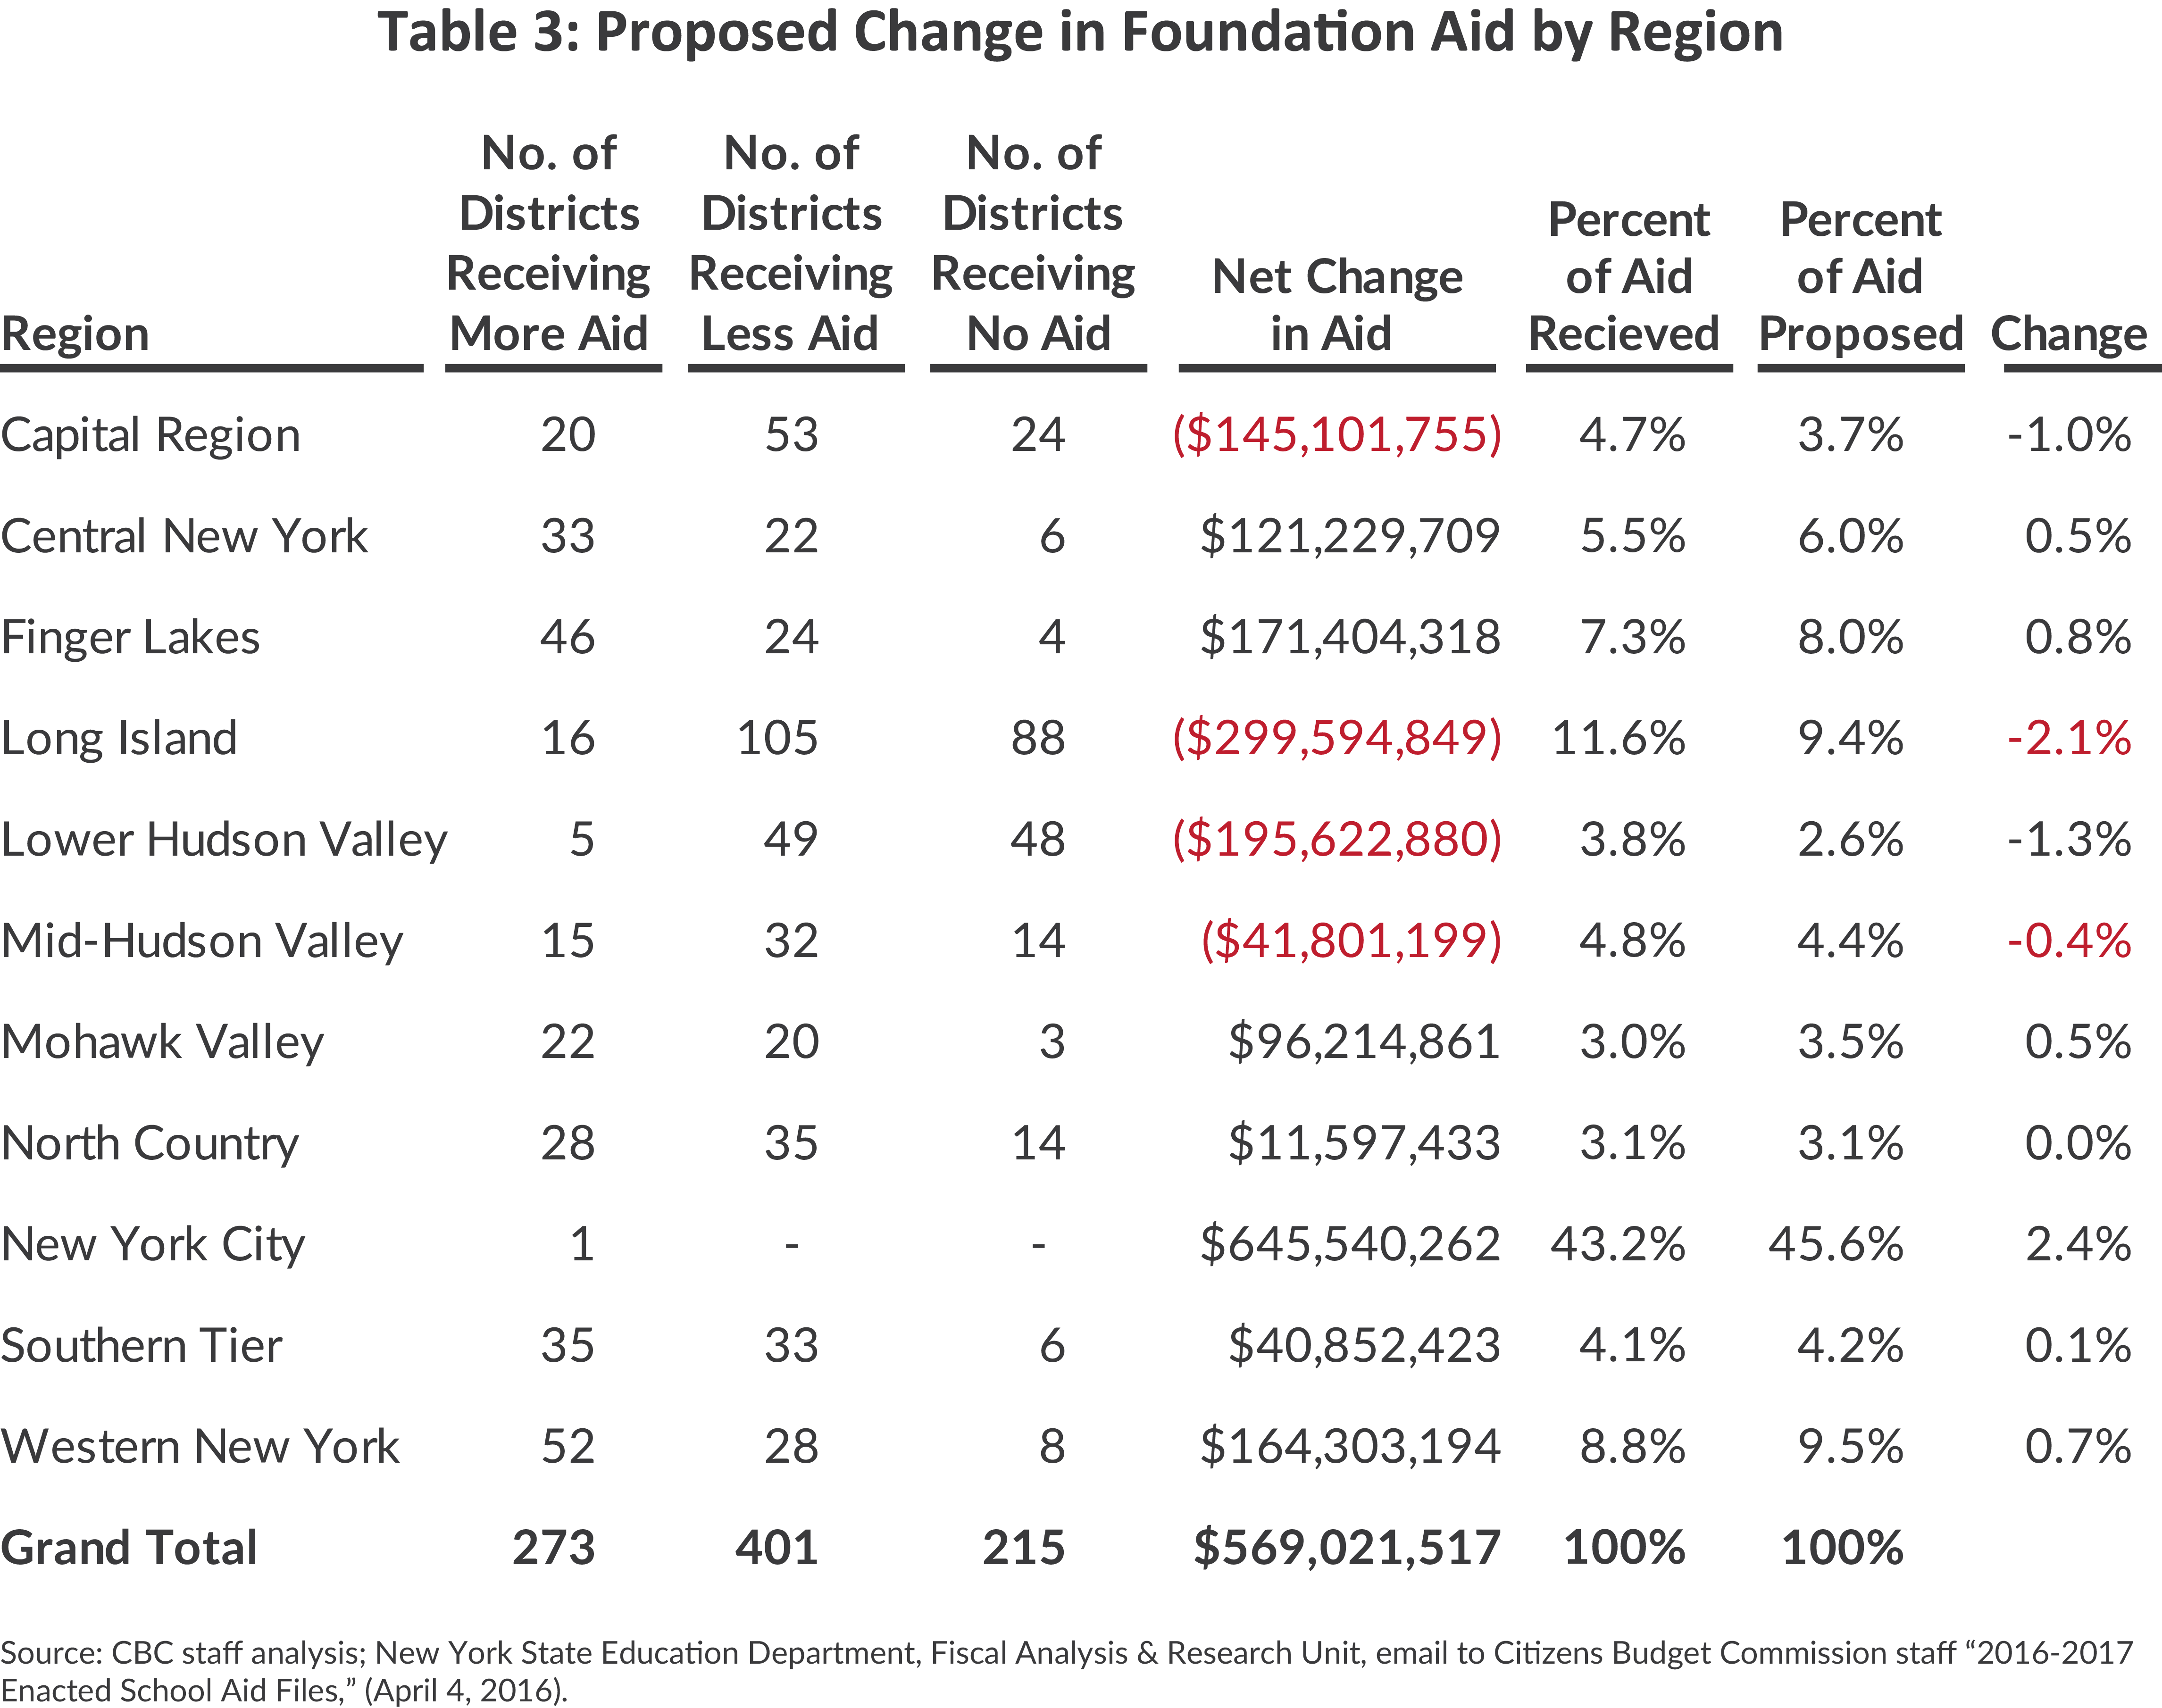
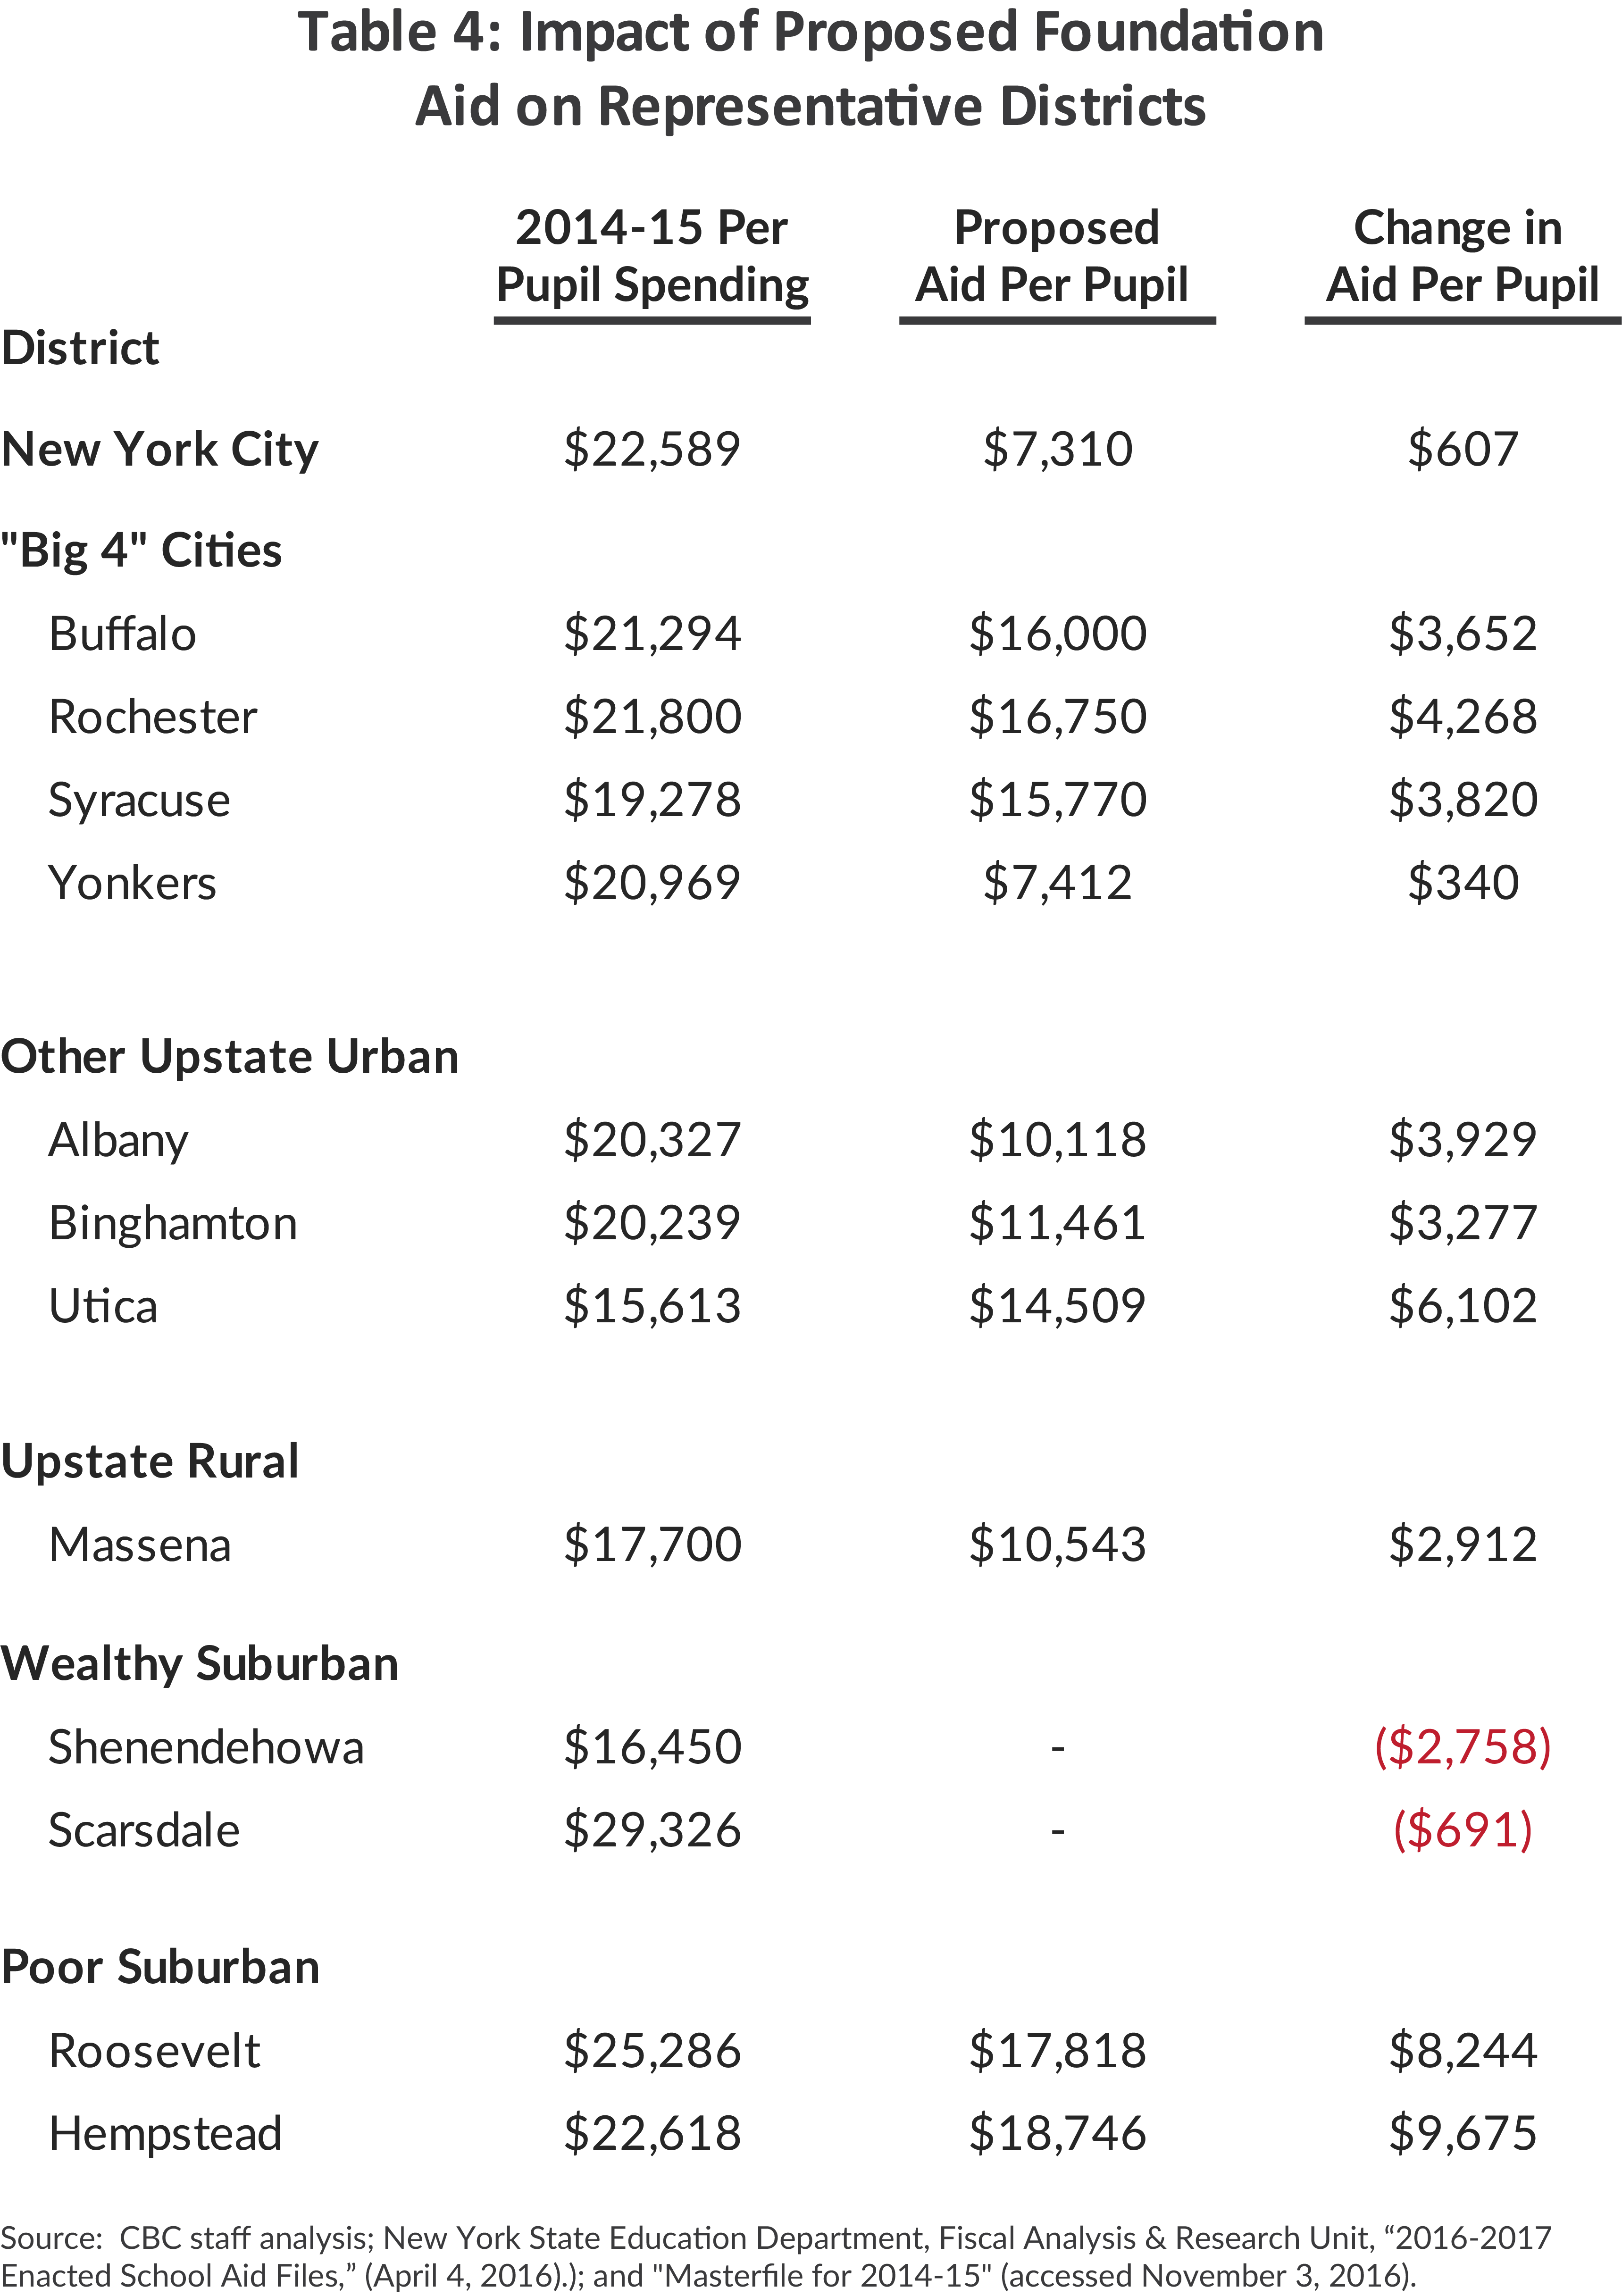
Table 4 below highlights how the revised Foundation Aid formula would affect the five largest districts and some representative school districts. New York City would receive $607 more per pupil in Foundation Aid. The “Big 4” cities would also receive more Foundation Aid, with Buffalo, Rochester, and Syracuse each receiving more than an additional $3,500 per pupil. New York City, in contrast to Buffalo, Rochester, and Syracuse, has considerable property and income wealth per pupil. The proposed formula appropriately incorporates these measures of wealth in the local share calculations, which yields smaller increases in Foundation Aid in New York City than might be expected otherwise. Other upstate urban districts would also see substantial increases in per pupil aid, as would Massena, an upstate rural district.
Foundation Aid would decrease for wealthy suburban districts, reflecting their wealth and lower level of student need. In contrast, poor suburban districts would receive considerably more Foundation Aid, as highlighted by Roosevelt and Hempstead. These two districts have also experienced considerable enrollment increases since Foundation Aid was created – the current formula prevents these districts from receiving the commensurate increases in aid attributable to the increase in enrollment. Under this proposal, per pupil aid would grow by $8,244 in Roosevelt and $9,675 in Hempstead to reach $17,818 and $18,746, respectively. On the other hand, Foundation Aid to Scarsdale, an affluent suburban district with annual per pupil spending of more than $29,000, would decrease by $691 per pupil.
Conclusion
The Foundation Aid formula is seriously flawed. It uses an inconsistent method for calculating local shares, applies numerous arbitrary adjustments, and relies on outdated poverty measures. These flaws warp the distribution of Foundation Aid, sending excessive resources to certain districts, while other districts receive less than needed. The Foundation Aid formula should be revised to better target school aid to support a “sound basic education” in all districts. If all flaws were corrected, the requisite increase in annual State aid would be a relatively modest $569 million. The far larger sums sought by advocates would help needy districts while perpetuating flaws in the formula, increasing state aid for wealthy districts that already spend far more than the state average or more than is necessary to provide students with a sound basic education.
Because implementation of the changes recommended here would have dramatic short-term impacts, it may be reasonable to use a multiyear approach to revamp the formula. Nonetheless, this analysis reveals the serious defects in the way Foundation Aid is distributed; broader understanding of these deficiencies and inequities should spark a debate about achieving a fairer, more fiscally sustainable method of financing New York’s public schools.
Equally important, any policy dialogue about how to increase state aid for education should recognize and address the reality that providing money for a sound basic education is a necessary, but not sufficient, condition for ensuring that goal is achieved. Statewide New York’s districts already spend on average more per pupil than all other states, yet its educational outcomes are only lackluster.24 Without changes in policies and practices, added funds will fail to achieve the intended purpose. The new aid should be accompanied by controls to be sure it is used effectively.
One significant way to promote more effective use of school aid is to enhance NYSED’s accountability system.25 The current system can and should be improved in order to promote the wisest use of tax dollars by local school boards and administrators; this means promoting use of evidence-based strategies and requiring quantifiable results.
Download Report, Including Appendices
A Better Foundation Aid FormulaFootnotes
- The remaining $4.4 billion was expense-based aid, which reimburses school districts for costs of transportation, construction, and other items, many of which are not directly related to classroom instruction. Specific formulas for each type of expense-based aid determine the amount for each district. Generally a higher share of costs is reimbursed for lower-wealth districts; however, the distribution of expense-based aid is less progressive than Foundation Aid. This analysis does not address expense-based aid. See: Elizabeth Lynam, “Fix New York State’s Broken School Aid Formulas,” Citizens Budget Commission Blog (March 12, 2014), www.cbcny.org/cbc-blogs/blogs/fix-new-york-state%E2%80%99s-broken-school-aid-formulas.
- CBC staff analysis, New York State Education Department, Fiscal Analysis & Research Unit, “2016-2017 Enacted School Aid Files” (April 4, 2016).
- According to the New York State Department of Education, 37 districts spent less than $17,500 per pupil and 29 districts spent more than $35,000 per pupil in school year 2014-2015. The average per pupil spending of $23,884 listed in Table 1 is calculated with equal weighting for each district based on NYSED data for school year 2014-15. The U.S. Census Bureau calculates New York’s average spending per pupil in school year 2013-14 of $20,610 as the highest in the nation. CBC staff analysis, New York State Education Department, Fiscal Analysis & Research Unit, Masterfile for 2014-15 (accessed November 3, 2016), www.oms.nysed.gov/faru/Profiles/profiles_cover.html; and U.S. Census Bureau, Educational Finance Branch, Public Education Finances: 2014; Economic Reimbursable Surveys Division Reports (June 2016), p. 26, https://census.gov/content/dam/Census/library/publications/2016/econ/g14-aspef.pdf.
- The most recent available data capturing all sources of spending is for 2014-2015. The local contribution includes $3.3 billion from the School Tax Relief (STAR) program, which provides State support for school districts that reduce local property taxes in exchange for state grants. In other analyses, STAR is treated as local aid that reduces taxes. See: New York State Education Department, Fiscal Analysis & Research Unit, Masterfile for 2014-15 (accessed November 3, 2016), www.oms.nysed.gov/faru/Profiles/profiles_cover.html.
- See: Miriam Aristy-Farer, et al., v. The State of New York, et al; New Yorkers for Student’s Education Rights et al., v. The State of New York, et al.; New York For Students’ Education Rights et al., City of Yonkers v. The State of New York, et al., 143 AD3d 101 (Sup Ct, App. T 2016). In contrast, a separate decision recently stated the Courts are not properly positioned to adjudicate on the effectiveness or appropriateness of the State’s Foundation Aid formula funding. See: Opinion of Honorable Kimberly A. O’Connor in Maisto v. State of New York, 8997-08 (Sup. Ct. 2016).
- The State Fiscal Year 2007-08 Enacted Budget stated, “A new Foundation Aid formula is enacted in permanent law that bases the amount of School Aid on a district’s educational needs and its ability to provide local support for education. Under the Foundation Aid formula, approximately 72 percent of the aid increase will go to high-needs districts.” See: New York State Division of the Budget, New York State 2007-08 Enacted Budget Financial Plan (April 2007), p. 5, www.budget.ny.gov/pubs/archive/fy0708archive/fp0708/2007-08EnactedBudgetReport.pdf.
- New York State Education Department, 2016-17 State Aid Handbook: State Formula Aids and Entitlements for Schools in New York State as Amended by Chapters of the Laws of 2016 (accessed September 13, 2016), p. 7, https://stateaid.nysed.gov/publications/handbooks/handbook_2016.pdf.
- To account for poverty, limited English proficiency, and geographic sparsity, the Foundation Amount is multiplied by the Pupil Needs Index, which equals 1 + ((0.65*(3-year average of free and reduced price lunch count + Student Poverty Count per Census)+ (Limited English Count*0.5) + (Sparsity Count based on Enrollment per square mile))/Public School Enrollment). The formula accounts for students with disabilities in step 5 by counting students with disabilities as 2.41 students, and declassified students as 1.5 students. The adjusted foundation amounts are adjusted upward to account for the prevalence of students with disabilities.
- The Kiryas Joel school district is higher, with a per-enrollee adjusted Foundation Amount of $42,420; however, this district serves only severely disabled children. Per pupil amounts are determined using data provided in the 2014-15 Master File. See: New York State Education Department, Fiscal Analysis & Research Unit, Masterfile for 2014-15 (accessed November 3, 2016), www.oms.nysed.gov/faru/Profiles/profiles_cover.html.
- Pursuant to Section 3602.4.a.(4) and Section 3609-e 1.e of the Education Law, the Commissioner of Education shall calculate the local tax factor as 90 percent of the three-year statewide average school tax rate. It is 1.57 percent in 2016-2017.
- The alternative calculation equals Adjusted Foundation Amount*(1-Foundation Aid State Sharing Ratio (FASSR)). A district’s FASSR is the largest result of the following four formulas, subject to a maximum of 90 percent, which is based on the Foundation Aid Combined Wealth Ratio (FACWR): 1.37 – (1.23*FACWR); 1.00- (0.64*FACWR); 0.8-(0.39*FACWR); or 0.51 – (0.173*FACWR). FACWR = 0.5*(Taxable actual Value per pupil/State Average Assed Value per Pupil) + 0.5*(AGI per pupil/State Average AGI per pupil).
- CBC staff analysis, New York State Education Department, Fiscal Analysis & Research Unit, “2016-2017 Enacted School Aid Files” (April 4, 2016).
- The formula for 2016-2017 includes a minimum increase for most school districts. Unlike past years when minimum increases were a simple percentage, the latest increase is based on a separate, complex formula that did not provide an increase to every district. The overwhelming majority of districts received aid increases due to other factors, and the minimum increase is not applicable. The formula also contains a $500 minimum of Foundation Aid per pupil. Removing this element of the formula has no impact without reform to the hold harmless and minimum increase provisions since all districts already receive at least $500 per student.
- Phase-in rates are set as part of the budget process and are as follows: New York City: 7.784 percent, Buffalo: 7.03 percent, Rochester: 6.72 percent, Syracuse: 9.55 percent, Yonkers: 6.74 percent, small city districts with a Combined Wealth Ratio (CWR) under 1.4: 9.00 percent, urban and suburban high-need/resource-capacity districts: 0.719 percent. Of urban-suburban high-need/resource-capacity districts, districts which are also small city school districts with a CWR less than 1.4: 9.719 percent, rural high-need/resource-capacity districts: 13.6 percent, all other eligible districts: 0.47 percent. A district is subject to a phase-in factor if (1) the three-year average K-6 Free and Reduced Price Lunch (FRPL) ratio is greater than 15 percent and (2) the unrestricted aid increase is less than 7 percent.
- Pupil needs index = 1 + ((.65*(FRPL count + census poverty count)+ (limited English proficiency count * 0.5) + sparsity count))/enrollment. This ratio is arbitrarily limited to 2, although that restriction is binding only on three districts.
- Pursuant to the Fiscal Year 2017 budget, the New York State Board of Regents is in the process of releasing recommendations to changes to the Foundation Aid formula. Preliminary recommendations include using the Small Area Income and Poverty Estimates and changing from the free and reduced lunch count to other means-tested programs that utilize more reliable data, including Medicaid and the Supplemental Nutritional Assistance Program. Unfortunately, this level of data is not publicly available by school district. See: Elizabeth R. Berlin, The State Education Department, letter to State Aid Subcommittee (September 12, 2016), www.regents.nysed.gov/common/regents/files/916sad1revised.pdf.
- CBC staff analysis based on data from New York State Education Department, Fiscal Analysis & Research Unit, “2016-2017 Enacted School Aid Files” (April 4, 2016).
- Wealth deciles are based on the average of a district’s free and reduced price lunch share and census poverty share, divided by the district’s combined wealth ratio as determined by NYSED. The resulting figure is then indexed to the state average to determine a needs index. CBC staff analysis based on data from New York State Education Department, Fiscal Analysis & Research Unit, “2016-2017 Enacted School Aid Files” (April 4, 2016).
- For more information related to the inequities of local funding of Medicaid, see: Citizens Budget Commission, A Poor Way to Pay for Medicaid (December 2011), www.cbcny.org/sites/default/files/REPORT_Medicaid_12122012.pdf.
- Katherine Michelmore and Susan Dynarski, The Gap Within the Gap: Using Longitudinal Data to Understand Income Differences in Student Achievement, Working Paper 22474 (National Bureau of Economic Research, July 2016), http://users.nber.org/~dynarski/w22474.pdf.
- CBC staff analysis based on data from New York State Education Department, Fiscal Analysis & Research Unit, “2016-2017 Enacted School Aid Files,” (April 4, 2016).
- Citizens Budget Commission, Local Taxes in New York State: Easing the Burden (December 2007), p. 22, www.cbcny.org/sites/default/files/report_localtaxes_12012007.pdf.
- This does not include the value of the STAR rebates. CBC staff analysis based on New York State Education Department, Fiscal Analysis & Research Unit, Masterfile for 2014-15 (accessed November 3, 2016), www.oms.nysed.gov/faru/Profiles/profiles_cover.html; and New York State Education Department, Fiscal Analysis & Research Unit, “2016-2017 Enacted School Aid Files” (April 4, 2016).
- Education Week gave New York a C- in K-12 pupil achievement in 2016. See: “Quality Counts Marks 20 Years Report Explores New Directions in Accountability,” Education Week (January 7, 2016), www.edweek.org/media/qualitycounts2016_release.pdf.
- For a full discussion of increasing accountability, see: Citizens Budget Commission, Promoting Accountability in New York State” (November 2004), www.cbcny.org/sites/default/files/report_accountability_11292004.pdf.