Bigger Not Better
New York’s Expanding Economic Development Programs
Economic development has been and remains a high priority of Governor Andrew Cuomo. Beginning in January 2011 his administration shepherded a wide variety of initiatives through the legislative process, including new and expanded tax credit and other programs, the formation of Regional Economic Development Councils (REDCs) to coordinate local strategy, and major capital investments under the auspices of Empire State Development (ESD). Although some modest reforms have been made, many economic development programs have grown significantly without the improvements needed to address widely noted shortcomings. The fiscal year 2015-2016 Executive Budget released last month proposes $1.9 billion in new capital appropriations for ESD. An understanding of the value and shortcomings of the current programs is critical to assessing whether and how to expand this area of state activity.
The Citizens Budget Commission (CBC) and others have repeatedly noted problems with a number of the State’s economic development programs and has urged better coordination, standardized metrics, payment only for results, and more transparency and disclosure through a unified economic development budget. 1 This report reviews the changes in economic development spending from 2010 to 2014 and the extent to which problems have been constructively addressed.
Economic Development Investments Grew Significantly from 2010 to 2014
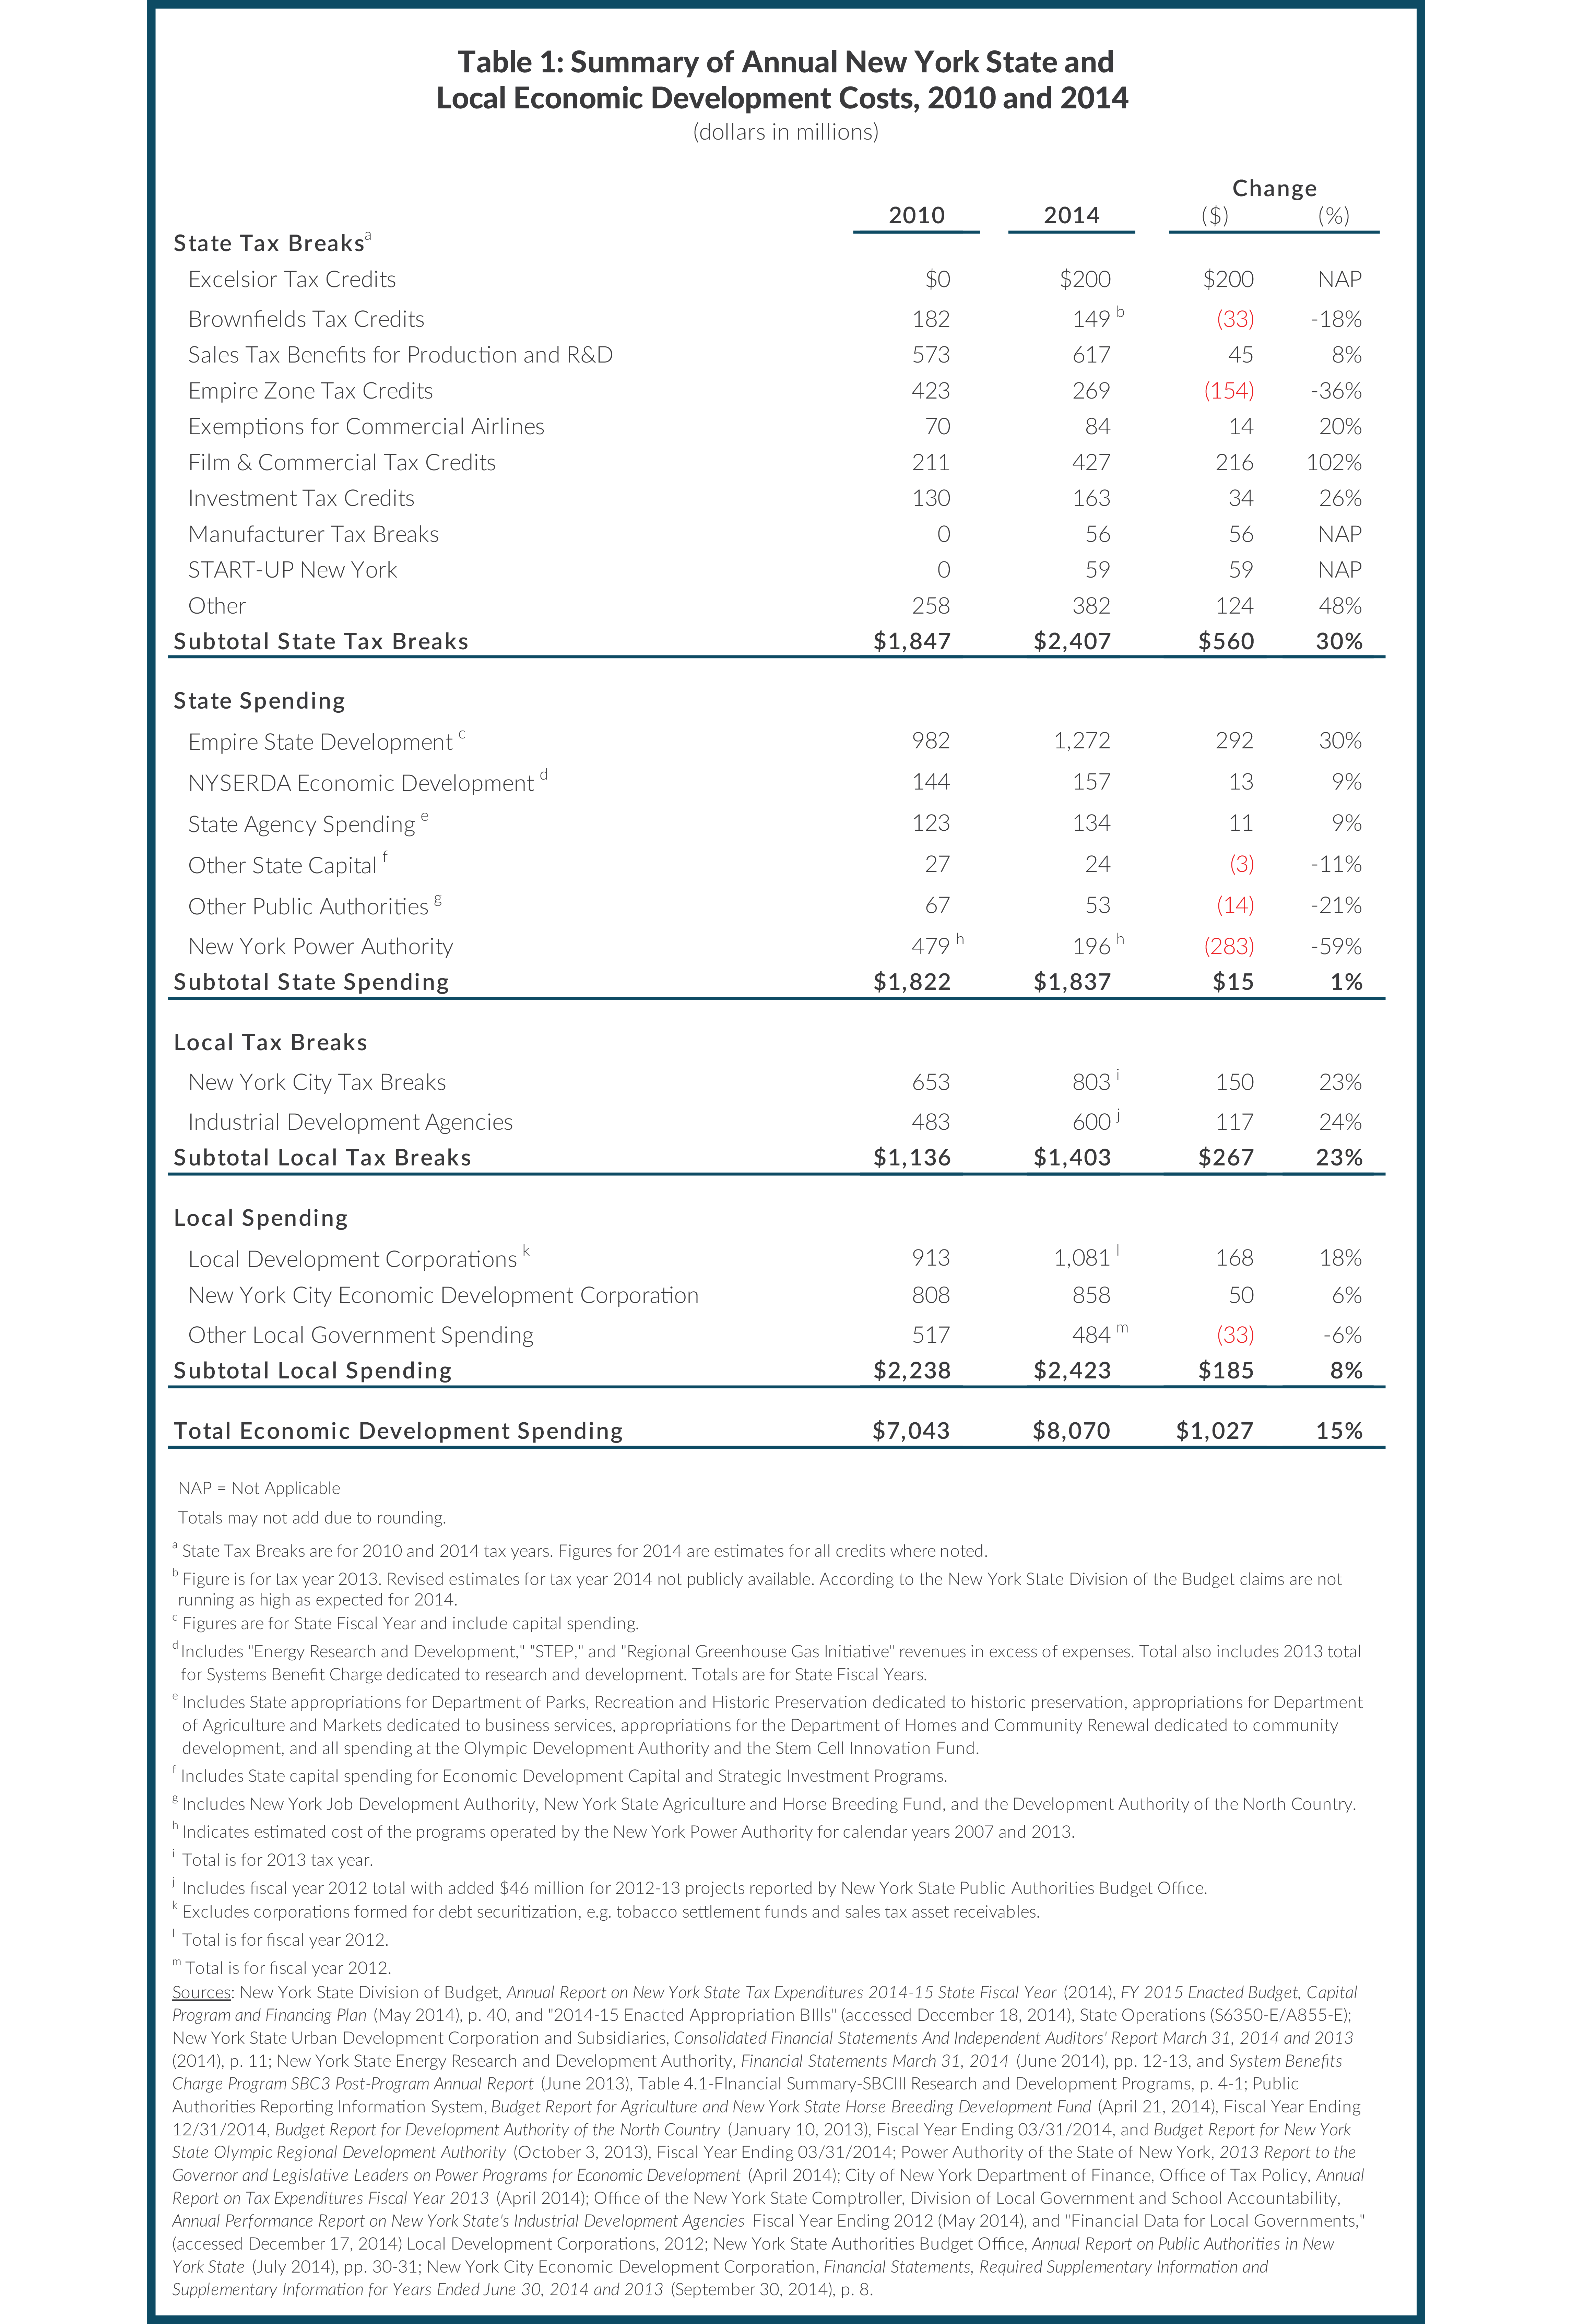
In 2010 economic development investments—operating expenses, capital projects, and forgone revenues through tax expenditures—amounted to $7.0 billion including $3.3 billion in locally-directed activity. (See Table 1.) New York State offered numerous tax expenditure programs including tax credits for the redevelopment of brownfields, sales tax benefits for research and development, empire zone tax credits, and film and commercial tax credits; in 2010 these programs cost $1.8 billion. State agency and public authority investments in economic development in 2010 were an additional $1.8 billion including $479 million in benefits provided by New York Power Authority (NYPA). Local tax expenditures and spending programs cost $1.1 billion and $2.2 billion, respectively.
By 2014 annual economic development investments had grown to an estimated $8.1 billion, an increase of $1.0 billion or 15 percent from 2010. The bulk of the increase, $575 million, is for state programs. Increases in local programs, not examined in this paper, were $452 million or 13 percent.
The main expansions to state programs were for tax expenditures, which increased $560 million. Modest reforms have been achieved with the creation of the REDCs, the replacement of some of the NYPA economic development programs with a new program called Recharge NY, and the sunset of the seriously flawed Empire Zones and their subsequent replacement with the Excelsior Jobs Program (“Excelsior”) tax credit, although recent extensions of Excelsior are a concern. Many existing tax expenditures including the film tax credit, the investment tax credit, and tax credits for manufacturers have been expanded or extended despite concerns about their efficacy and cost-effectiveness. Capital investments have also expanded without a thorough review. In addition, new programs including START-UP NY have begun; although small in cost now, they are likely to grow more expensive.
Some Programs Modestly Reformed
Three modest improvements have been made through the replacement of Empire Zones with the Excelsior program, modification of NYPA economic development programs, and the creation of the REDCs. The Governor and the Legislature deserve credit for the reforms, but additional disclosure, accountability measures, and program evaluation are required. In addition, the qualifications for Excelsior tax credits, already weakened once, should be strengthened.
Empire Zones Replaced with the Excelsior Jobs Program. The Excelsior Jobs Program was created as a replacement to the Empire Zones program in 2010.2 Excelsior can provide selected businesses with four fully-refundable tax credits against the State corporate income tax: 1) a jobs tax credit of 6.85 percent of wages per new job; 2) an investment tax credit of 2 percent of qualified investments; 3) a research and development credit of 50 percent of the Federal Research and Development Credit for up to 3 percent of research expenditures in New York; and 4) a real property tax credit for firms locating in certain distressed areas (as defined by ESD) and qualified as “regionally significant” because they agree to higher employment and investment standards.3 Businesses qualified for the real property tax component take a credit against their New York State tax liability based on the improved value of the property due to the project.4 The State may issue only $50 million in new credits annually.5 Firms may apply to receive the tax credits available in Excelsior by achieving either a targeted increase in jobs or investments. Estimated credits to be claimed by businesses in 2014 are $200 million. (See Table 1.)
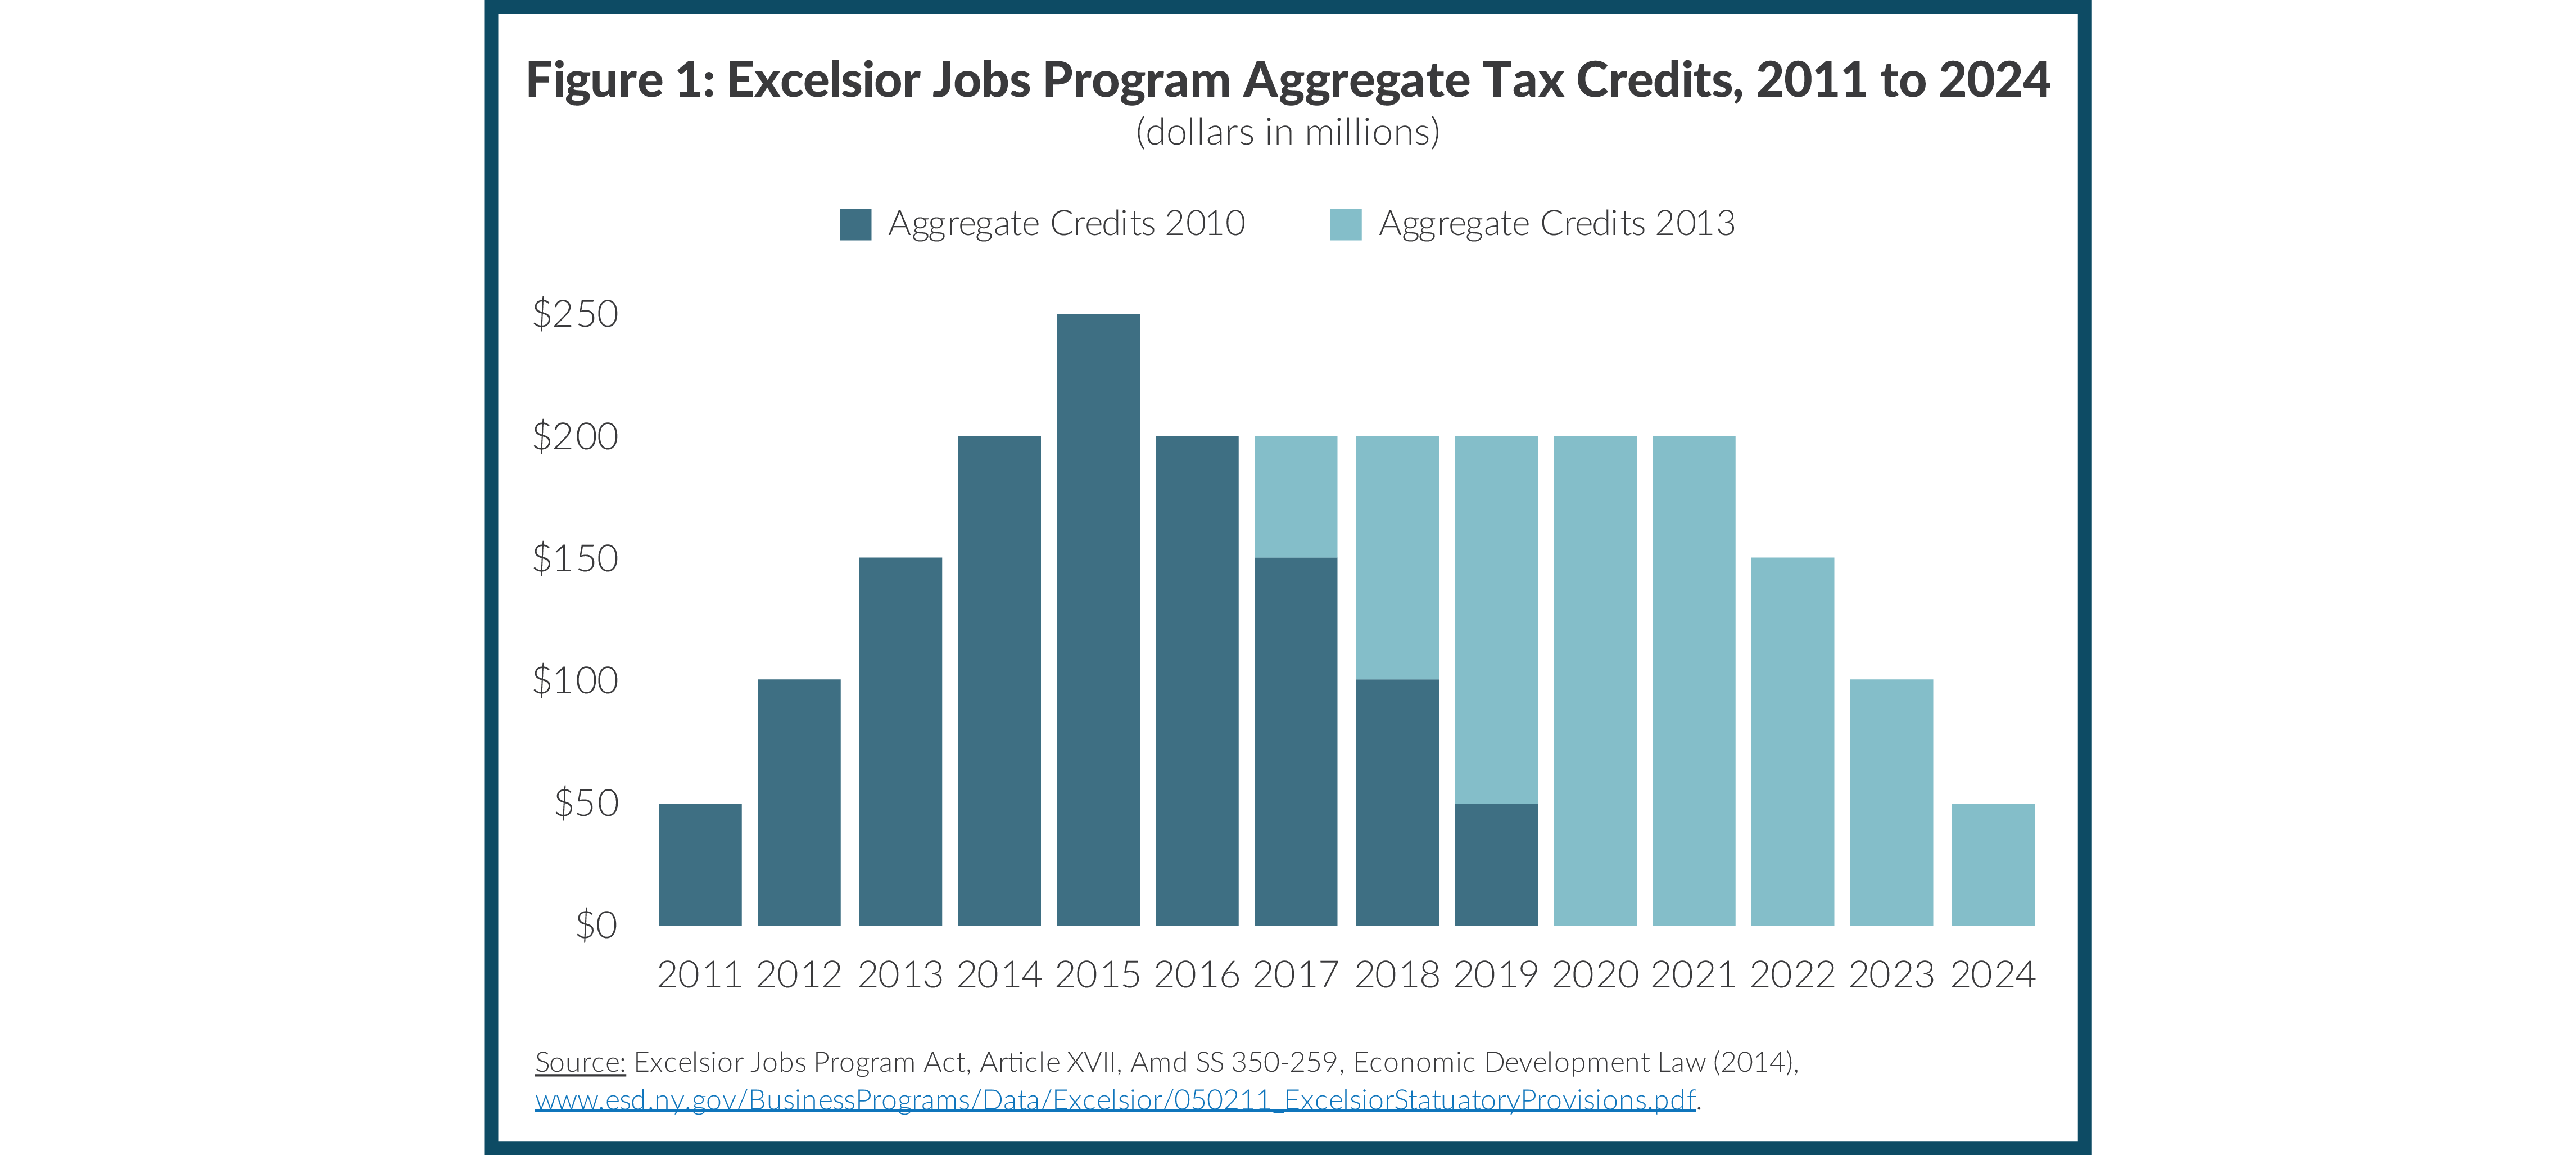
As of June 30, 2014, $455 million in Excelsior tax credits have been set aside for 273 applicants.6 Figure 1 shows the maximum aggregate credits for each tax year from 2011 to 2024. When the program was introduced, participants were able to earn credits for up to five consecutive years, with the program expiring in 2019.7 However, the program was expanded in 2013, and awardees may now use credits for 10 consecutive years to 2024.
Excelsior is an improvement over Empire Zones in that it contains cost-benefit tests and is targeted only to specific industries. Other positive features include the award of credits retroactively based only on actual job growth or investment, the exclusion of low-wage industries such as the retail sector, capped aggregate costs, and additional reporting requirements.8 However, additional changes, made as part of the fiscal year 2012 State budget, loosened the controls by enhancing the credits for gross wages and research and development. Awardees are now also allowed to claim credits as interim milestones toward their total commitments are reached.9
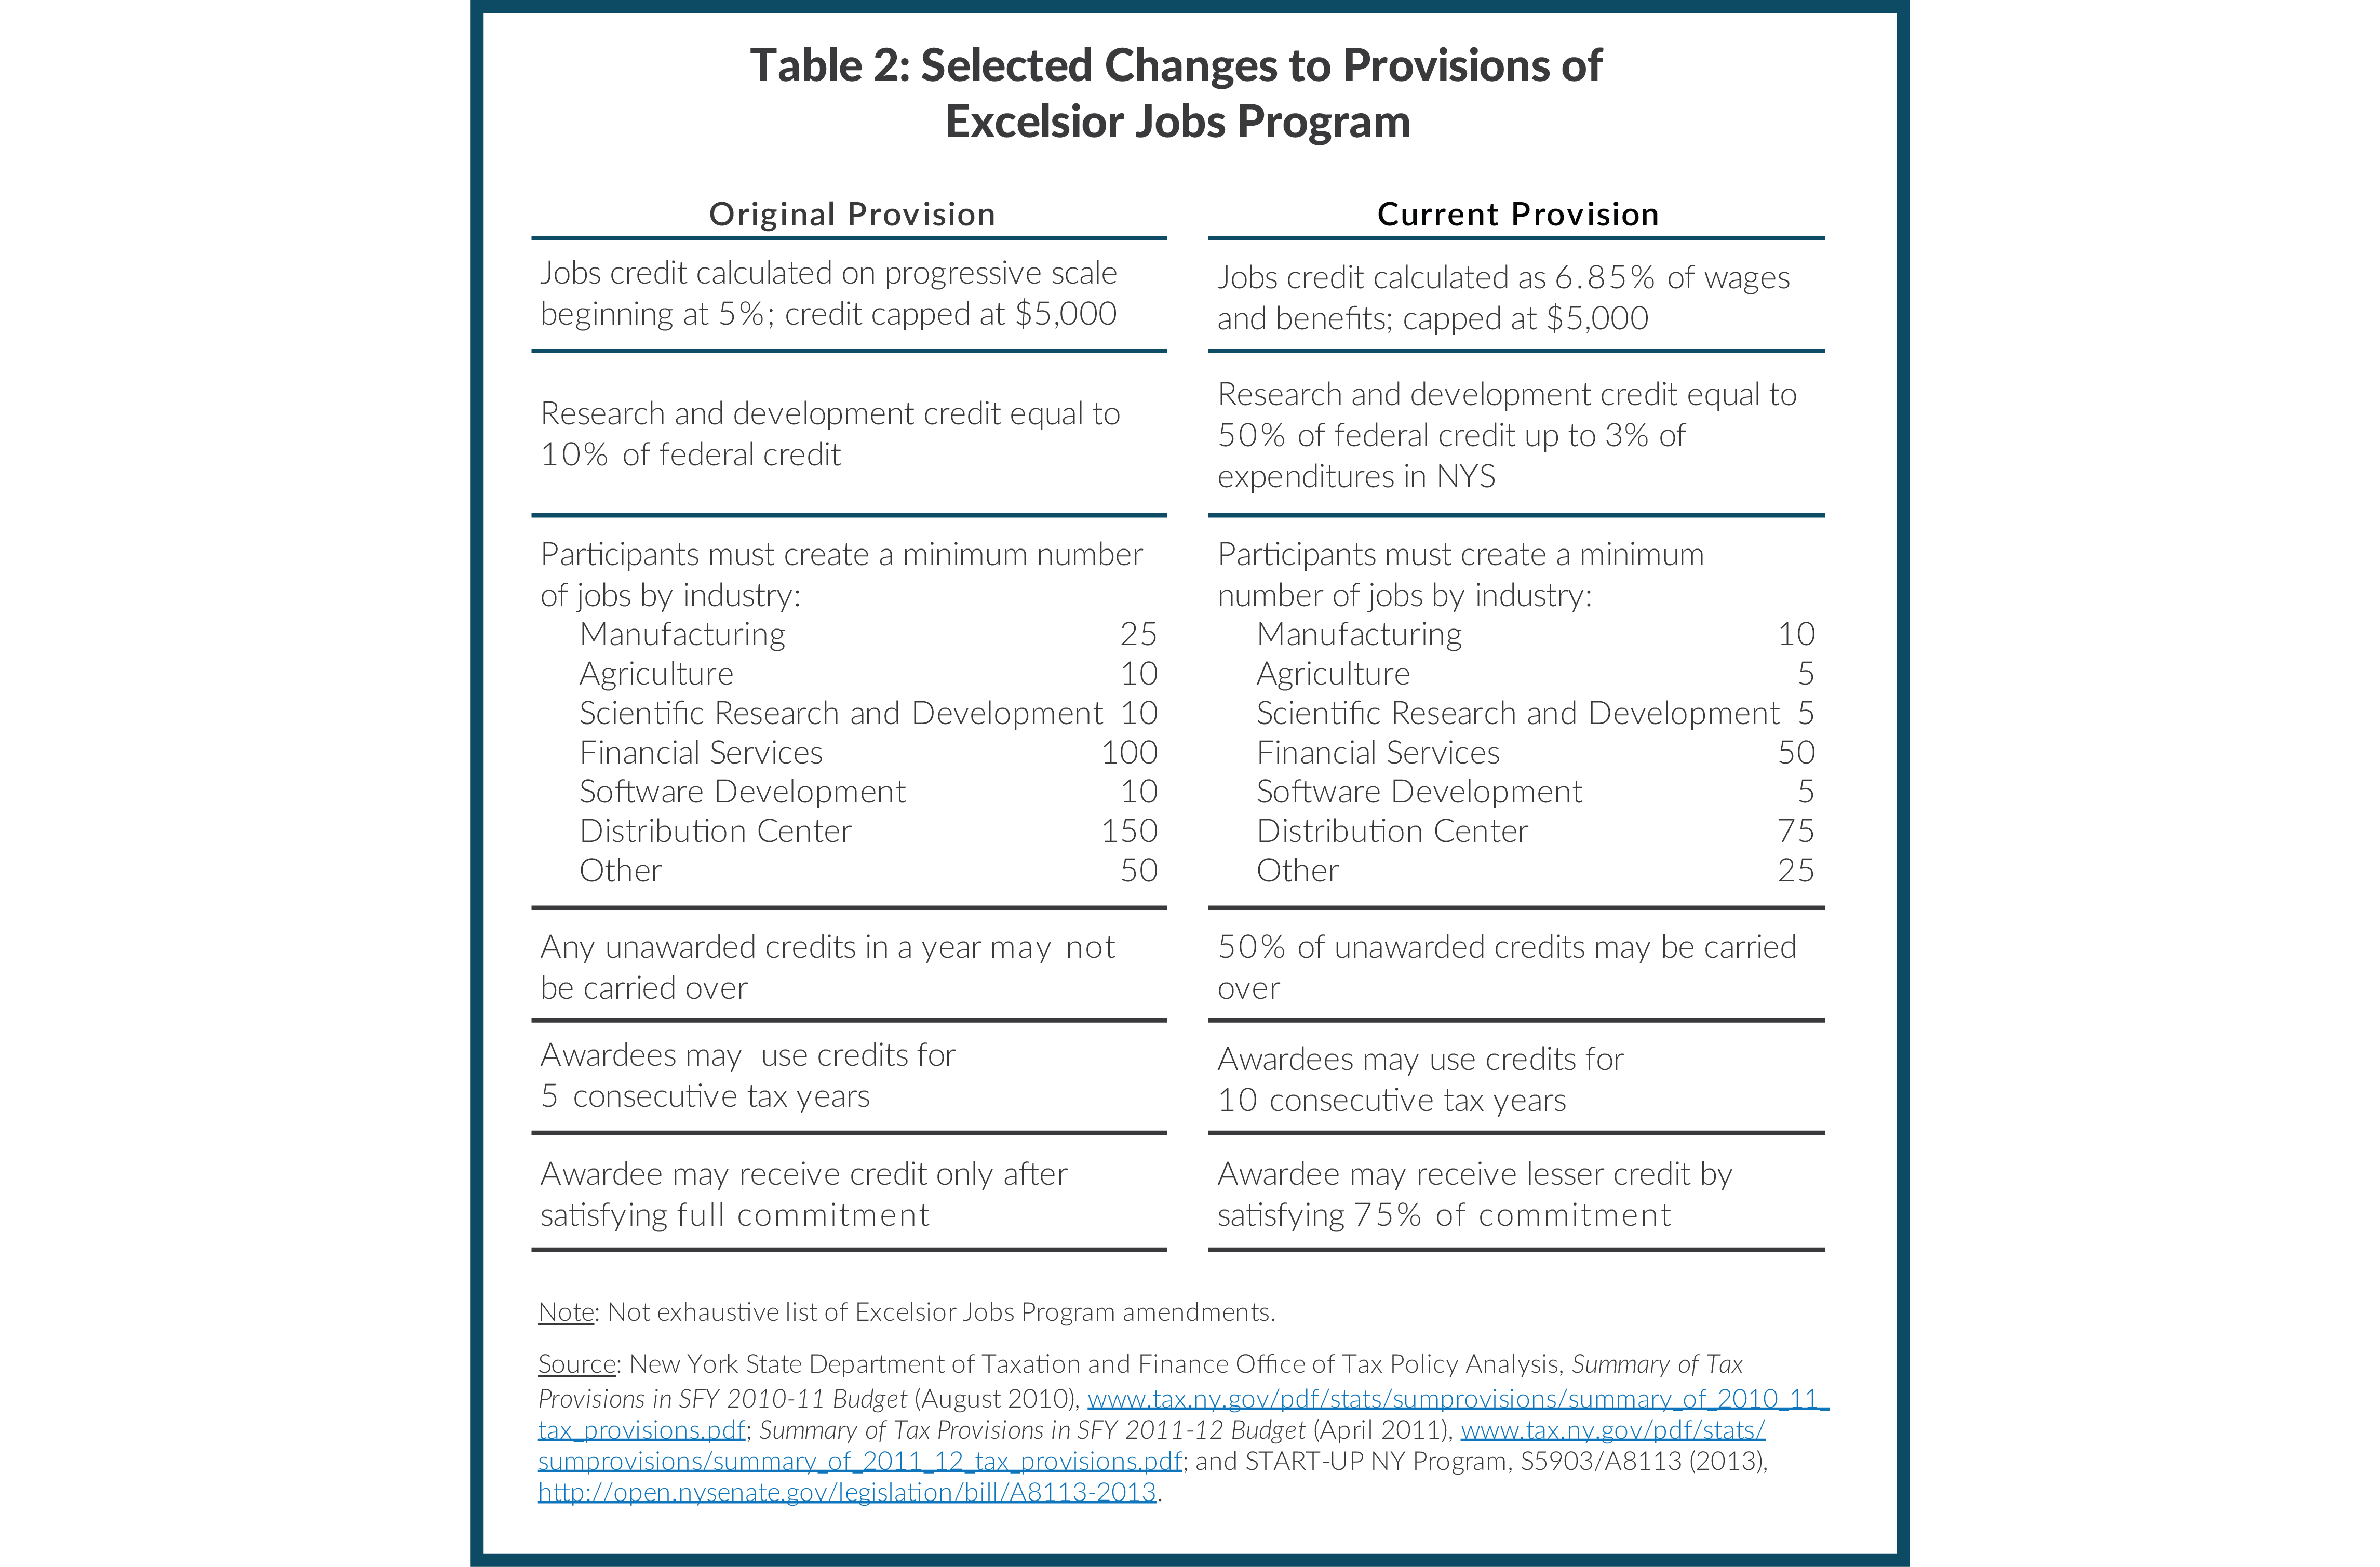
The expansion in 2013 lowered thresholds for businesses to qualify for admittance to the program and allowed ESD to roll over half of all unused credits in any given year. Additionally, ESD was given more freedom to classify applications as vital to the region’s economy. (See Table 2.) These changes will cause the cost of the program to rise as more businesses are eligible and inclined to participate.
ESD has also strayed from its initial discipline of targeting specific industries by starting to award credits to projects that fit under an “Other” designation.10 As of June 2014, more than $30 million in credits had been set aside for three businesses under this “Other” designation, all in New York City: Fresh Direct, an online grocer and delivery service; Pearson, an international media company; and Shiel Medical Laboratory, a medical diagnostic lab. The fiscal year 2016 Executive Budget extended eligibility to entertainment companies, granting $11 million retroactively for the Late Show in New York City.11
New York Power Authority: Recharge New York. In 2011 Governor Cuomo and the legislature revised NYPA’s nine economic development programs, replacing three with Recharge New York, and ending Power for Jobs, the Energy Cost Savings Benefit, and the High Load Factor programs. Recharge New York increased reporting requirements for beneficiaries.12 The hydropower programs, called Expansion and Replacement and Preservation Power, continue to provide allocations of inexpensive hydropower from Niagara Falls and the St. Lawrence facilities to businesses in those regions.
CBC estimates the cost of NYPA’s economic development programs in 2013 ranged from $131 million to $197 million, down from $479 million in 2008.13 The cost estimate has fallen for two reasons: the cost of power in New York has fallen and NYPA has increased the price it charges its economic development customers.14 Recharge New York offers variable rates based on the recipient’s location. Taking current zone rates into account, the prices charged by NYPA for purchased power have increased by 30 to 122 percent since 2008 depending on the zone.
Although NYPA’s programs have improved, concerns remain about the large legacy hydropower awards in Western New York (Expansion Power and Replacement Power) and in North Country (Preservation Power).15 In 2012 the Expansion and Replacement Power programs were changed so unallocated power is now sold on the open market, and proceeds from these sales are deposited into the locally-run Western New York Economic Development Fund for investment in local projects. Efforts to maximize the value of the hydropower by selling some of it on the open market are an improvement, but the benefits of the regional investments to be made by the locally-run economic development funds and the large legacy awards of hydropower remain unclear.16
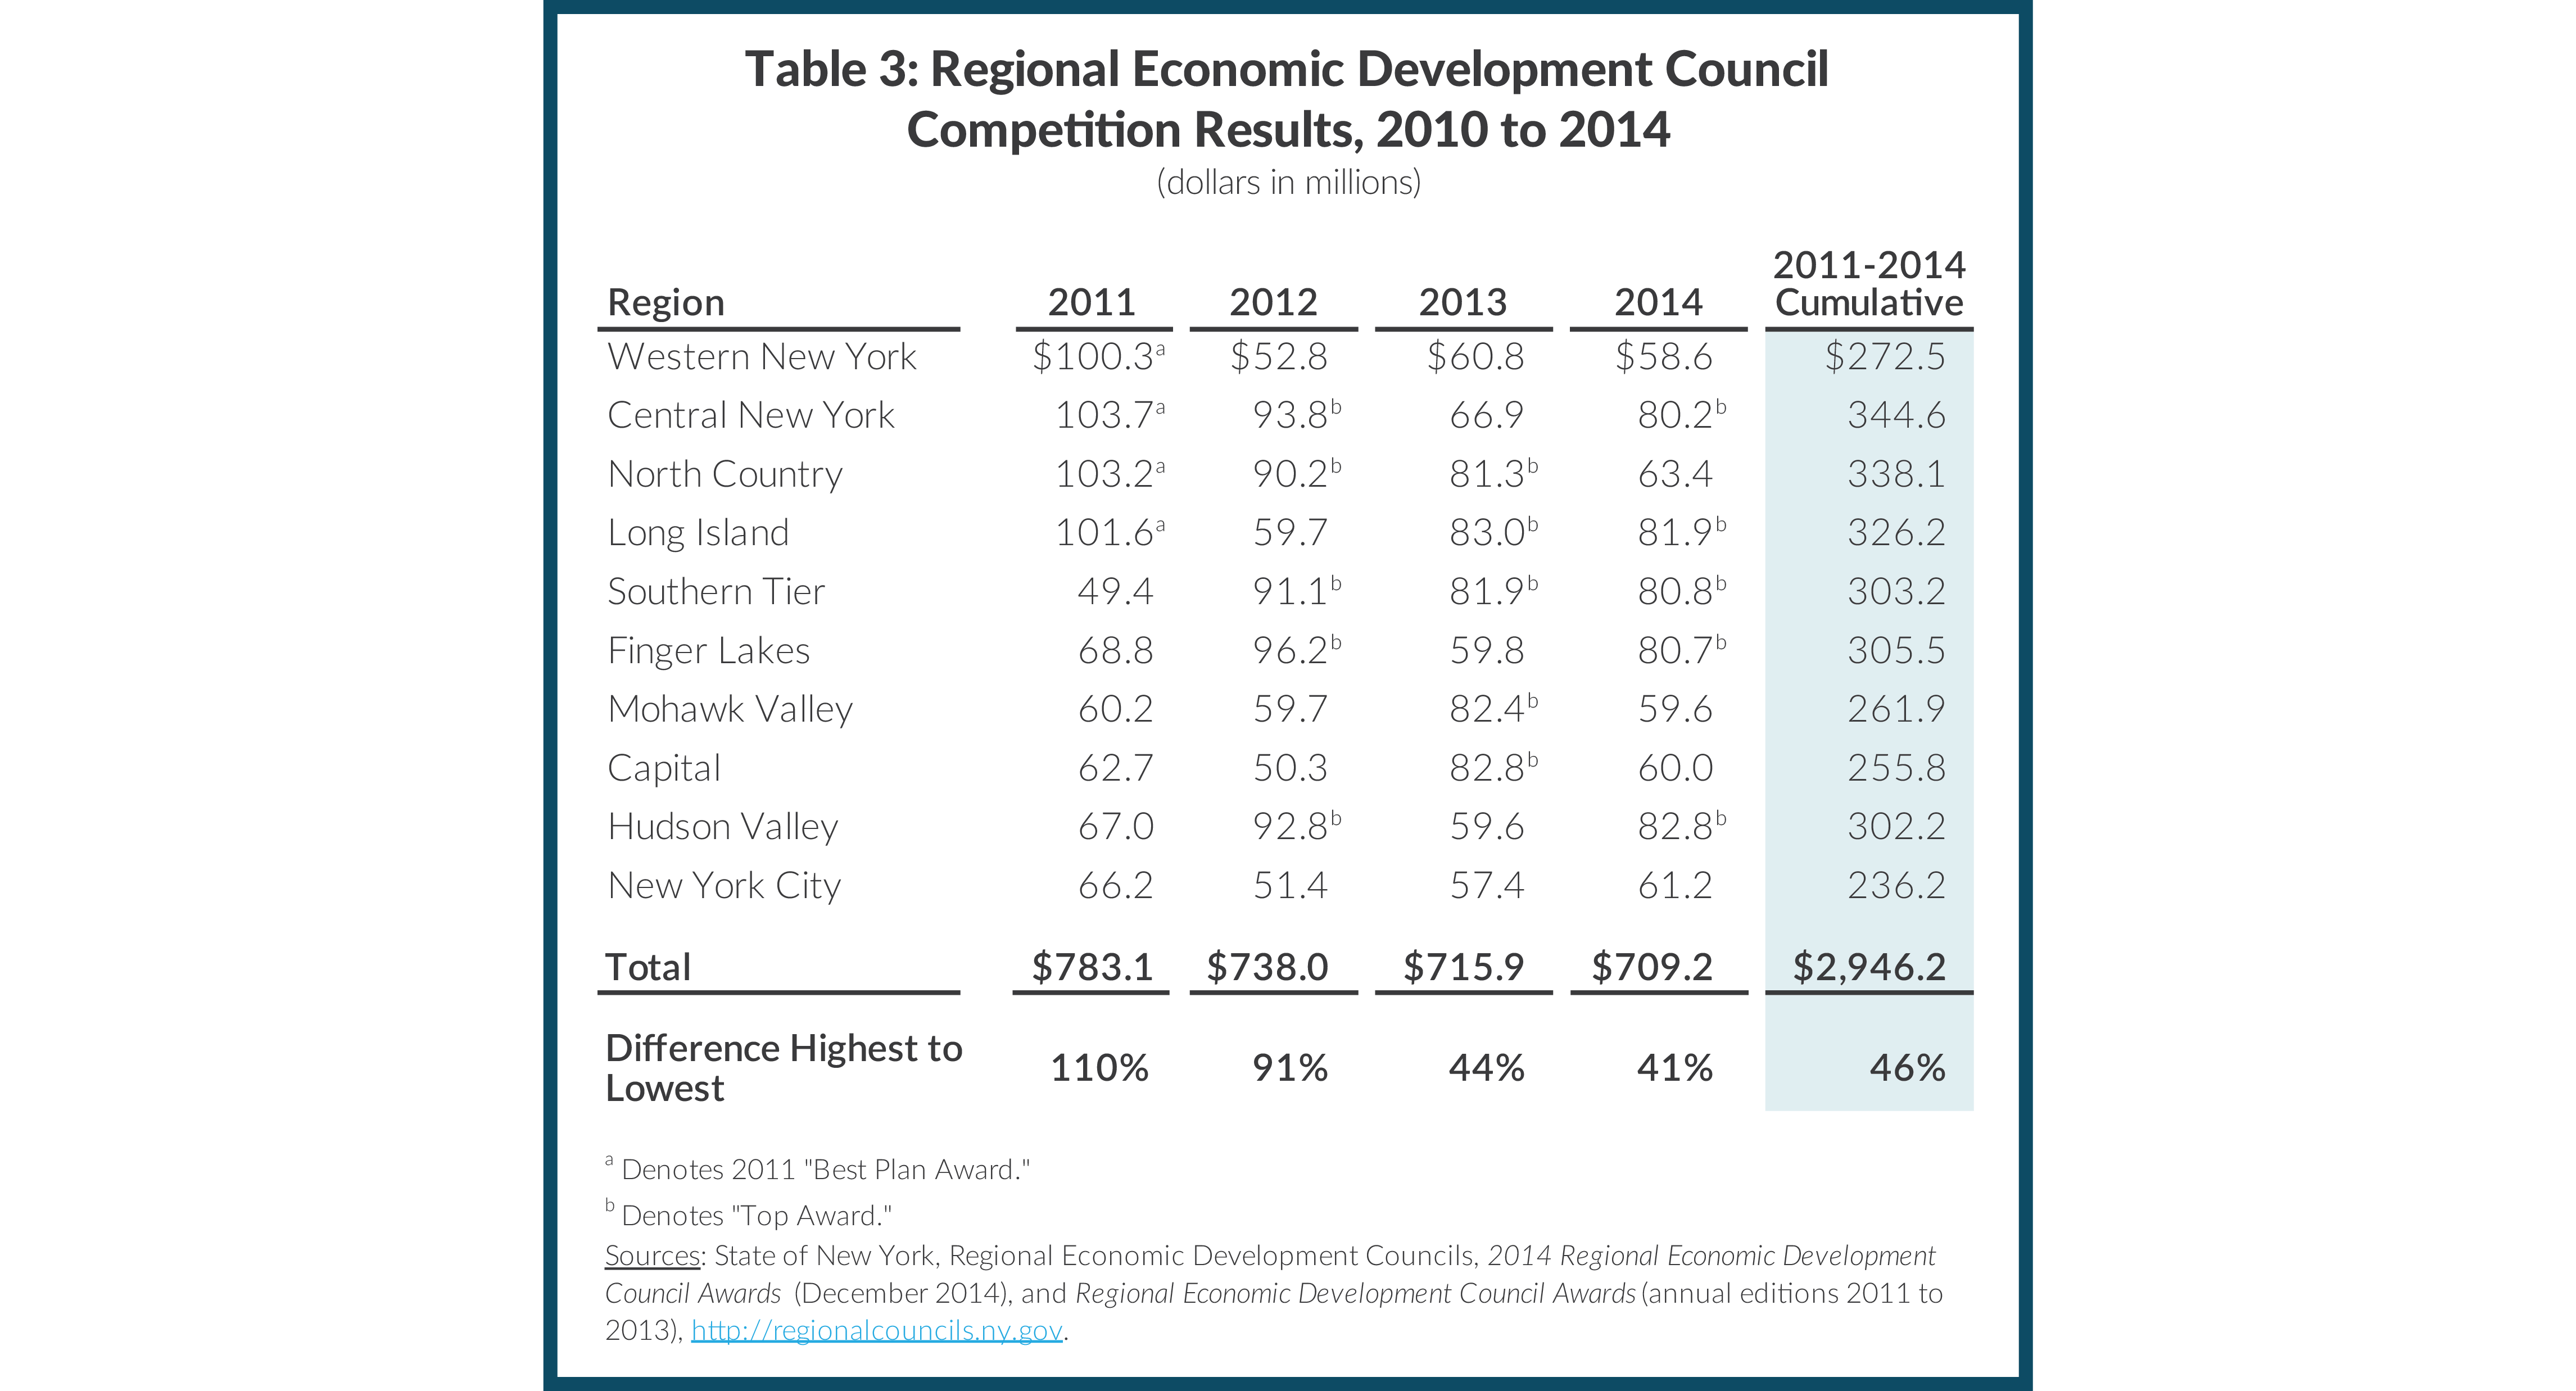
Regional Economic Development Councils (REDCs). The REDCs, formed in 2011, are led by appointed members including representatives from the business, nonprofit, and higher education sectors. Initial members were selected by the Governor’s Office in 2011; as vacancies arise new members are recommended by the REDCs and appointed by the Governor. The function of the REDCs is to formulate regional strategy, align investments with that strategy, measure performance and progress, and coordinate investments across multiple programs. The Councils allocate a mix of credits, capital grants, and various agency funds made available for projects through a consolidated funding application (CFA) portal. Low-cost financing is also available for select projects. Each year the regions compete for a pool of resources, with some regions declared “winners” and awarded larger shares. Over award cycles from 2011 through 2014, the Councils have competed for and been awarded $2.9 billion, or $737 million on average annually, from this mix of sources.
Each Regional Council has a strategic plan, developed at the beginning of the process with public input, and funding is supposed to be matched first with projects designated as high priority in the plans. Strategic plans are expected to address two key questions related to the return on investment:
1) How well are other public, private, and nonprofit funds and investments leveraged?
2) How well do those leveraged funds advance the region’s highest priorities?
Regions were allowed to use their own methodologies for computing the estimated leveraging or return on investment ratios. Leveraging ratios therefore varied from region to region and documentation to judge the likelihood of realizing regional estimates was not made available.
In general, the REDCs have improved the process for allocating economic development funds. They have organized major stakeholders around a strategic plan based on the strengths and weaknesses identified in the region. Performance metrics and reporting are explicitly part of the process. The CFA created a single application for businesses to apply for funding under numerous programs operated by a dozen different agencies. In addition, the REDCs prioritize funding decisions by scoring applications based on their strategies and priorities, which are then combined with separate scores from the funding agencies.
Despite these generally positive aspects of the REDC process, there is room for improvement. Many regions have had difficulty measuring and/or reporting on the selected performance measures. Lags in data availability or complete lack thereof and the multitude of metrics adopted at the regional or sub-regional levels have hindered reporting.17 Project-level reporting has also been limited. Many firms receive more than one type of economic development assistance, and without a combined reporting system such as a unified economic development budget, total costs are not calculable. Consequently, there is no way to ascertain the costs and benefits of each project from the information available.
The regional method is also problematic from the standpoint of improving the statewide return on investment. The best outcome for taxpayers would be achieved if State leaders consistently invested in projects with the highest rate of public return. But concerns about regional parity appear to be undermining efforts to maximize investment returns. After four rounds of competition the difference between the lowest-funded region and the highest is shrinking; in 2011 the difference between the highest- and lowest-funded regions in the annual competition was 110 percent, but by 2014 the difference in award level was 41 percent. (See Table 3.)
Expanding Without Reform
The State expects to have spent $2.8 billion on economic development tax expenditures in fiscal year 2014, a 49 percent increase over 2010.18 While the Governor and Legislature have added new tax breaks, this growth is primarily driven by increases in the State’s existing programs. Expansions of tax credits for film production, brownfields redevelopment, as well as growth in the Investment Tax Credit accounted for $568 million of the increase. These programs are expanding despite ongoing concerns about their efficacy and the presence of loopholes that have allowed programs to be used more broadly than originally intended. Because tax expenditure programs represent foregone revenues and not direct spending, they undergo little scrutiny during the State’s annual budget process.19 Analysts are, at best, skeptical of the benefits these programs claim to deliver. 20
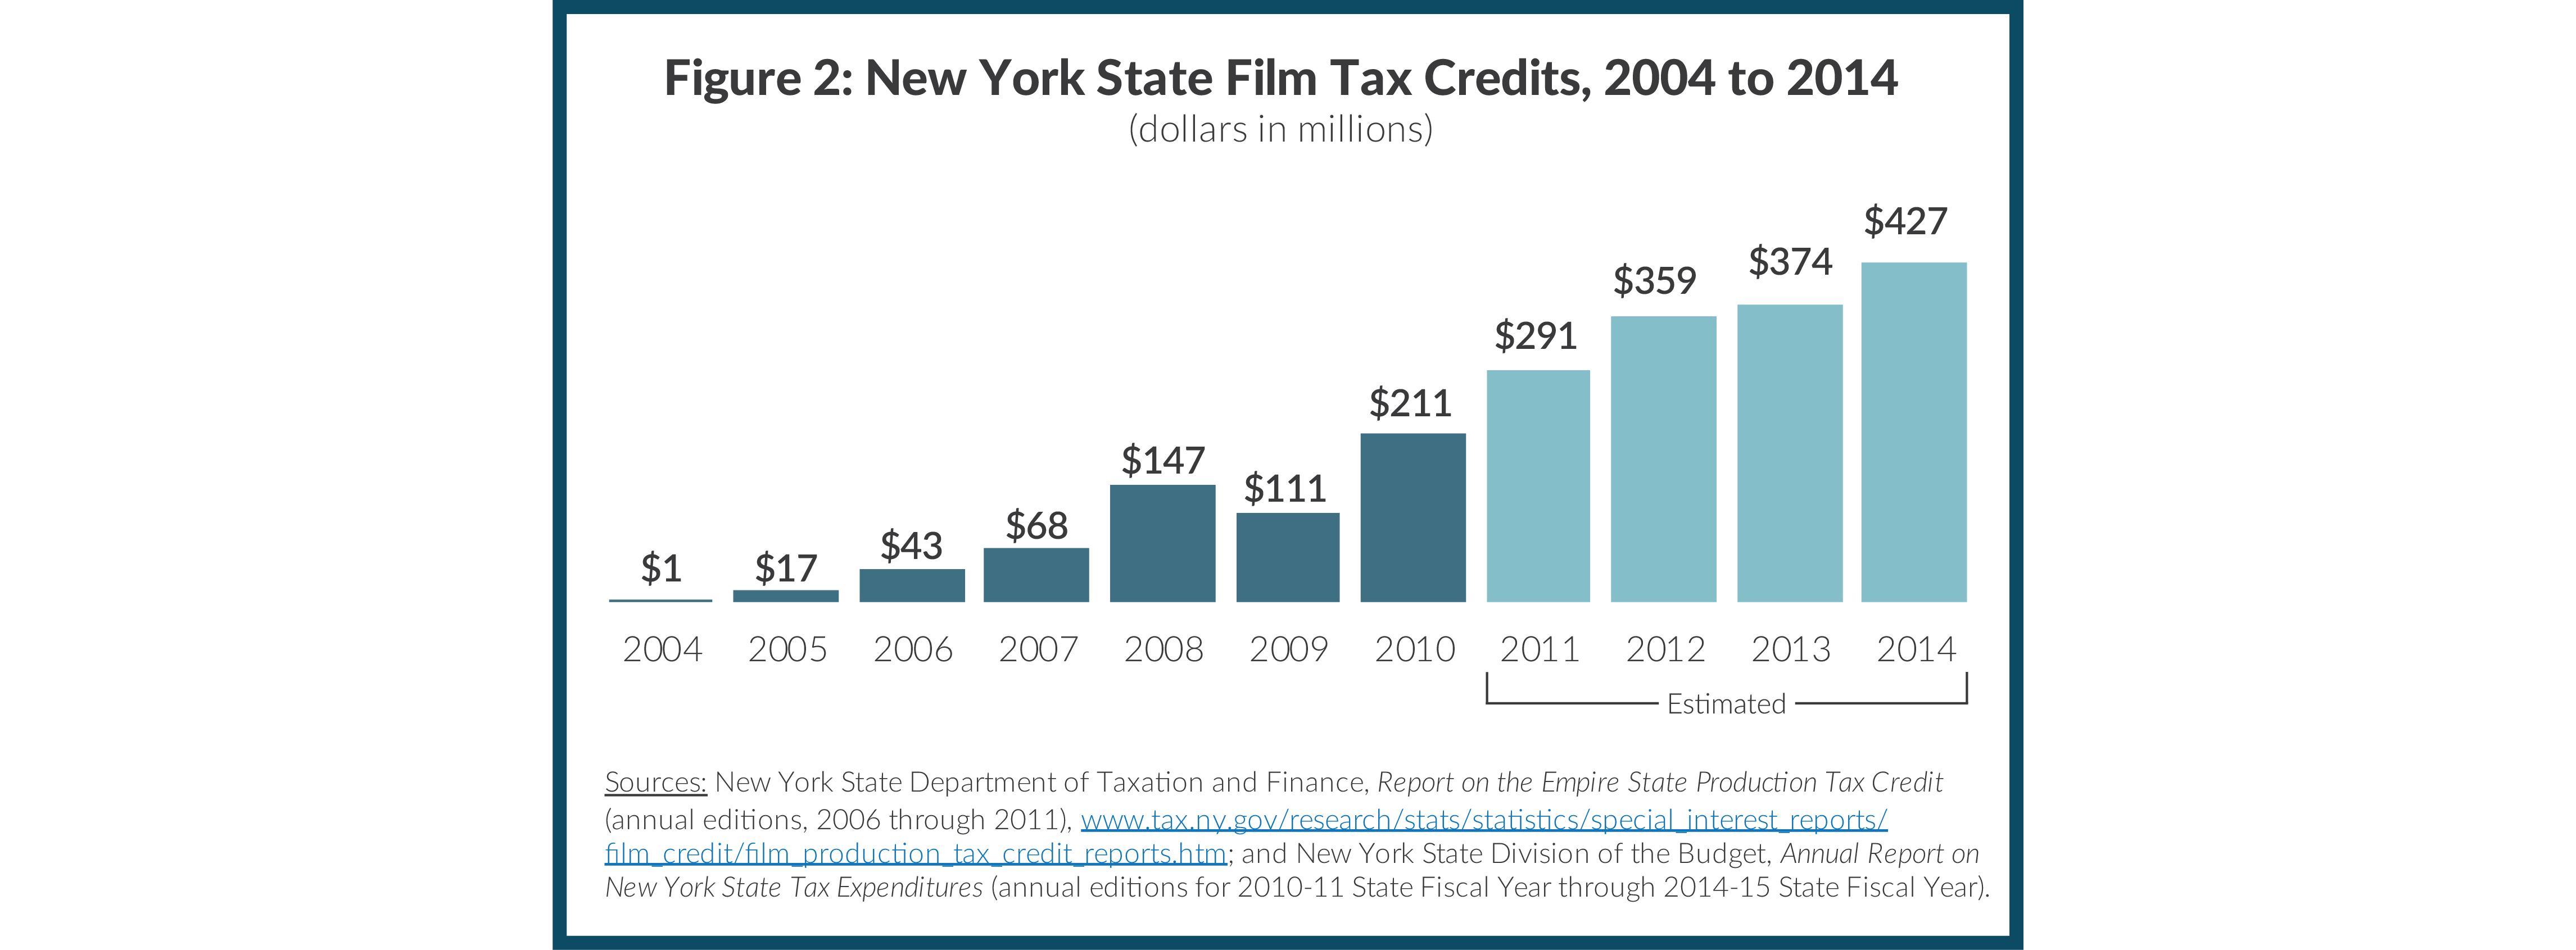
Film Production Tax CreditThe Empire State Film Production credit seeks to promote film and television production in the state. When the legislature created the film credit in 2004, it capped the program’s cost at $25 million annually and spent less than $1 million. In 2010, the latest year for which actual claims data are available, the program had surged, costing the state $211 million and accounting for a larger share of all State tax expenditures than ever before.21 (See Figure 2). In 2014 the credit is estimated to have cost the state $427 million and the cost of these credits is rising sharply. By 2015 the cap will reach $445 million for production and post-production credits. 22 It is expected the program will have cost the State a cumulative $4.5 billion by 2019.23
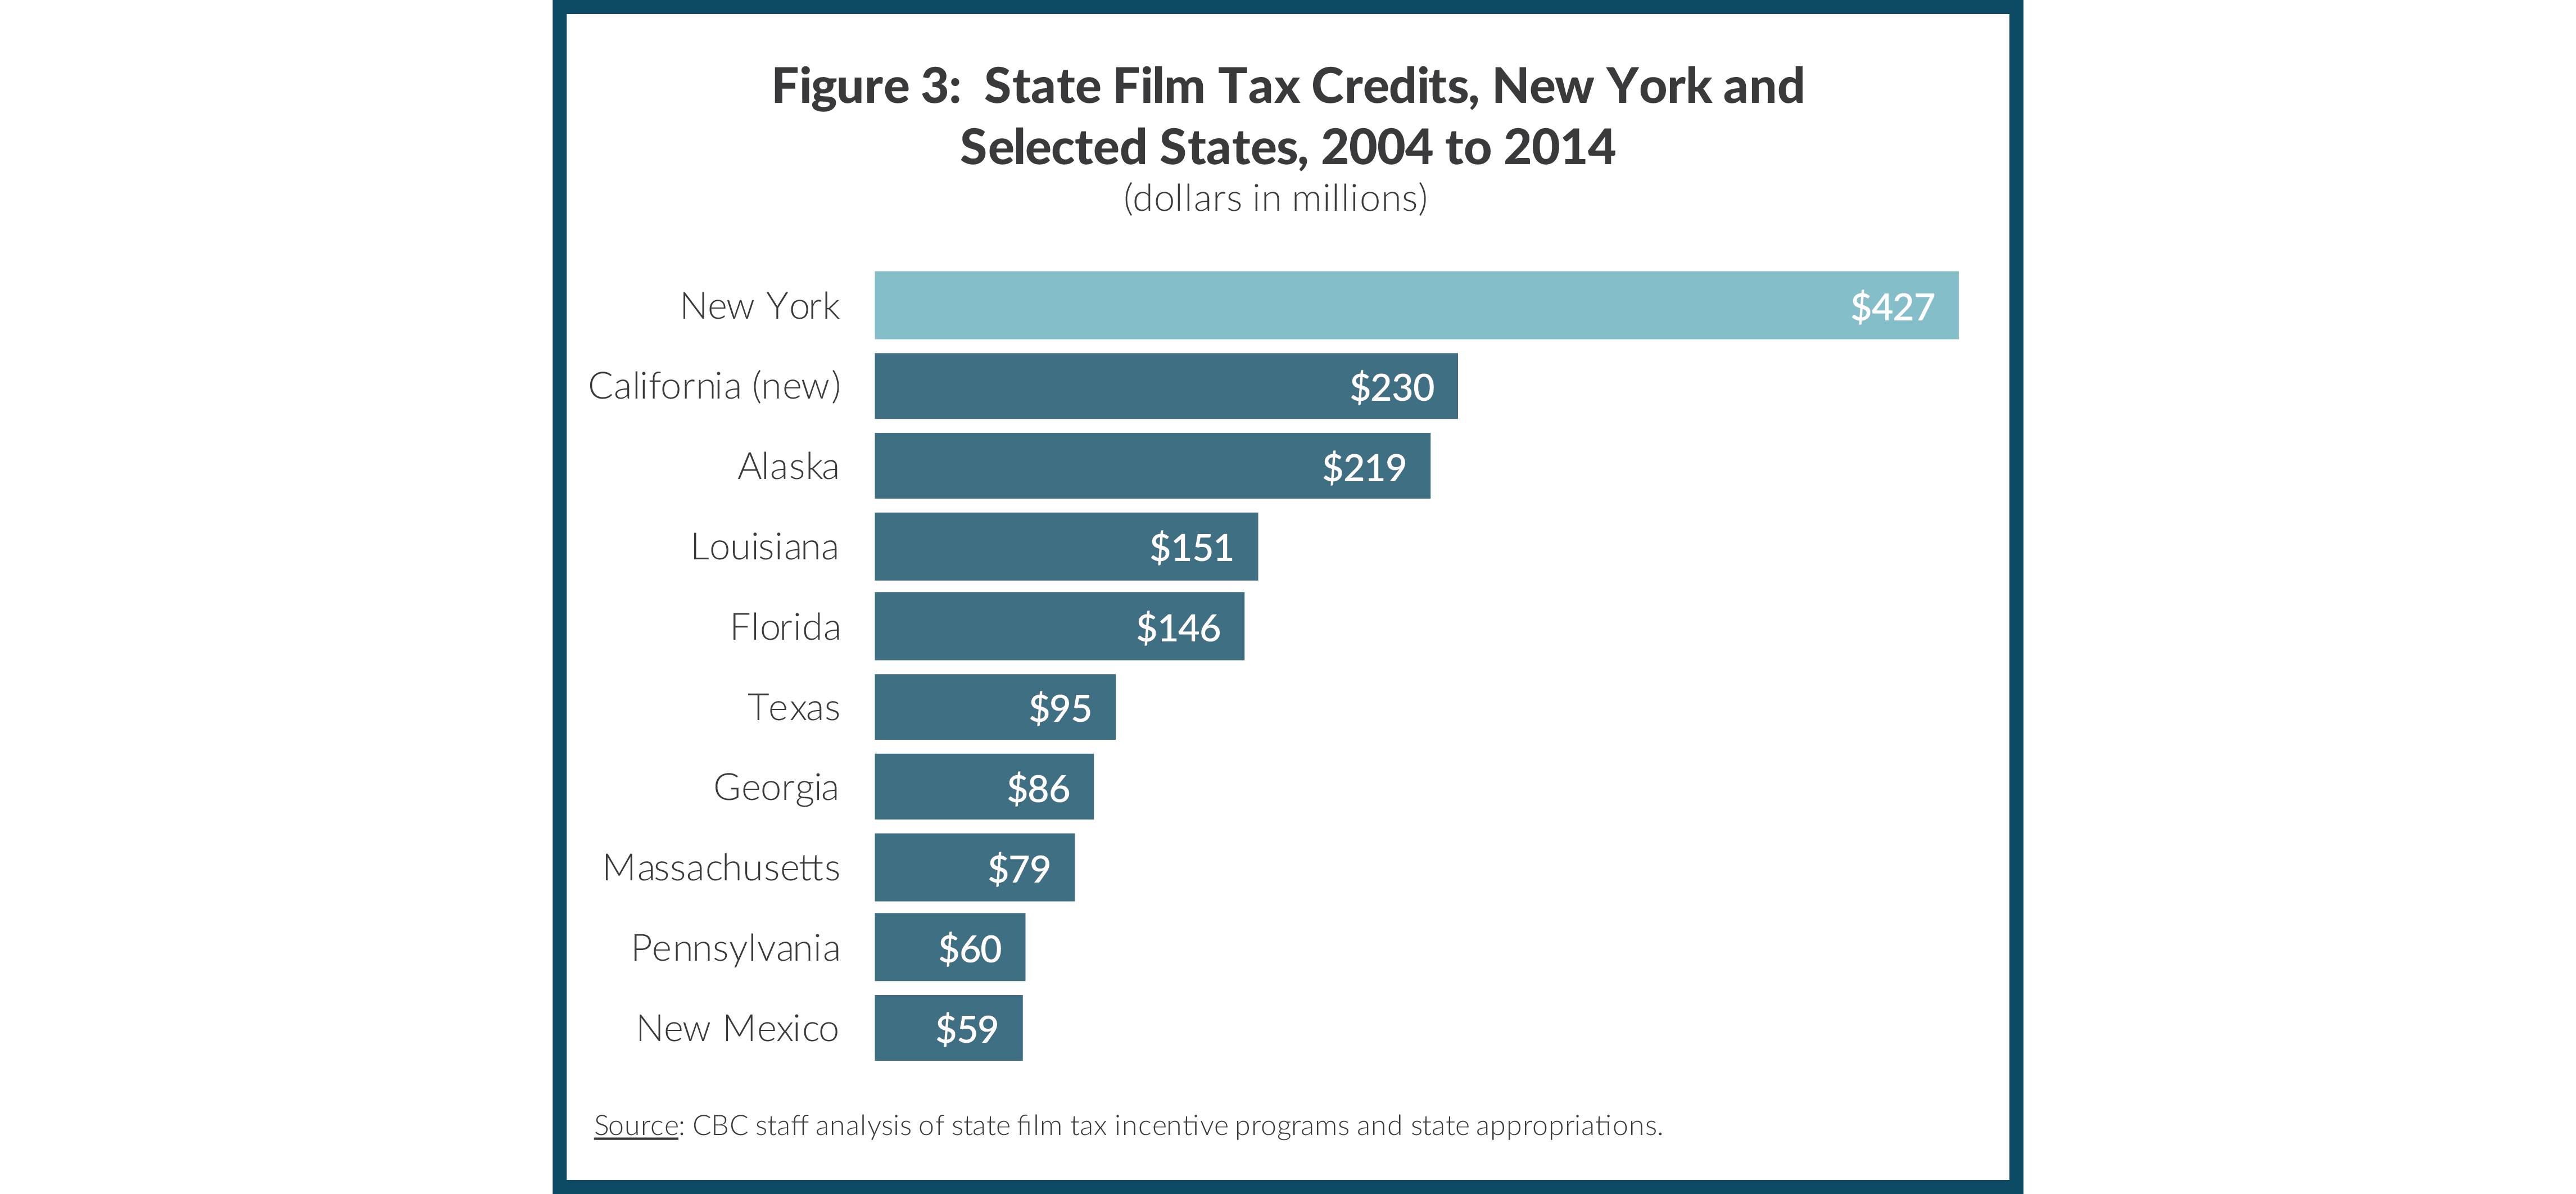
New York’s credit is large relative to those of other states. As of 2014, 37 states offered and funded some sort of film and television production incentive. At an estimated $427 million per year, New York’s incentive is almost double the amount of second place California, which recently expanded its film tax credit from $100 million to $230 million annually.24 (See Figure 3.) While some industry consultant studies show that these credits pay for themselves, others show film tax incentives are losing propositions.25 In response, some states have begun to scale back their programs. In 2013 Connecticut placed a moratorium on awarding new film tax credits.26 In 2014 North Carolina eliminated its film tax incentive program, one of the nation’s most extensive at the time.27 In contrast, in 2009 New York tripled the credit from 10 percent to its current 30 percent of qualified expenses. During Governor Andrew Cuomo’s first term, the post-production credit was created and existing credits were enhanced for upstate productions.28 Beginning in 2015 film and post-production projects will be eligible for an additional credit equal to 10 percent of the wages or salaries of individuals employed or for services performed in selected counties. In addition, the program was opened to relocated talk or variety shows, one of the alleged reasons the Tonight Show moved to New York from California.29
Brownfield Tax Credits. The Brownfields Cleanup Program (BCP) was established in 2005 to encourage the cleanup and redevelopment of brownfields—former industrial or commercial properties where future use may be affected by environmental contamination. The goal of BCP is to induce developers to clean up contaminated sites and return them to the tax rolls; accordingly, brownfields tax credits are designed to help developers with the costs of mitigating a site for reuse.30 New York State’s program has three components: (1) site preparation, (2) groundwater cleanup, and (3) development of the property.31 (See Table 4.)32 Although the first two components relate to mitigation costs, the property development component does not and has allowed developers to claim credits for costs that go far beyond mitigation. For example, one of the largest projects completed under BCP to date was a Ritz Carlton Hotel in White Plains, which claimed $114 million in credits with no reported remediation costs.33
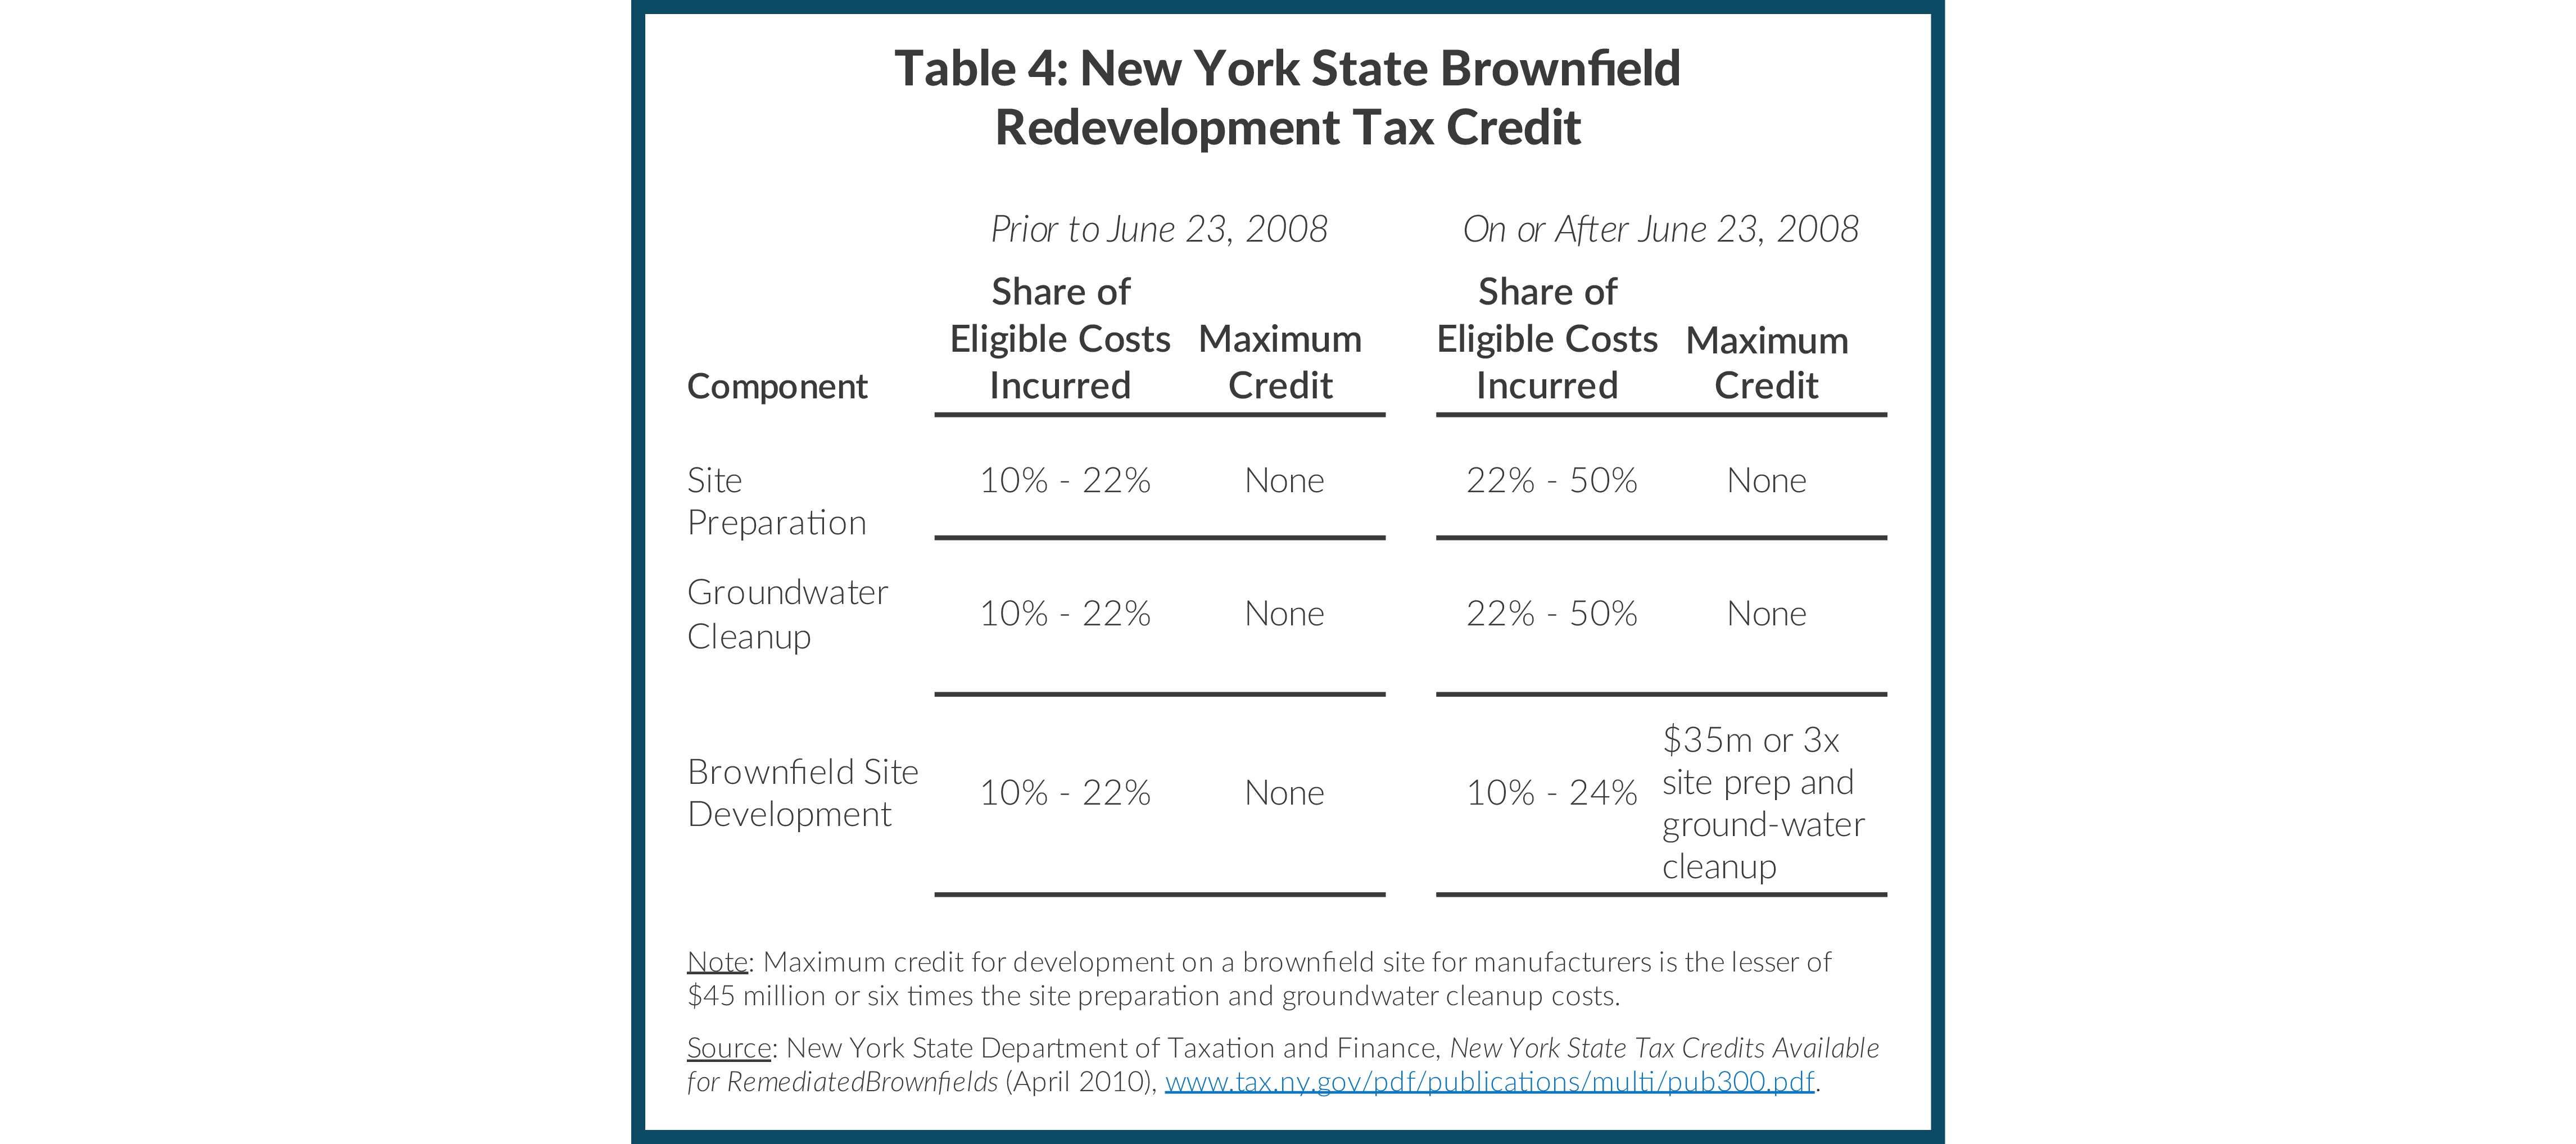
The development component—also called tangible personal property—includes the purchase or construction or renovation of buildings and equipment and does not relate to the property’s remediation.34 The tangible personal property component begins at 10 percent of eligible costs and can range as high as 24 percent.35
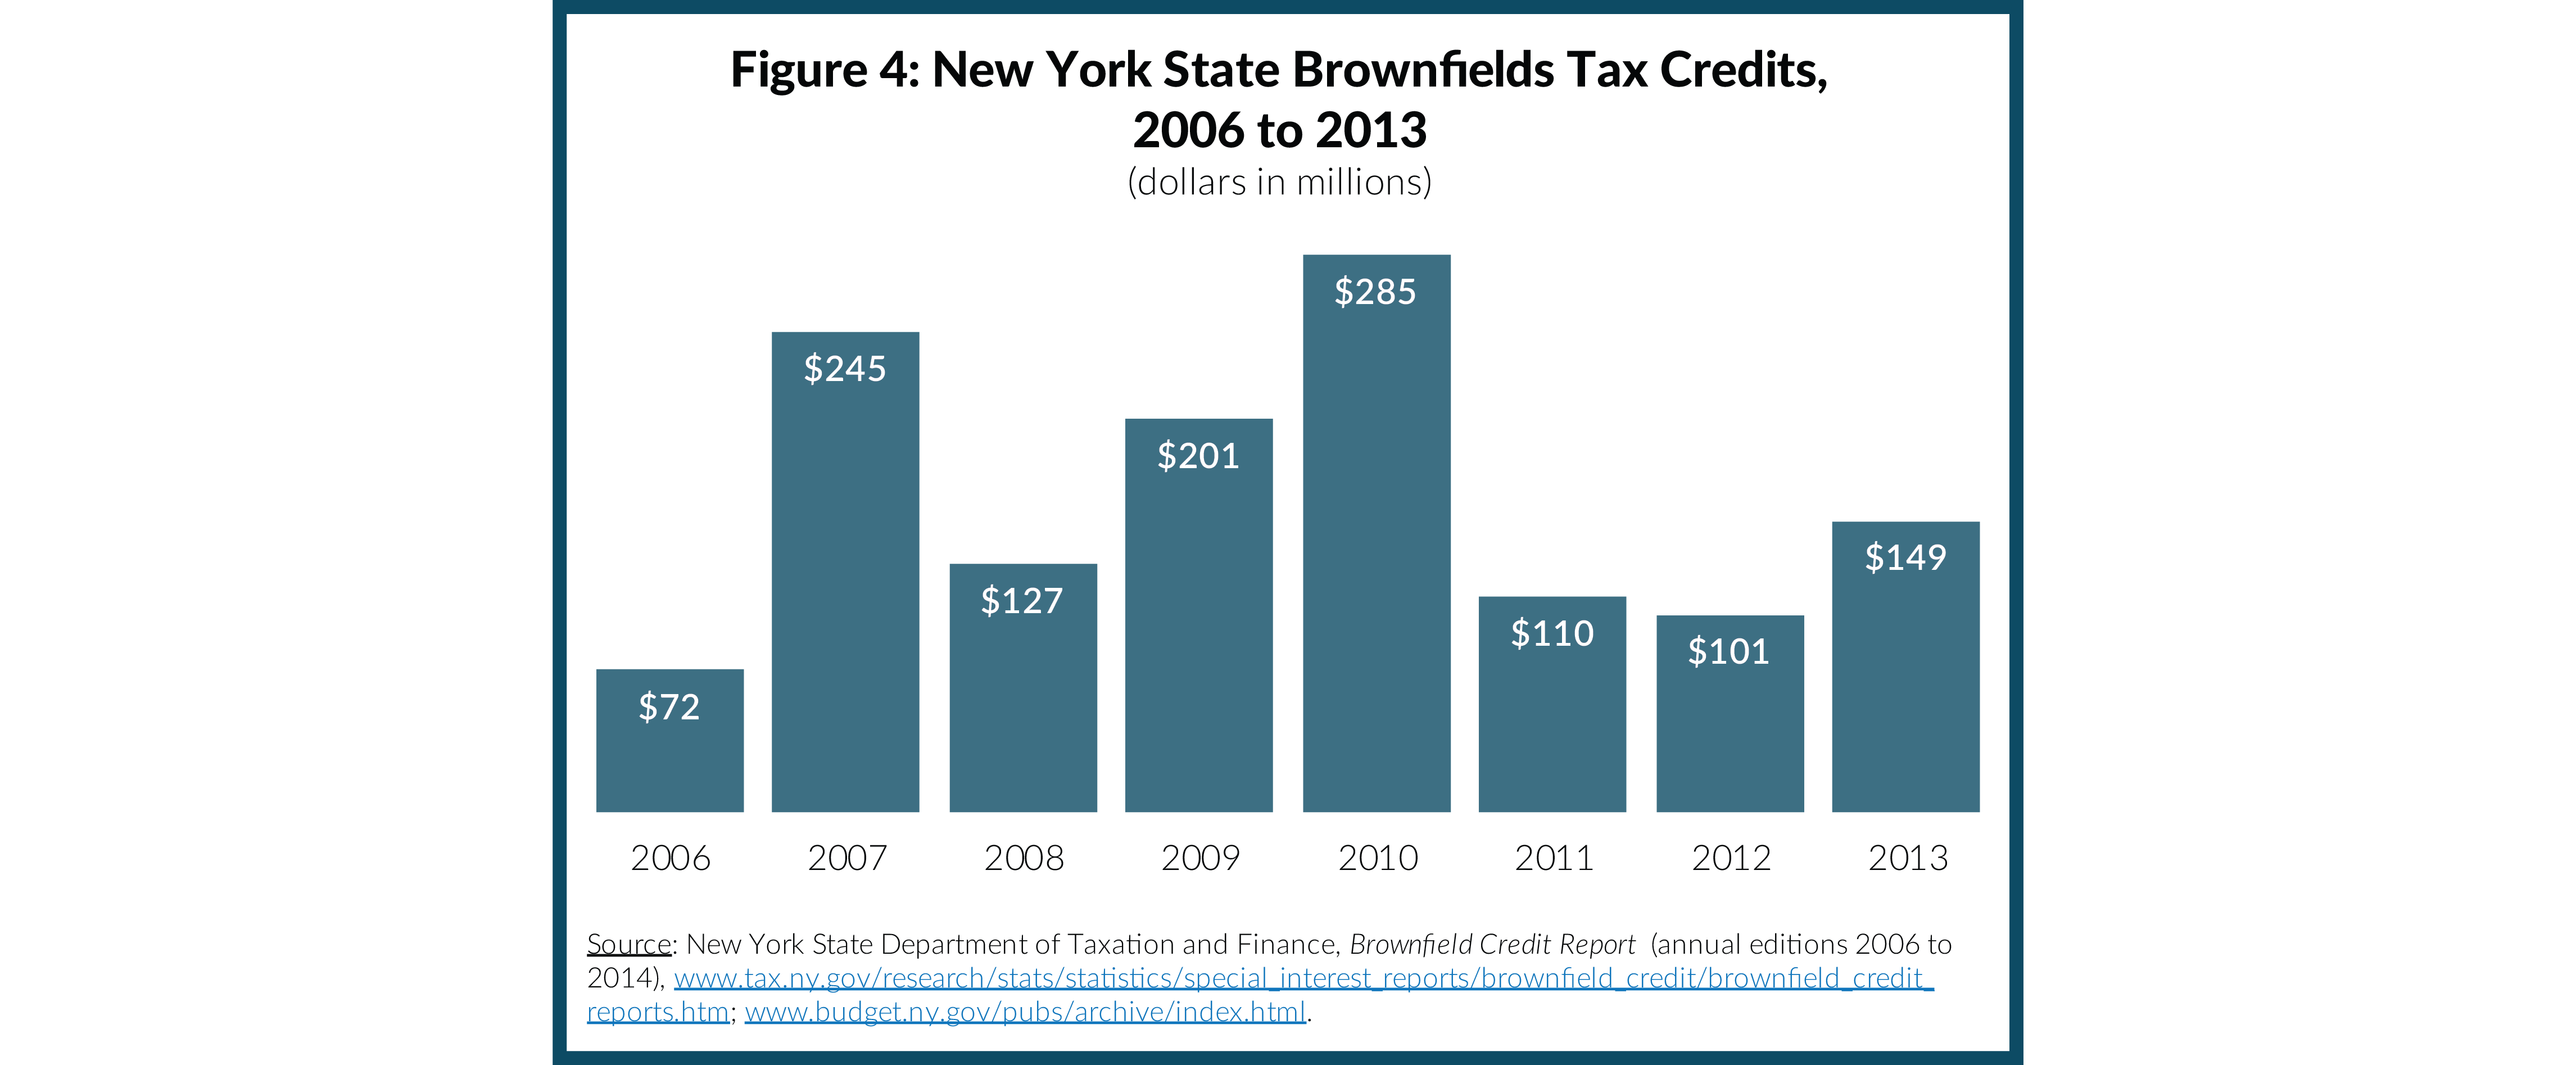
Developers did not begin utilizing brownfields tax credits until 2006, costing the State $72 million. Since then the program’s annual cost has ranged from a high of $285 million in 2010 to a low of $101 million in 2012. (See Figure 4.) The cost of the program in 2013 was $149 million; the estimated cost for 2014 is $500 million, but the final figure is likely to be much lower. The original estimate, prepared in January 2014 included a large allowance for claims by firms for the period prior to 2008 when reforms were made to limit the property development component of the credit to the lesser of $35 million or three times the combined value of groundwater remediation, or the lesser of $45 million or six times the combined value of groundwater and site preparation costs for manufacturing sites. However, these claims are proving much less costly than the State expected. Reflecting lowered expectations for pre-2008 claims the newly released estimate for 2015 is $130 million.36
The growth in the brownfields tax credit is largely attributable to the property development component. From 2007 to 2012, this component of the credit accounted for $934 million of $1,069 million of credits used, or 87 percent. In April 2013 New York State Comptroller Thomas DiNapoli recommended further reducing credit caps, prioritizing credit awards based on need, and restricting credits to site preparation and remediation costs only.37 In November 2013 Governor Cuomo’s Tax Relief and Fairness Commission suggested tightening eligibility standards to yield $35 million in annual savings.38 Governor Cuomo included these reforms in the 2014-2015 Executive Budget seeking also to limit credits to the actual cost of cleanup and only for sites abandoned for at least 10 years or those designated as priority economic development projects.39 The reforms were not adopted; in June lawmakers extended the current program to the end of 2015, but in December 2014 Governor Cuomo vetoed the extension.40 The Executive Budget includes a 10-year extension of the Brownfield Cleanup Program, as well as enhanced eligibility limitations for the tangible property credit.41 The credit would be limited to projects located in high poverty or high unemployment locations (known as “Environmental Zones”), sites where cleanup costs exceed the property value absent contamination, and affordable housing projects.42
Investment Tax Credit. New York began offering an Investment Tax Credit (ITC) in 1969 for the purpose of spurring manufacturers to modernize production facilities and equipment in the state.43 Since then the ITC has been expanded 10 times, growing in depth and scope. Initially designed to induce investment in buildings and equipment used for production, the credit has been expanded to include the rehabilitation of historic barns, film equipment, pollution control, and waste treatment. Moreover, an employment incentive credit has been added. Today the credit is equal to 5 percent of investment up to $350 million and 4 percent of capital investment above $350 million. Eligible costs also include retail enterprise investments in rehabilitated buildings and research and development. Research and development property’s credit is 9 percent and 7 percent of value against corporation franchise tax and personal income tax, respectively. The credit is refundable for new businesses only. The credit is expected to cost the State $163 million in 2014, an increase of 26 percent over the reported cost of $130 million in 2010.44[xxvii] Unlike the Excelsior and brownfields tax credits, the ITC is an as-of-right program open to all eligible taxpayers.
Three facets of the ITC have allowed for its expanded use, and are all problematic. First, the ITC may be claimed on property resold after receiving an initial ITC. Second, new businesses eligible for the credit are defined to include existing business purchased by another company regardless of whether the previous owner had already claimed the ITC. Third, firms are able to carry forward the ITC for up to 15 tax years, leading to substantial accrued liabilities. As of 2013 the State’s unused ITC liability was more than $1.2 billion.45
The New York State Tax Reform and Fairness Commission reviewed the ITC and recommended addressing these weaknesses. By limiting the ITC to manufacturers and eliminating the credit for used property, as well as ending the financial services ITC altogether, the Commission estimated the State could save $95 million annually.46 Similar to brownfields reforms recommended by the Commission, the ITC reforms were included in the 2014-2015 Executive Budget but were not adopted.47 The fiscal year 2015-2016 Executive Budget proposes ending the ITC for financial services firms.
Empire State Development Spending. ESD’s financial statements show expenditures increased from $982 million to $1.3 billion from 2010 to 2014, a change of $292 million, or 30 percent. (Refer to Table 1.) Much of the increase was for capital projects. ESD funds large capital investments, and its disbursements fluctuate from year to year depending on progress on major projects.48 For example, in 2011 ESD disbursed more than $1.5 billion on capital projects, but by fiscal year 2013 disbursements dropped to $612 million, a decrease of 59 percent.49 In 2014 ESD’s capital disbursements increased to $862 million, up 41 percent from 2013.50 Since capital projects are funded with borrowed money, the State’s annual operating budget increases as the debt service costs to pay back the borrowed funds accumulate.
Data from capital plan periods 2005 to 2009 and 2010 to 2014 illustrate the diversity of these investments. (See Figure 5.) From fiscal year 2005 to 2009 ESD’s total capital spending was $1.3 billion. Major projects included $196 million for Yankee Stadium, Citi Field, and the Aqueduct racing facility in Queens, and $186 million was spent on State initiatives for the development of “Tech Valley” around the Center for Nanotechnology at SUNY Albany.51 Additionally, ESD contributed $60 million to higher education projects across the State.
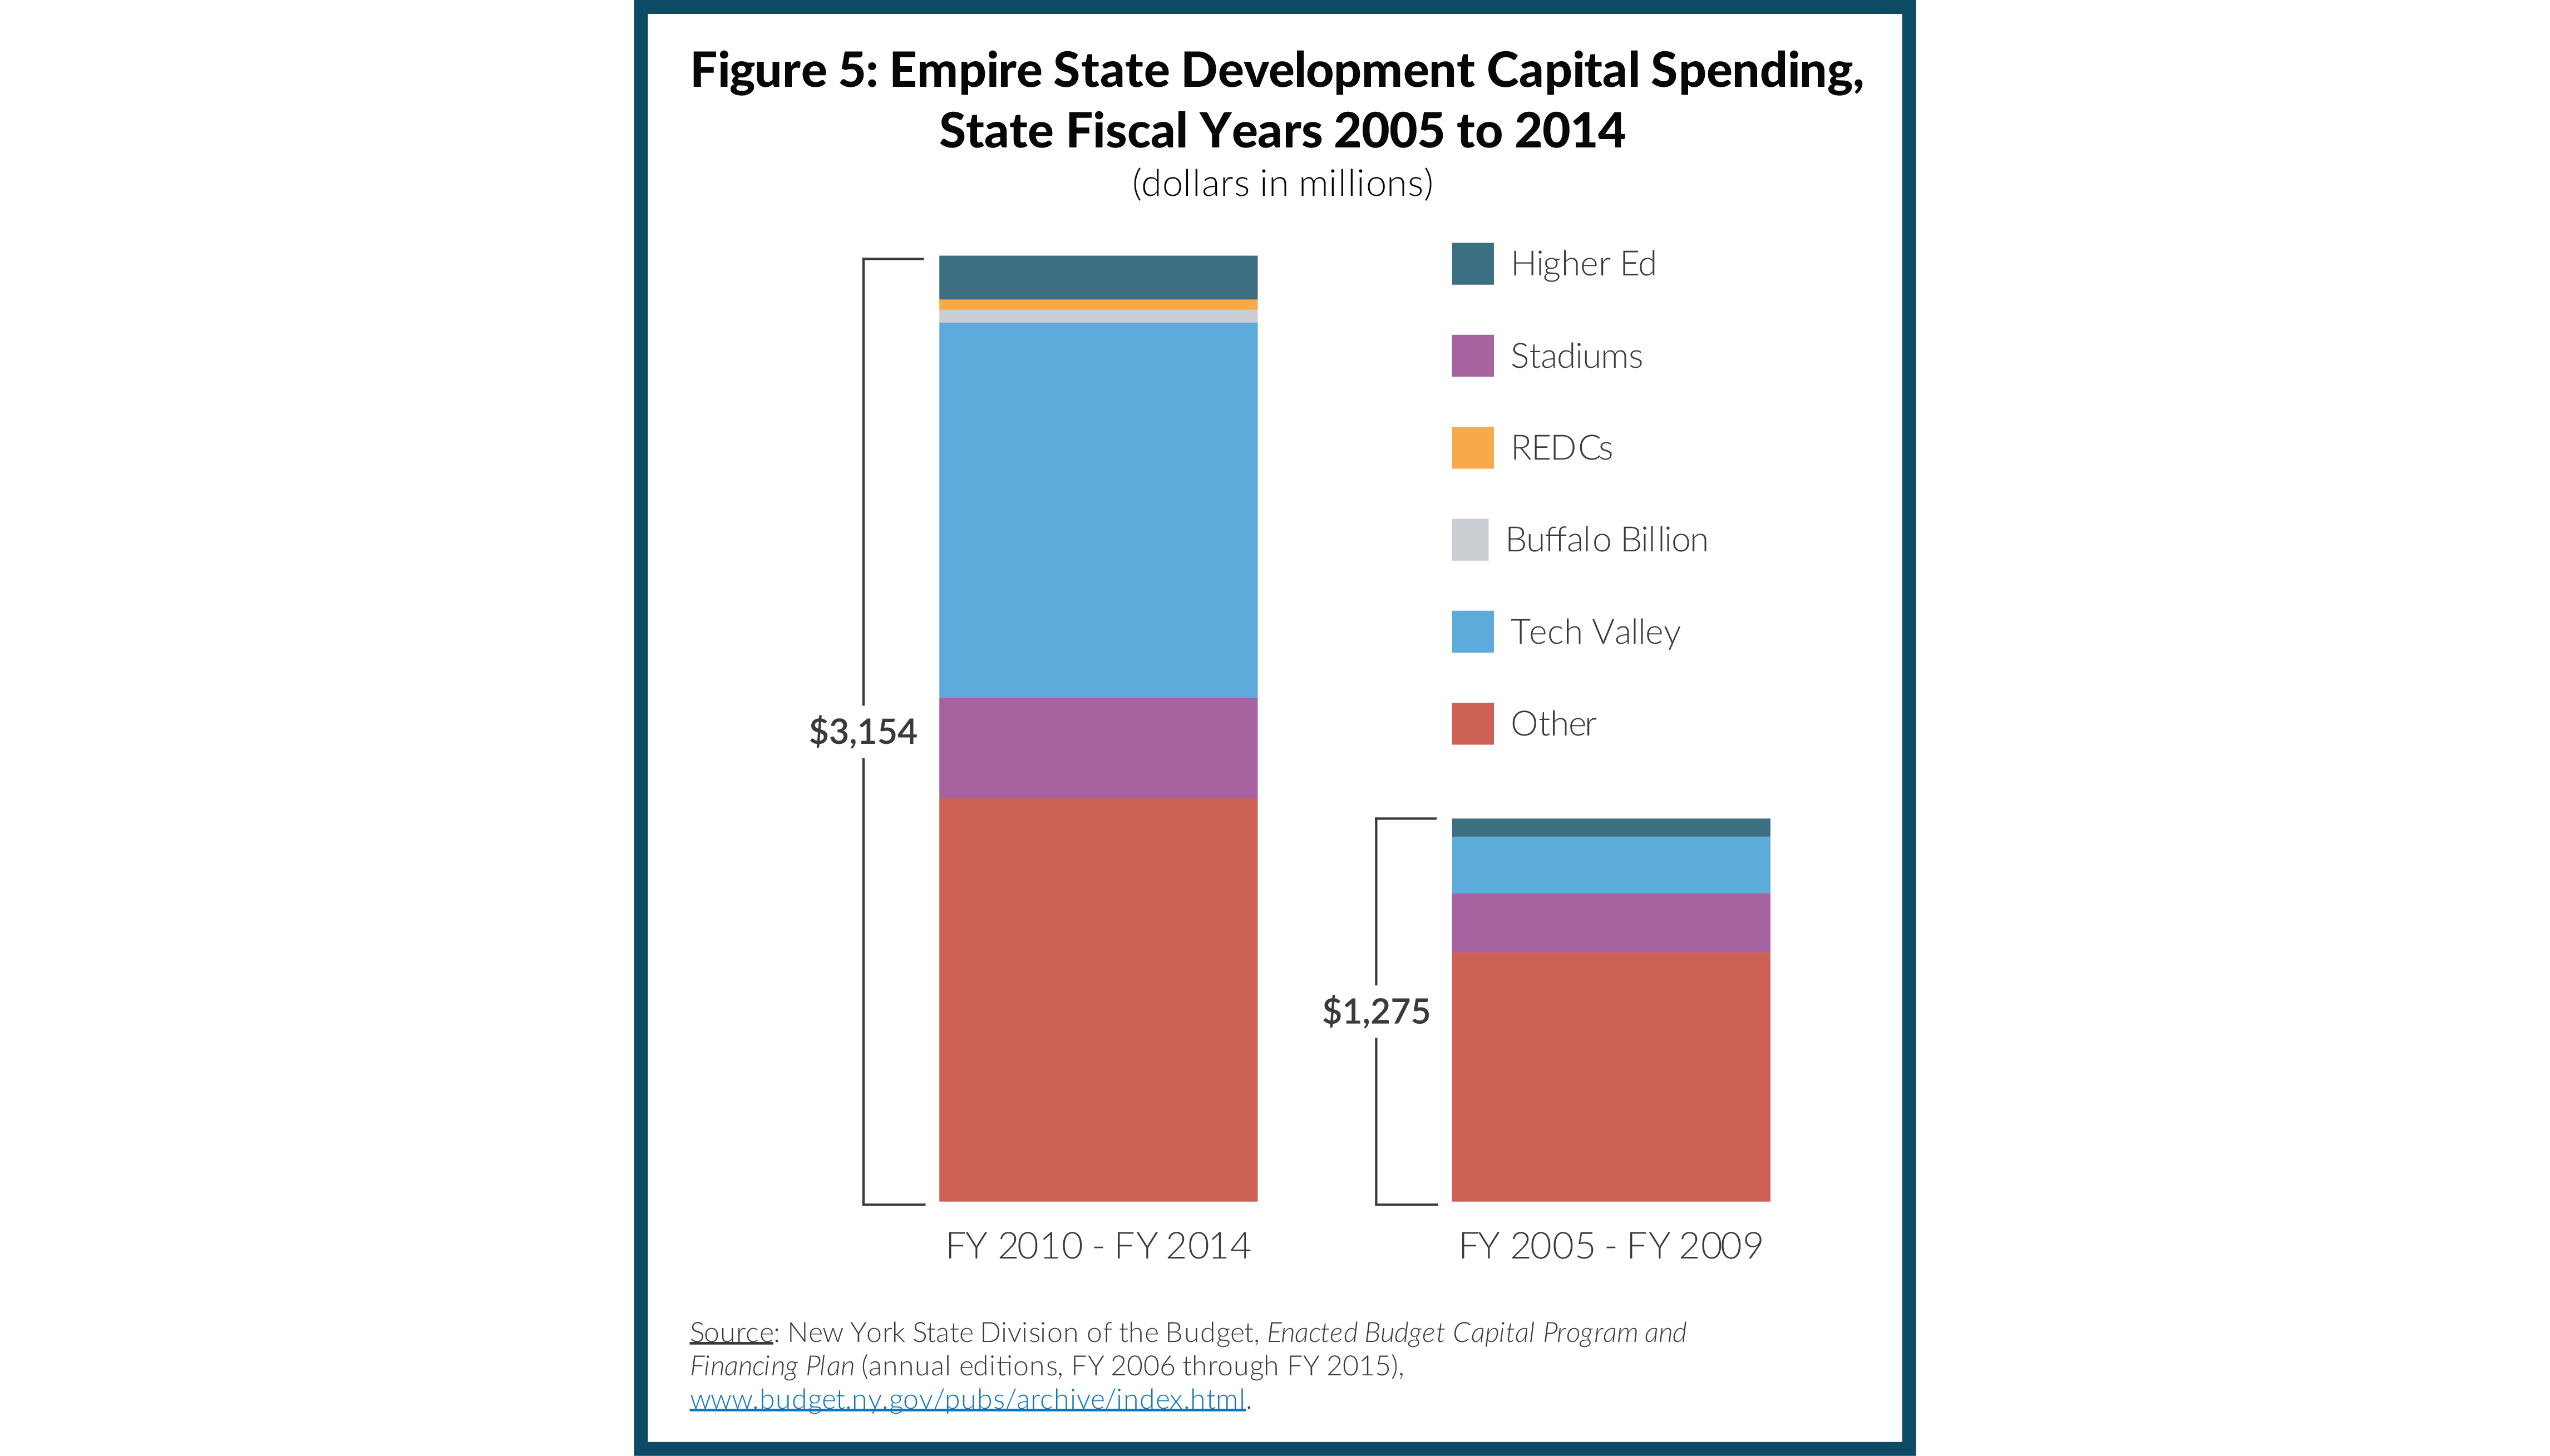
The capital plan for fiscal years 2010 to 2014 was $3.7 billion, an increase of $2.4 billion or 189 percent from the prior plan. ESD spending on Tech Valley projects increased significantly to $1.3 billion in total for large-scale investments such as the development of a semiconductor manufacturing facility ($500 million), the College of Nanoscale Science and Engineering ($249 million), and a chip fabrication research and development facility ($240 million).52 Stadium investments continued, totaling $550 million over the period. Higher education spending also increased with the addition of a matching grants program for campuses participating in “SUNY 2020,” an initiative to incentivize strategic partnerships with business and SUNY. In addition, the “Buffalo Billion,” a set of investments for the Western New York region targeting industries including health technology and renewable energy companies was launched. As of September 2014, ESD has approved more than $240 million in grants for these two concentrations. Capital grants issued under the auspices of the REDCs also began during the period. In fiscal years 2013 and 2014, ESD disbursed $33 million for the first three rounds of REDC capital grants.53
Debt service for economic development and housing (the smallest subcategory available in the State’s capital plan) increased from $350 million to $762 million from fiscal years 2005 to 2014, growth of 101 percent over the 10-year period. In comparison, debt service for all other functions grew by 63 percent; overall debt service increased 68 percent.54
Small, New Programs with the Potential to Expand
Beyond expanding the size and scope of many existing economic development tax incentives, Governor Cuomo and the Legislature have created new programs. These include START-UP New York; the economic transformation program for the redevelopment of closed prison facilities; Innovation Hot Spots; and sales tax-free shopping in “Taste NY” stores filled with New York’s agricultural products. Although these programs are small now, they have the potential to cost the State much more as they expand. But their economic benefit is unclear. The most problematic of the new programs is START-UP New York.
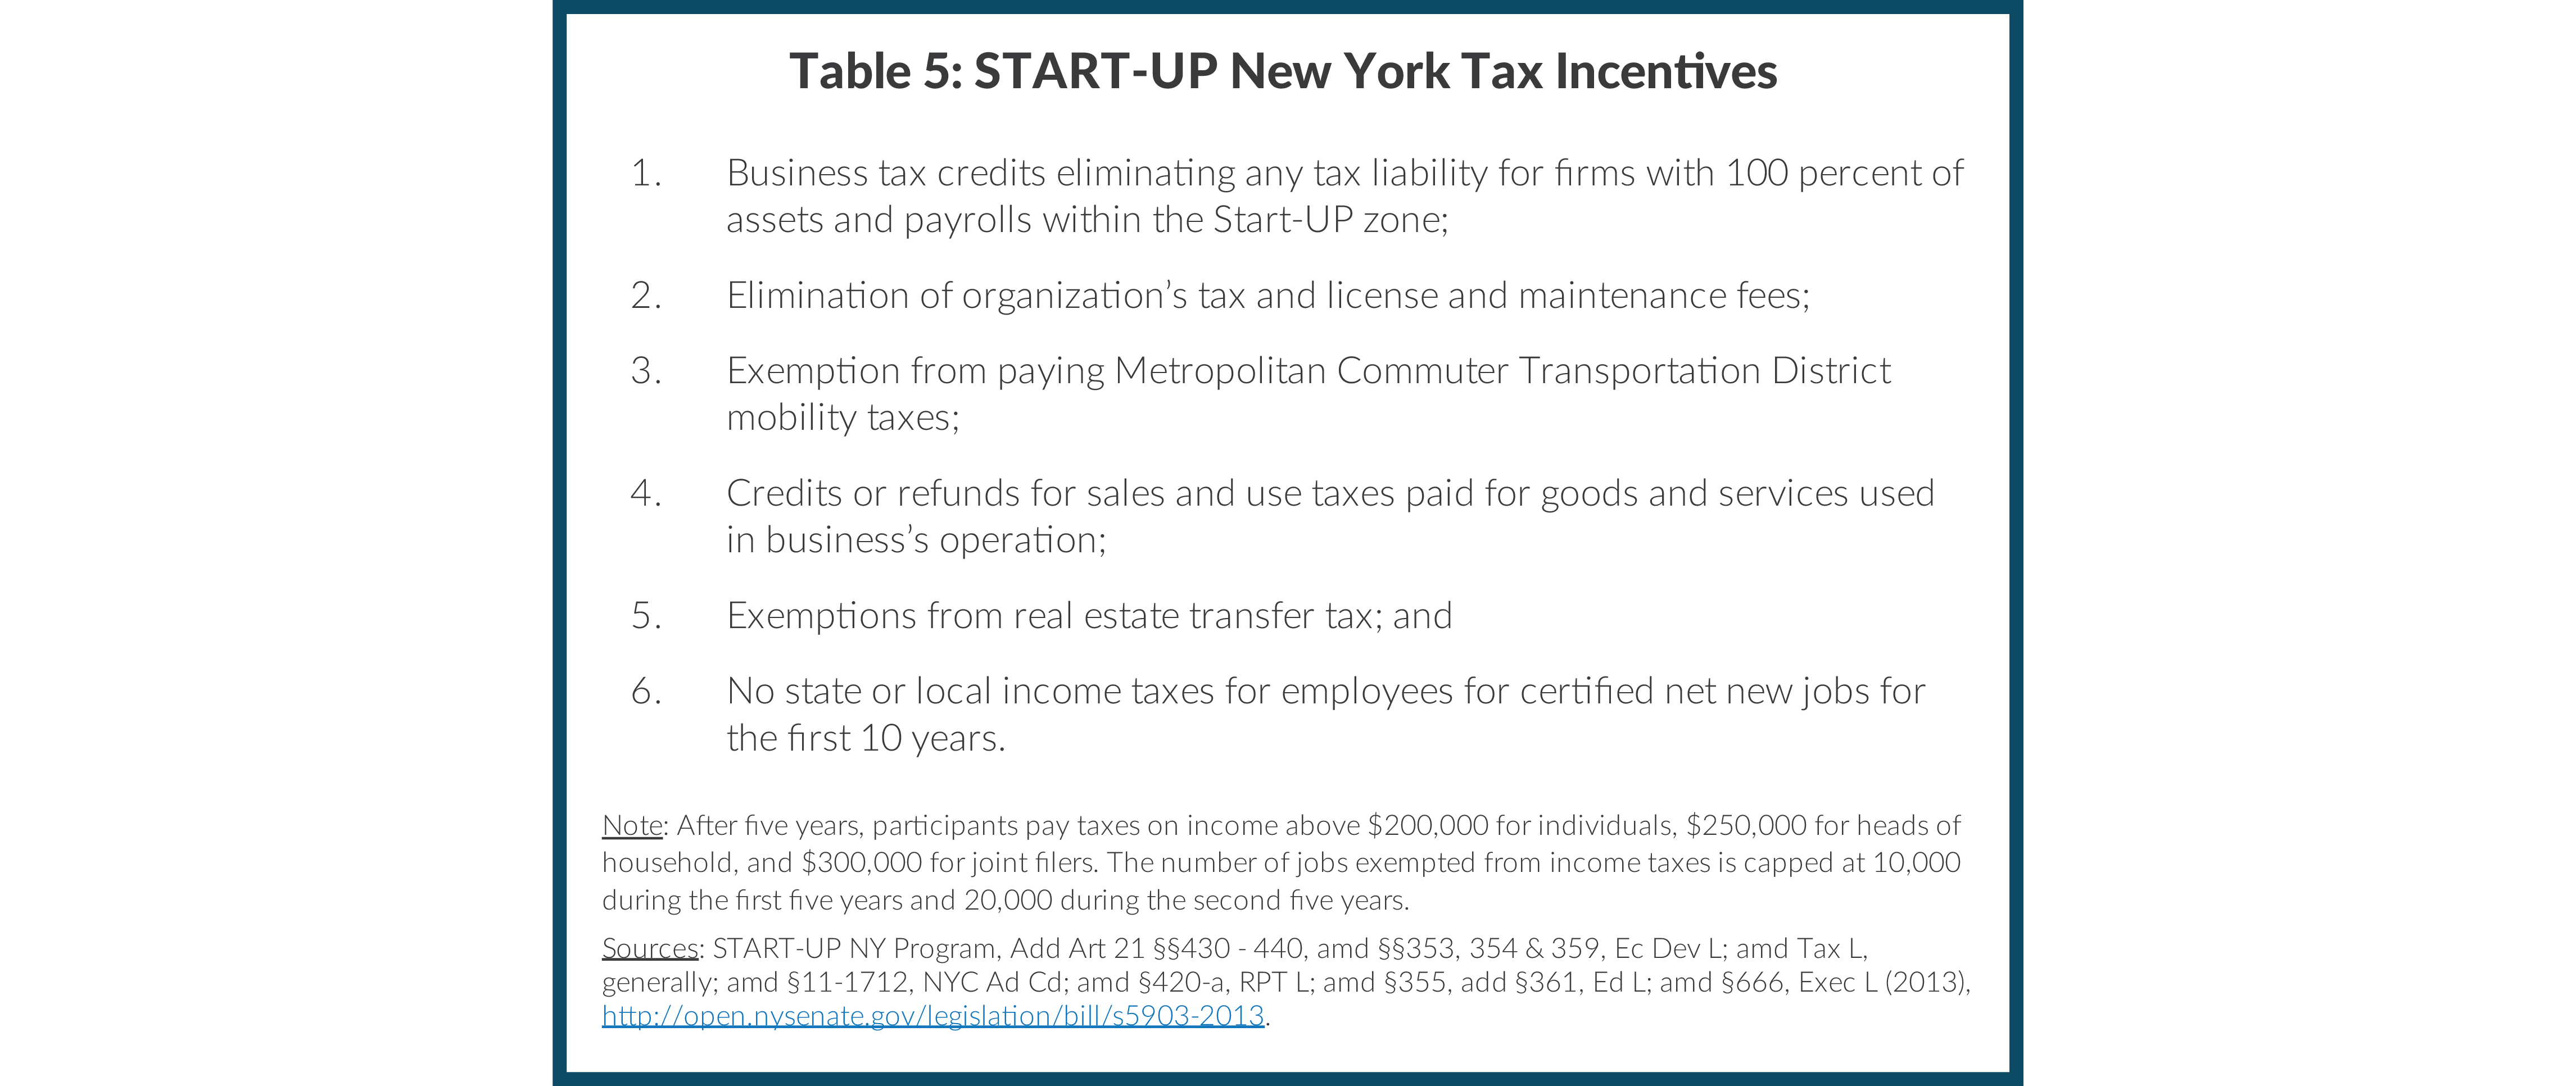
START-UP New York. Established in June 2013, START-UP creates a package of six economic development incentives for companies locating within identified tax-free areas. (See Table 5.) The goal of the program is to induce companies to relocate or expand their businesses in New York by exempting them from most state and local taxes and fees for up to 10 years.55
According to the enabling legislation, any vacant space in any building, or vacant land, located on a state university campus, community college, or city university campus may become a tax-free area. Moreover, 200,000 square feet of land or building space may be considered a tax-free area so long as it is within one mile of a campus.56 Private universities may apply for tax-free areas on campuses. 57 The START-UP New York Approval Board comprised of members appointed by the Governor can also name up to 20 strategic state assets that may include up to 200,000 square feet of land and space for tax-free areas.58
The State continues to add tax-free areas. In September 2014, the New York University Polytechnic School of Engineering’s three start-up business incubators in Lower Manhattan and downtown Brooklyn, two of the most desirable locations in the State, were added. In October the State committed to admitting sites around a green energy cluster located in Buffalo named RiverBend as tax-free areas.59 Currently, START-UP’s website lists more than 250 tax-free properties at 44 public universities, community colleges, and private higher education institutions in the state.
The initial estimate prepared by the Division of the Budget indicated that START-UP carried no cost to the State; the sites were to be on tax-free land, no upfront grants would be provided, and all businesses entering the program were expected to be new.60 But by the first quarterly update released by the Division of the Budget after the program’s adoption, receipts were revised downward by $323 million for fiscal years 2015 through 2017, with annual costs projected to reach $150 million by fiscal year 2017. The cost estimate for 2014 is $59 million.61
START-UP is problematic for three reasons. First, the geographic boundaries of the program distort economic activity. Existing businesses just outside the zones will be at significant competitive disadvantage and economic activity in immediately adjacent areas may be suppressed.62 The danger that the program will balloon is high; as businesses close to the boundaries seek inclusion, as they did under the Empire Zones, pressure will mount to expand the program. As Empires Zones were created or stretched to assist developers seeking benefits, the number of options for qualifying for the program grew from 1 to 15 and the number of zones expanded from 10 to 82; a similar dynamic will likely occur in this program.63 Second, sites added in the name of regional equity will offer START-UP’s deep benefits for firms in areas where they are not needed. NYU’s incubator locations in Lower Manhattan and downtown Brooklyn are two high-profile examples of unwarranted expansion. Finally, to the extent businesses that locate within zones are lured from taxable locations to tax-free zones the program will have a detrimental impact on local governments. Since qualifying firms are exempt from local taxes, jurisdictions levying income taxes and the Metropolitan Transportation Authority may also experience revenue losses.
Other Small Programs Proliferating. Other smaller economic development programs have been adopted. These include the Economic Transformation and Facility Redevelopment Program, which encourages development in areas impacted by closed correctional and juvenile justice facilities, and the Innovation Hot Spots and Business Incubator Program, which provides tax breaks for five years to new technology firms with connections to higher education institutions. The State also implemented the Market NY grant program to fund regional tourism campaigns and Taste NY to promote locally-produced food and beverage products. Small-scale programs like these are likely to continue to proliferate although there is little reason to believe they will add economic value. For example, before the first round of Hot Spots could even be evaluated the program was expanded with the addition of five new Hot Spots on December 11, 2014, as part of the fourth round of funding for the REDCs.64
Conclusion
Economic development has been a major focus of Governor Andrew Cuomo’s first term, and the growth in investments is likely to continue. Although modest reforms have been adopted, most investments continue to be problematic with insufficient accountability and a lack of evidence-based targeting of incentives. The fundamental question of whether business activity has been induced by the governmental assistance provided by any and all of these programs remains unanswered.
To improve the cost-effectiveness of the State’s large investment in this area, the framework for designing and evaluating economic development programs identified by CBC in 2011 should be utilized. All investments should be coordinated and aligned to regional strategies, performance metrics should be standardized for all programs and across all regions, and more comprehensive disclosure requirements should be put in place so that the costs and benefits of each project can be weighed. In addition, all programs should be reevaluated for effectiveness before existing programs are increased or new ones are added. Four years into the Cuomo administration, economic development programs in New York are certainly bigger, and now they should be made better.
Footnotes
- See Citizens Budget Commission, Recommendations for the Next Round of Economic Development Awards (October 2012), www.cbcny.org/sites/default/files/REPORT_EconDev_10112012.pdf; Citizens Budget Commission, Avoiding Past Mistakes: Principles for Governing Regional Economic Development Councils (September 2011), www.cbcny.org/sites/default/files/REPORT_RegionalCouncils_09132011.pdf; Citizens Budget Commission, Overhauling the New York Power Authority’s Economic Development Programs (September 2009), www.cbcny.org/sites/default/files/NYPA_Report_FINAL.pdf; and Citizens Budget Commission, It’s Time to End New York State’s Empire Zone Program (December 2008), www.cbcny.org/sites/default/files/report_ez_12012009.pdf.
- At its zenith, the Empire Zone program cost the State nearly $1billion per year and suffered from three problems. First, the Empire Zones proliferated rapidly. The program began in 1986 with 10 zones based on census tracts with high poverty and unemployment rates. By 2005 eligibility criteria had loosened to provide 15 different options for entering the program. Moreover, program administrators began to alter the boundaries of zones to meet the needs of particular firms, further diminishing the geographic concentration of economic development resources. Second, accountability and oversight, products of shared administration between State and local officials, were limited, resulting in inconsistent enforcement, particularly of job creation targets. Third, Empire Zones were ineffective, rewarding many participants who fell short of job creation and investment goals. Participants continue to cash in unused credits: in 2014 the State expects lost revenues of $269 million due to Empire Zone tax credits. See New York State Division of the Budget, Annual Report on New York State Tax Expenditures 2014-15 State Fiscal Year (2014), www.budget.ny.gov/pubs/executive/eBudget1415/fy1415ter/TaxExpenditure2014-15.pdf; and Citizens Budget Commission, It’s Time to End New York State’s Empire Zone Program (December 2008), www.cbcny.org/sites/default/files/report_ez_12012009.pdf.
- Empire State Development, Excelsior Job Program Overview (accessed February 15, 2015) p. 1, http://esd.ny.gov/_private/BusinessPrograms/Data/Excelsior/ExcelsiorJobsProgramOverview02282014.pdf.
- New York State Department of Taxation and Finance, Instructions for Form CT-607, Claim for Excelsior Jobs Program Tax Credit (2014), p. 2, http://www.tax.ny.gov/pdf/current_forms/ct/ct607i.pdf.
- As credits may last up to 10 years these $50 million annual allocations accumulate.
- Some applicants have more than one admission.
- Transportation, Economic Development, and Environmental Conservation Budget Bills, New York Chapter 59 of the Laws of 2010.
- In order to participate companies must open their records to State officials to ensure planned commitments are realized. If a participant fails to fully satisfy job creation projections, credits are reduced proportionally; if participants fail to reach at least 75 percent of job creation projections they earn no credits. ESD may also recapture previous credits granted to firms provisionally as well as remove firms from the program for failing to meet eligibility requirements.
- Utilities were also authorized to offer discounted service to Excelsior participants. See: New York State Department of Taxation and Finance, Office of Tax Policy and Analysis, Summary of Tax Provisions in SFY 2011-12 Budget (April 2011), pp. 6-7, www.tax.ny.gov/pdf/stats/sumprovisions/summary_of_2011_12_tax_provisions.pdf.
- Regulations allow an exception to the targeted industries by allowing a firm creating at least 300 jobs and making $30 million capital investment to participate. Still, ESD can admit businesses that don’t fit under this designation so long as it has at least 25 full-time equivalent employees. Such an awardee can even qualify without creating new jobs so long as its benefit cost ratio is at least 10:1. In statute this is referred to as “an industry with significant potential for private-sector growth and development in this state.” See Chapter XIX of the Regulations of the Commissioner of Economic Development, Excelsior Jobs Program (2013), http://esd.ny.gov/BusinessPrograms/Data/Excelsior/ExcelsiorPermRegs2013.pdf.
- Ted Johnson, “CBS to Keep Colbert’s ‘Late Show’ in New York,” Variety (July 23, 2014), http://variety.com/2014/biz/news/stephen-colbert-to-keep-late-show-in-new-york-1201267630/.
- Participants are also supposed to consult with NYPA periodically to report the effectiveness of the Recharge program; however, if those consultations have occurred and include a written component, they have not yet been made publicly available. While Recharge New York customers report “Jobs Committed” to the Economic Development Power Allocation Board (EDPAB), it is unclear whether these are jobs that have been or will be created or retained. Moreover, nothing in the EDPAB’s reports shows whether or not these commitments have been achieved, or when they will be achieved. See Recharge New York Power Program Act, Add §188-a, and §§183 & 189, Ec Dev L; amd §1005, rpld sub 16, Pub Auth L; amd §9, Chap 316 of 1997; amd §11, Chap 645 of 2006; amd §186-a Tax L; amd §2, Chap 477 of 2009 (2011); and Power Authority of the State of New York, 2013 Report to the Governor and Legislative Leaders on Power Programs for Economic Development (April 2014), www.nypa.gov/services/economicdev/2013GovernorsAnnualReportFinal.pdf.
- This estimate relies on: 1) billing rates by program, as reported by NYPA, and 2) the average clearing price for energy reported by New York State Independent System Operator. To compute the amount of energy businesses in a program would consume in a year, a range of “load” factors was used. A load factor describes what percentage of the time a business is operating at its peak demand. The maximum load factor is 1.00 and would be used for a factory operated 24 hours a day, 7 days a week at a continuous level. At the other end of the spectrum a low load factor of 0.27 would describe a business that is open 9 hours a day, 5 days a week. Load factors used in the CBC estimate were identified based on the industry classification of the users in each program.
- This affects NYPA’s economic development costs because these costs are based on the difference between what NYPA could raise by selling its electricity on the open market and the lower rate it charges its economic development allocation recipients. Calculation based on New York Power Authority, Schedule of Rates for Sale of Firm Power to Expansion and Replacement Customers in Western New York: Service Tariff No. WNY-1 (December 20, 2010), www.nypa.gov/Trustees/2013%20Minutes/July2013/4b-Exhibit%20B-1%20-%20WNY-1%20Original%20approved%20Service%20Tariff%20effective%207-1-13.pdf; and New York Power Authority, Schedule of Rates for Sale of Recharge New York Power (Direct Sale): Service Tariff No. RNY-1 (March 27, 2012), www.nypa.gov/rechargeny/RNY%20Tariff%20FINAL%20APPROVED%20BY%20TRUSTEES.pdf.
- The North Country region reached a large, long-term deal with Alcoa to provide low-cost power to two smelting plants in Massena in 2005.But in January 2014, Alcoa announced it would be closing one of its facilities, dismissing 332 workers. As in Western New York, NYPA plans to sell the available 239 megawatts on the open market, channeling proceeds to a new local economic development fund, the North Country Economic Development Fund. See Rick Moriarty, “Alcoa to lay off 332 workers in Massena,” The Syracuse Post-Standard (January 24, 2014), www.syracuse.com/news/index.ssf/2014/01/alcoa_to_lay_off_332_workers_in_massena.html.
- Citizens Budget Commission, Overhauling the New York Power Authority’s Economic Development Programs (September 2009), p. 24, www.cbcny.org/sites/default/files/NYPA_Report_FINAL.pdf.
- Few plans have followed up on a majority of their stated performance measures. Finger Lakes, which specified 10 measures, is the only REDC that has tracked all of its measures for its 2012 and 2013 progress reports. Four other REDCs—Capital, Mid-Hudson, North Country, and Western New York—collect performance data on some but not all of their stated performance measures. Southern Tier provides data on certain projects, but leaves many gaps in its data relating to targeted industries and overall strategies. Long Island includes some data on job creation and estimated wages from funded projects, though these are based on econometric analysis and not awardee reports. Central New York also collects data on some of its regional indicators.
- New York State Division of the Budget, Annual Report on New York State Tax Expenditures 2014-15 State Fiscal Year (2014), www.budget.ny.gov/pubs/executive/eBudget1415/fy1415ter/TaxExpenditure2014-15.pdf.
- Also many credits are uncapped, whereas spending programs are limited by annual appropriations.
- Alan Peters and Peter Fisher, “The Failures of Economic Development Incentives,” Journal of the American Planning Association, vol. 70, no. 1 (Winter 2004), pp.27-37. See also Robert G. Lynch, Rethinking Growth Strategies: How State and Local Taxes and Services Affect Economic Development (Economic Policy Institute, 2004), www.epi.org/publication/books_rethinking_growth; Dan Hirasuna and Joel Michael, Enterprise Zones: A Review of the Economic Theory and Empirical Evidence (Minnesota House of Representatives Research Department, 2005), www.house.leg.state.mn.us/hrd/pubs/entzones.pdf; and Timothy J. Bartik, Growing State Economies: How Taxes and Public Services Affect Private Sector Performance (Economic Policy Institute, 1996).
- Costs grew to $147 million in 2008 but fell to $111 million in 2009 with the implementation of business tax credit deferrals passed to address the State’s fiscal crisis.
- A separate refundable credit for commercial production is also offered and is often grouped with the film credit. While much smaller—$7 million annually—the commercial production credit is made up of three components: $3 million is available for shooting commercials downstate, $3 million is available for shooting commercials upstate, and $1 million for companies demonstrating incremental growth in production. Downstate producers’ initial credit is equal to 5 percent of qualified production costs above $500,000. Upstate producers receive the same percentage credit on costs above $200,000. Additionally, a company may earn a credit based on year-to-year growth in qualified costs regardless of where in the state they are incurred. This credit is equal to 20 percent of the incremental growth with a maximum credit of $300,000. Unlike the film production tax credit, which is first-come, first-served, all three components of the commercial production tax credit are distributed to eligible applicants on a pro rata basis. For fiscal year 2015, the post-production credit set aside will increase to $25 million. See Empire State Development, “Commercial Tax Credit Program,” (accessed September 16, 2014), http://esd.ny.gov/BusinessPrograms/CommercialsCredit.html.
- Total based on awarded credits and future allocations authorized through the end of 2019. See New York State Division of the Budget, Annual Report on New York State Tax Expenditures 2014-15 State Fiscal Year (2014), www.budget.ny.gov/pubs/executive/eBudget1415/fy1415ter/TaxExpenditure2014-15.pdf; and New York State Department of Taxation and Finance, Office of Tax Policy and Analysis, Summary of Tax Provisions in SFY 2013-14 Budget (April 2013), pp. 1-2, www.tax.ny.gov/pdf/stats/sumprovisions/summary_of_2013_14_tax_provisions.pdf.
- For a discussion of California’s film tax credit see Mac Taylor, State of California, Legislative Analyst’s Office, Film and Television Production: Overview of Motion Picture Industry and State Tax Credits (April 2014), pp. 15-18, www.lao.ca.gov/reports/2014/finance/tax-credit/film-tv-credit-043014.pdf.
- The Los Angeles Economic Development Corporation’s 2012 study of its film tax incentives showed that every $1 of tax credit returned $1.06 in state and local tax revenues. Since this amount includes local tax revenue and the costs of paying the credit fall entirely on state government, the Legislative Analyst’s Office concluded the program probably did not produce enough state revenues to pay for itself. Two separate consultant studies of New York’s film tax incentives showed returns larger than 1:1, but the New York State Tax Reform and Fairness Commission report examines the flaws in these studies. See Mac Taylor, State of California, Legislative Analyst’s Office, Film and Television Production: Overview of Motion Picture Industry and State Tax Credits (April 2014), pp. 22-23, www.lao.ca.gov/reports/2014/finance/tax-credit/film-tv-credit-043014.pdf; and New York State Tax Reform and Fairness Commission, New York State Business Tax Credits: Analysis and Evaluation , (November 2013), p. 15.
- Connecticut awarded $96 million in total credits in fiscal year 2012. See Joseph de Avila, “Connecticut Pulls Films’ Tax Benefits,” The Wall Street Journal (June 14, 2013), http://online.wsj.com/news/articles/SB10001424127887323734304578545530274694000.
- North Carolina replaced its 25 percent refundable credit with a $10 million competitive grant program. See Valerie Bauerlein, “North Carolina Reins in Tax Incentives for Movie Companies,” The Wall Street Journal (August 20, 2014), http://online.wsj.com/articles/north-carolina-reins-in-tax-incentive-for-movie-companies-1408537246.
- See New York State Department Taxation and Finance, Office of Tax Policy Analysis, Summary of Tax Provisions in SFY 2013-14 Budget (April 2013), pp. 1-2, www.tax.ny.gov/pdf/stats/sumprovisions/summary_of_2013_14_tax_provisions.pdf.
- The provision expanded the credit to “a talk or variety program that filmed at least five seasons outside the state prior to its first relocated season in New York…[and] must be filmed before a studio audience” of at least 200 people. The specificity of the provision hinted its inclusion was an effort to lure “The Tonight Show.” See Caitlin McDevitt, “A ‘Jimmy Fallon tax cred’?” Politico (March 21, 2013), www.politico.com/blogs/click/2013/03/a-jimmy-fallon-tax-credit-159973.html.
- Tax credits constitute the financial leg of BCP; the program also includes procedural and legal incentives such as expedited and streamlined administrative actions and liability protection. The program’s dual mission is to promote private cleanup of brownfield sites and reduce pressure on “greenfield” development in the State. See New York State Department of Environmental Conservation, “Brownfield Cleanup Program,” (accessed September 19, 2014), www.dec.ny.gov/chemical/8450.html.
- The second and third credits are much smaller. The real property tax credit for remediated brownfields is a product of the number of people employed at the remediated property, time, and real property taxes paid by a developer, as well as whether or not the remediated brownfield is in an economically distressed census tract. This credit is capped at $1 million for any property. The environmental remediation insurance credit is available for developers providing insurance at the site. The credit is the lesser of $30,000 or 50 percent of the eligible premiums paid. The credit may only be taken once per brownfield. See New York State Department of Taxation and Finance, New York State Tax Credits Available for Remediated Brownfields, Publication 300 (April 2010), pp. 5-9, www.tax.ny.gov/pdf/publications/multi/pub300.pdf.
- For properties accepted to this program after June 23, 2008, site preparation and groundwater cleanup credits range from 24 percent of qualified costs for sites approved for industrial use to 50 percent of qualified costs for sites approved for unrestricted use.
- New York State Tax Reform and Fairness Commission, New York State Business Tax Credits: Analysis and Evaluation, A Report Prepared for the (November 2013), p. 13, http://www.capitalnewyork.com/sites/default/files/131115__Incentive_Study_Final_0.pdf.
- The second largest claim is against the site preparation component of the brownfield redevelopment credit. While this component is nominally for site cleanup, the site’s preparation can include capital costs not related to clean-up including temporary wiring, scaffolding, demolition, and fencing and security. Governor Cuomo’s commission on tax reform and fairness cast doubt on the use of this component’s costs. See New York State Tax Reform and Fairness Commission, New York State Business Tax Credits: Analysis and Evaluation (, November 2013), p. 64.
- Eligible applicants to Brownfield Opportunity Areas Program include municipalities, community based organizations, and community boards unique to New York City. See New York State Department of Environmental Conservation, “Brownfield Opportunity Areas Program Fact Sheet,” (accessed September 17, 2014), www.dec.ny.gov/chemical/8650.html. Base percentages begin at 10 percent for personal income taxpayers and S corporations and 12 percent for corporate taxpayers. An additional 8 percent may be added if the site is located in an economically distressed census tract and an additional 2 percent if remediation adheres to highest standards of quality, allowing site to be used without restriction. Lastly, 2 percent may be added if the site is Brownfield Opportunity Area—a site that has sought and received special status conferred by the Secretary of State. The tangible personal property component is capped. For properties used in manufacturing the caps is the lesser of $45 million or six times the combined value of groundwater and site preparation costs. For all other uses the credit is capped at the lesser of $35 million or three times the combined value of groundwater remediation and site preparation costs These caps on the property development component of the program were introduced in 2008 as part of a reform package to limit the egregious exploitation of the development credit seen in the first years of the program.
- New York State Division of the Budget, , Annual Report on New York State Tax Expenditures 2015-16 State Fiscal Year (2015), p. 156, http://publications.budget.ny.gov/eBudget1516/fy1516ter/TaxExpenditure2015-16.pdf?utm_source=Sailthru&utm_medium=email&utm_term=Albany%20Pro&utm_campaign=Albany%20Pro%2002%2F10%2F15.
- Office of the New York State Comptroller, Brownfield Restoration in New York State: Program Review and Options (April 2013), pp. 23-28, www.osc.state.ny.us/reports/environmental/brownfields_restoration13.pdf.
- The Commission’s recommendation changed the tangible property credit so that applicants would need to prove the site had been abandoned for 10 years, redevelopment of the site would be unlikely without State assistance, and the cost of cleanup is greater than its value after cleanup. See New York State Tax Reform and Fairness Commission, Final Report (November 2013). http://www.governor.ny.gov/sites/governor.ny.gov/files/archive/assets/documents/greenislandandreportandappendicies.pdf
- New York State Division of the Budget, Building on Success: 2014-15 Executive Budget (January 2014), p. 14, http://publications.budget.ny.gov/eBudget1415/fy1415littlebook/BriefingBook.pdf.
- Jon Campbell, “Legislature passes extension of Brownfield tax credit, but reforms elusive,” The Journal News (June 20, 2014), www.lohud.com/story/news/politics/politics-on-the-hudson/2014/06/20/legislature-passes-extension-brownfield-tax-credit-reforms-elusive/11091643/.
- New York State Division of the Budget, Fiscal Year 2015-16 Executive Budget, Revenue Article VII Legislation, Part R, http://publications.budget.ny.gov/eBudget1516/fy1516artVIIbills/REVENUEArticleVII.pdf.
- New York State Division of the Budget, Fiscal Year 2015-16 Executive Budget, Revenue Article VII Legislation, Part R, http://publications.budget.ny.gov/eBudget1516/fy1516artVIIbills/REVENUEArticleVII.pdf.
- New York State Department of Taxation and Finance, Office of Tax Policy Analysis, The Effectiveness of the ITC: An Evaluation of New York’s Investment Tax Credit (February 1996), p. 1, www.tax.ny.gov/pdf/stats/policy_special/effectiveness_of_the_itc.pdf.
- New York State Division of the Budget, Annual Report on New York State Tax Expenditures 2014-15 State Fiscal Year (2014), p. 154, www.budget.ny.gov/pubs/executive/eBudget1415/fy1415ter/TaxExpenditure2014-15.pdf.
- Reforms to the ITC have limited fiscal impact without addressing these earned but unused credits. See New York State Tax Reform and Fairness Commission, New York State Business Tax Credits: Analysis and Evaluation (November 2013), p. 19.
- The Commission estimated savings of $65 million annually from Investment Credit reforms and $30 million annually from the elimination of the Investment Tax Credit for the financial services industry. See New York State Tax Reform and Fairness Commission, Final Report (November 2013), pp. 10, 24-25.
- New York State Division of the Budget, Building on Success: 2014-15 Executive Budget (January 2014), p. 16, http://publications.budget.ny.gov/eBudget1415/fy1415littlebook/BriefingBook.pdf.
- ESD has the authority to bestow tax benefits, condemn property, and waive compliance of local laws as well. See- Empire State Development, New York State Urban Development Corporation and Subsidiaries Consolidated Financial Statements and Independent Auditors’ Report March 31, 2014 and 2013 (2014), p. 4, http://esd.ny.gov/CorporateInformation/Data/FinancialDocuments/06272014_NewYorkState_Urban_DevelopmentFinal2014.pdf.
- Empire State Development, New York State Urban Development Corporation and Subsidiaries Consolidated Financial Statements and Independent Auditors’ Report March 31, 2011 and 2010 (2011), www.empire.state.ny.us/CorporateInformation/Data/FinancialDocuments/UDCandSubsidiariesFinancialStatement2010_2011.PDF; and Empire State Development, New York State Urban Development Corporation and Subsidiaries Consolidated Financial Statements and Independent Auditors’ Report March 31, 2013 and 2012 (2013), www.empire.state.ny.us/CorporateInformation/Data/FinancialDocuments/03312013_NYS_Urban_Development_Corp_FS.pdf.
- Empire State Development, New York State Urban Development Corporation and Subsidiaries Consolidated Financial Statements and Independent Auditors’ Report March 31, 2014 and 2013 (2014), www.empire.state.ny.us/CorporateInformation/Data/FinancialDocuments/06272014_NewYorkState_Urban_DevelopmentFinal2014.pdf.
- “Tech Valley” refers to investments made to support an advanced semiconductor manufacturing cluster in the Capital Region centered in Albany. Two cornerstone investments from the State included the building of the New College of Nanoscale Science and Engineering (CNSE) at SUNY-Albany and the construction of GlobalFoundries semiconductor production facilities at Luther Forest, approximately 22 miles north of Albany in Saratoga County.
- New York State Office of the Governor, “Governor Cuomo Announces $4.4 Billion Investment by International Technology Group Led by Intel and IBM to Develop Next Generation Computer Chip Technology in New York,” (press release, September 27, 2011), www.governor.ny.gov/press/092711chiptechnologyinvestment.
- New York State Division of the Budget, FY 2015 Enacted Budget Capital Program and Financing Plan (May 2014), http://publications.budget.ny.gov/budgetFP/FY2015EnactedCapitalPlan.pdf; and New York State Division of the Budget, FY 2014 Enacted Budget Capital Program and Financing Plan (May 2013), www.budget.ny.gov/pubs/archive/fy1314archive/enacted1314/2013-14CapPlan.pdf.
- New York State Division of the Budget, Enacted Budget Capital Program and Financing Plan, Fiscal Year 2006 to 2015 editions. Available at https://www.budget.ny.gov/.
- One of the first companies to receive START-UP relief was Liazon, a health benefits business located in Buffalo and New York City. At that point, Liazon had been in business for three years and was recognized as one of America’s fastest growing businesses, securing multimillion dollar funding from private equity firms such as Bain Capital. In November 2013, Towers Watson acquired Liazon for $215 million. Liazon has promised to create 500 jobs within five years, but critics of the deal say that the firm would have expanded without START-UP incentives. See Chris Glorioso, “I-Team: Mature, Multi-billion Dollar Firm Benefits From ‘START-UP’ Tax Breaks,” NBC 4 New York (October 8, 2014), www.nbcnewyork.com/news/local/Start-Up-Cuomo-Empire-State-Development-New-York-I-Team-Liazon-Tax-Breaks-278403131.html.
- This provision does not apply to a State University or community college located in Nassau, Suffolk, or Westchester counties or New York City. Universities and community colleges may ask for a waiver to increase this allocation by up to 200,000 square feet. Such a waiver may be approved by the START-UP New York Tax-Free Area Approval Board.
- Total aggregate square footage for private universities is set at 3 million.
- These sites have yet to be named.
- Presumably these firms would already benefit from the $750 million investment in the RiverBend site to bring anchor tenant SolarCity to Buffalo. See Jim Heaney, “SolarCity deal is a rich subsidy package,” Outrages and Insights (blog entry, September 23, 2014), www.investigativepost.org/2014/09/23/solarcity-deal-rich-subsidy-package/.
- Robert Harding, “Cost of Tax-Free NY program? Cuomo’s budget director says ‘no cost’,” Eye on NY (blog post, May 29, 2013), http://auburnpub.com/blogs/eye_on_ny/cost-of-tax-free-ny-program-cuomo-s-budget-director/article_ac24b1a4-c8ae-11e2-8c4c-0019bb2963f4.html.
- New York State Division of the Budget, Annual Report on New York State Tax Expenditures 2014-15 State Fiscal Year (2014), www.budget.ny.gov/pubs/executive/eBudget1415/fy1415ter/TaxExpenditure2014-15.pdf.
- Although START-UP NY restricts businesses from applying for tax-free space if they compete with an existing business, once a business is established in the zone, additional competitors are unlikely to locate adjacent to the zone.
- Citizens Budget Commission, It’s Time to End New York State’s Empire Zone Program (December 2009), http://www.cbcny.org/sites/default/files/report_ez_12012009.pdf.
- State of New York, Office of the Governor, “Governor Cuomo Announces $709.2 million in Economic Development Resources Awarded in Fourth Round of Regional Council Initiative” (press release, December 11, 2014), www.governor.ny.gov/news/governor-cuomo-announces-7092-million-economic-development-resources-awarded-fourth-round.