Can We Have Our Cake and Compost It Too?
An Analysis of Organic Waste Diversion in New York City
CBC has highlighted the high cost—more than $1.7 billion annually—of residential municipal trash collection and disposal in New York City compared to that of other municipalities.1 In addition to the high fiscal costs, negative environmental impacts exist from the transportation of waste to distant landfills and from the landfills themselves.
A strategy of interest to both fiscal watchdogs and environmentalists is to reduce the amount of waste. One approach is to reduce the amount of non-recyclable waste collected by charging residential users a volume-based fee.2 Another approach is to minimize greenhouse gases by diverting organic waste from landfills. With 1.8 million tons of organic waste generated and carted away every year in New York City, handling of this material is an important focus of local environmental and sanitation policy.
The City’s One New York plan set ambitious goals to reduce total waste disposed 90 percent by 2030 and to reduce greenhouse gas emissions 80 percent by 2050.3 To achieve these goals, Mayor Bill de Blasio proposes expanding residential organic recycling to all residents by 2018.4 The City Council also passed a law, effective in 2016, requiring large commercial producers of food waste to divert organic waste.
This report examines both the feasibility and the cost of options for recycling more of the City’s residential organic waste.
Overview of Organic Waste in New York City
After traditional recyclable material, organic waste is the largest component of the waste stream. Most of this material is currently landfilled; however, a small amount is diverted through a residential and school pilot program, and the City recently adopted a diversion mandate for commercial food waste generators.
NYC’s trash system
The City of New York has two separate systems for handling solid waste. The Department of Sanitation (DSNY) collects 3.8 million tons of residential and government agency waste each year, while more than 250 private haulers pick up 4.0 million tons of business waste.5 In total these two systems cost taxpayers and businesses $2.4 billion per year: $1.7 billion for DSNY and $730 million for private haulers.
New York City residents separate their trash into three waste streams: 1) recyclable paper and cardboard; 2) recyclable metal, glass, and plastic; and 3) everything else, referred to as “refuse.” DSNY workers collect the two recycling streams once per week, either in separate trucks or in trucks with two compartments (“dual-bin”), and refuse is collected two or three times weekly. Almost 90 percent of refuse and nearly all recycling are collected at the curb with two-worker garbage trucks.
In fiscal year 2014 DSNY spent $1.3 billion on refuse—$826 million for collection and $432 million for disposal—and $411 million on recycling, mostly for collection.6
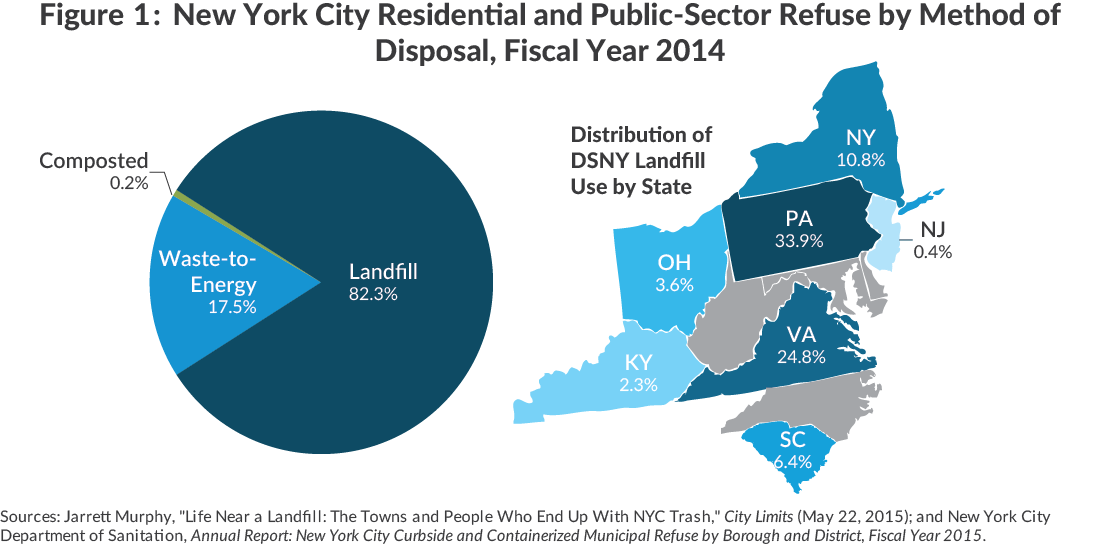
The remaining refuse is processed at regional waste-to-energy combustion plants, which are more environmentally friendly because they avoid landfill methane emissions and generate electricity.
In addition to the financial cost, the City’s trash operations have significant environmental impacts. DSNY landfilled trash generates about 1 million tons of greenhouse gas emissions each year, largely due to the organic portion of the waste stream.7 The collection and movement of trash around New York City also has negative impacts. DSNY vehicles travel 25 million miles every year, burning 11 million gallons of diesel fuel, emitting air pollutants, and worsening traffic congestion.8
Residential organic waste
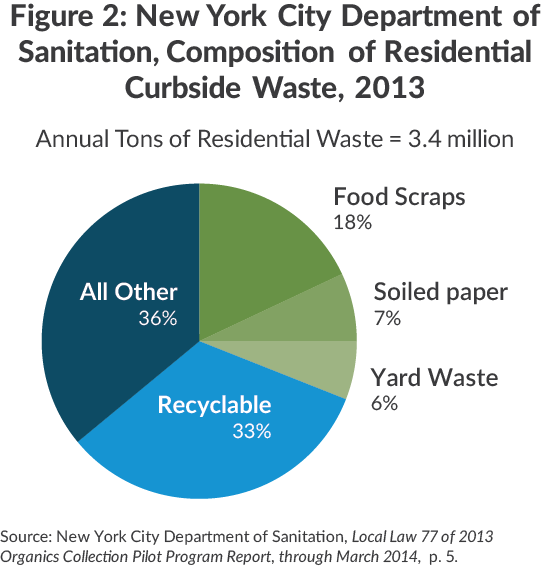
A recent waste characterization study for the City found 31 percent of residential waste, or 1.0 million tons, is compostable organic material.9 For the typical New York City household this figure translates to 11 pounds of organic material every week. About 60 percent of this material is food waste; the remainder is green waste from yards and household plants and soiled paper products.10
The amount and composition of organic waste varies with the city’s built environment. In the Bronx, Brooklyn, and Manhattan, food waste makes up about 70 percent of organic waste, but the share is less than 50 percent in Staten Island, where the share of yard waste is higher due to more outdoor areas.
In May 2013 DSNY began a voluntary residential organics diversion pilot with 3,250 households in Staten Island’s Westerleigh neighborhood. After three major expansions, pilot demonstration areas now include more than 186,600 households in small multifamily buildings in Staten Island, the Bronx, Brooklyn, and Queens.11 These initial areas are low- and medium-density neighborhoods with relatively high recycling rates, but the pilot also includes 200 large apartment buildings and 750 schools.
To encourage participation, DSNY distributes “starter kits” to each household, including small kitchen bins and large brown bins for the curb.12 For most demonstration areas, DSNY collects the organic waste once per week, on the same day as recycling collection. To determine if more frequent collection increases participation, DSNY collects organics twice per week in Brooklyn, on the same days as refuse pickup. In the Bronx, DSNY experimented with dual-bin trucks to collect organics and refuse at the same time, and dual-bin trucks will also be used in two new pilot areas in Brooklyn and Queens.
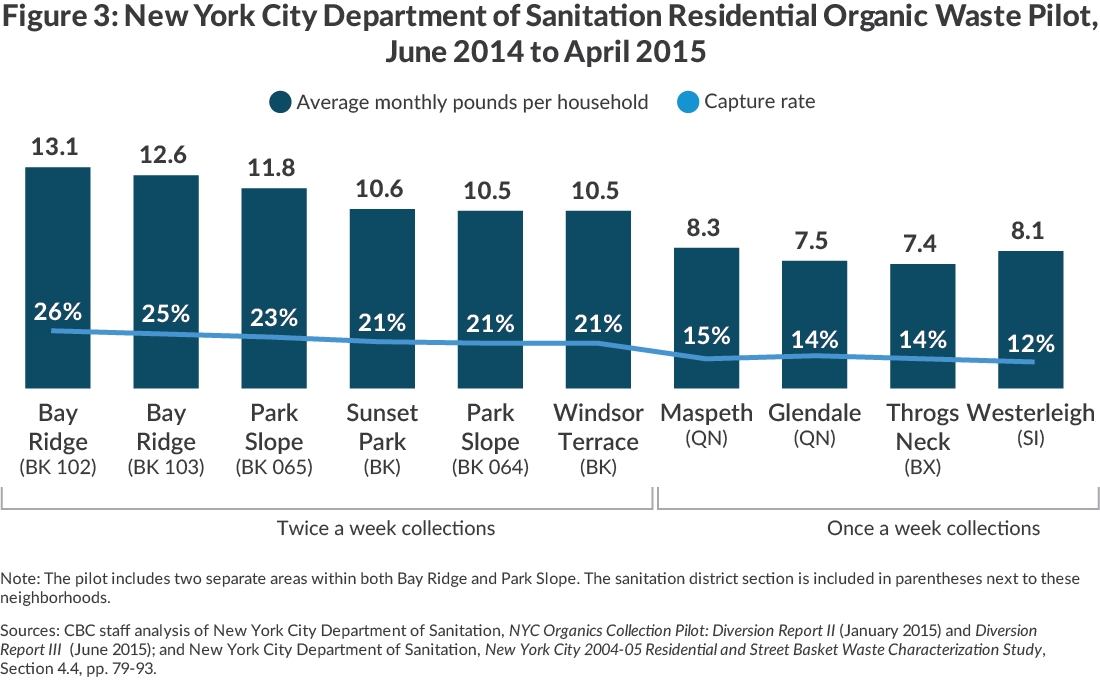
Based on interim evaluations, capture rates (the share of organic waste or other potentially recyclable material that is actually recycled) for organic waste have ranged from 12 percent to 26 percent—lower than the average citywide rate for recyclables (43 percent).13 Figure 3 shows rates have been highest in Brooklyn (21 to 26 percent) and lowest in Staten Island (12 percent).
Over fiscal year 2014 and fiscal year 2015, the residential and school pilots cost $19 million, including collection costs, export fees, waste bins, and outreach, and diverted 15,850 tons, implying a per-ton cost of $1,200.14 DSNY attributes these high costs to implementation expenses and small diversion quantities, which ranged from 7.4 pounds per household per month in Throgs Neck to 13.1 pounds per household per month in Bay Ridge.
Commercial organic waste
The city’s private businesses also produce large volumes of organic waste. A 2012 study of New York City’s commercial waste sector estimated private waste carters pick up 747,000 tons of discarded organic waste from city businesses; almost 90 percent is food waste.15 Much of the city’s commercial food waste is concentrated at large generators such as restaurants, grocery stores, and hotels. According to a feasibility study on commercial food waste grinders, restaurants and hotels make up 82 percent of food service establishments and create 57 percent of commercial food waste.16 In 2013 the New York City Council passed a law permitting the Sanitation Commissioner to impose an organics diversion mandate on a subset of large generators of food waste, such as grocery stores, restaurants, food manufacturers, sports arenas, and hotels. Under the law, the Commissioner had to certify by July 1, 2015 that local processing capacity is sufficient and economical before imposing the mandate.17 DSNY found 105,500 tons of food waste processing capacity with prices, known as tipping fees, ranging from $40 to $65 per ton within 100 miles of the city.18
In August 2015 the Commissioner proposed new rules applying the mandate to 350 large food waste generators, such as large hotels and stadiums.19 These rules were adopted in January 2016. Notably, restaurants and grocery stores were excluded. Businesses subject to the law are required to arrange for separate collection, transport the organic material themselves, or process the material on site.20 DSNY projects 50,000 tons per year of food waste will be diverted, about 7 percent of organic waste generated by city businesses.21
How Much Capacity Is Needed to Expand Organic Waste Diversion?
Processing technology is not a major hurdle for organic waste diversion. Simple technologies, such as composting, have existed for centuries. More complicated technologies for organic waste to biogas conversion have existed for decades in the agricultural sector and at wastewater treatment plants. The bigger hurdle to processing large quantities of New York City’s organic waste is the proximity of adequate capacity.
The three main technologies considered in this report for the diversion of food waste and other organic material are composting, anaerobic digestion, and co-digestion at wastewater treatment plants.22 Additional information is presented in Appendix B.
Download Appendix B
Regional Organic Waste Processing CapacityComposting
Composting Composting involves the decomposition of organic material in the presence of oxygen under controlled conditions. Typically, organic waste is arranged in long rows, called windrows, and aerated with a blower and tubes or placed in vessels, such as rotating drums. The main benefits of composting are simple technology, low capital costs, and suitability for all types of organic waste. In addition, costs can be offset by revenues from the sale of fertilizer and other “soil amendments;” typically, output equals one-third of input and sells for about $20 to $30 per ton.23 However, composting facilities tend to have a large footprint.24
DSNY already runs three composting facilities in the city, at a cost of $5.2 million in fiscal year 2014, under a contract with a private company.25 Two facilities, at Rikers Island Correctional Facility and in Soundview Park in the Bronx, have minimal capacity to expand. The larger, a 24-acre site on the former Fresh Kills Landfill in Staten Island, already uses more than 80 percent of its capacity; the site may accept up to 19,525 tons of yard waste and up to 1,560 tons of food waste annually.26 The City has submitted applications to increase capacity for both types of waste but must meet stringent state regulations to obtain approval.27
Four additional large composting facilities that accept food waste operate within 150 miles of midtown Manhattan. The largest is an indoor aerated windrow composting facility at New Milford Farms in Connecticut. The facility is permitted to accept up to 53,865 tons of compostable waste annually and charges $60 per ton.28 This site has significant excess capacity: approximately 50,000 tons of food waste capacity is available.29 The three other facilities have large yard waste composting operations but much lower permits for food waste.
In total, composting facilities in New York City and the region have combined available capacity (permitted capacity minus current use) of 59,000 tons of food waste and 176,000 tons of total yard and food waste. DSNY has identified a gross maximum capacity of 200,000 tons within 100 miles of New York City for yard and food waste.30 (See Appendix B.)
Anaerobic digestion
Anaerobic digestion occurs in the absence of oxygen in enclosed vessels. During the process, bacteria breaks down organic matter and produces biogas, which can be converted into natural gas, electricity, or vehicle fuel. One benefit of this process is that additional material, for example diapers and pet waste, can be processed through digestion that cannot be composted; however, the technology is not well-suited for yard waste due to its low energy yield. Anaerobic digestion generates higher offsetting revenues thanks to energy production; the typical plant footprint is smaller; and the processing time is shorter than composting.
No anaerobic digestion plants are operational in the New York area, although at least seven with a combined capacity of 800,000 tons per year have been proposed for New York, Connecticut, and New Jersey. In 2013 the first large-scale anaerobic digestion plant for solid waste in the U.S. opened in San Jose, California. Prices at that plant range from $75 to $99 per ton depending on contamination level, well above the range for composting facilities.31
Wastewater treatment plant co-digestion
Anaerobic digesters already operate at all 14 municipal wastewater treatment plants operated by the New York City Department of Environmental Protection (DEP). Co-digestion could make use of this existing infrastructure and increase the energy output of sewage digestion, thereby increasing revenue to the City. To arrive at the digesters, food waste could be conveyed through in-sink food grinders and sewer pipes or direct-hauled by truck. If delivered by truck, it would need to be ground into a slurry consistent with sewer sludge before being placed in the digesters. If food waste arrives through the pipes, the added solids and water would go through the same process as all wastewater: solids are separated in primary and secondary settling tanks; grit is removed; and the remaining solids, called sludge, go into digester tanks. The remaining water is disinfected and released.32
DEP plants reuse 38 percent of the biogas produced as heat or electricity; the rest is flared. DEP’s 2013-2017 capital plan includes $500 million to increase reuse to 58 percent.33 The digested sludge is then dewatered and then disposed. Until 2012 DEP was committed to 100 percent reuse of biosolids, but in more recent years only about 20 percent of biosolids have been reused.34
Additional in-city capacity will be available soon to process and co-digest organic waste with sewage at the Newtown Creek wastewater treatment plant in Brooklyn. The initiative is a public-private partnership between DSNY, DEP, National Grid, and Waste Management.35 Waste Management projects expanding capacity at the facility to 15,600 tons per year in 2016 and 78,000 tons by the end of 2018.36 The City estimates up to 156,000 tons per year of food waste could be added to the Newtown Creek digesters.37 Increasing the long-term value of the co-digestion project, National Grid is also investing $14.4 million to convert methane gas produced at the Newtown Creek plant to pipeline quality gas and connect to the city’s grid.38 DSNY currently has a contract with Waste Management to accept organic waste at the Varick I transfer station, two miles from the Newtown Creek plant, for $116 per ton; in addition to Newtown Creek, Waste Management uses facilities in Connecticut and New Jersey for processing organic waste delivered to this transfer station.39
Total city and regional capacity
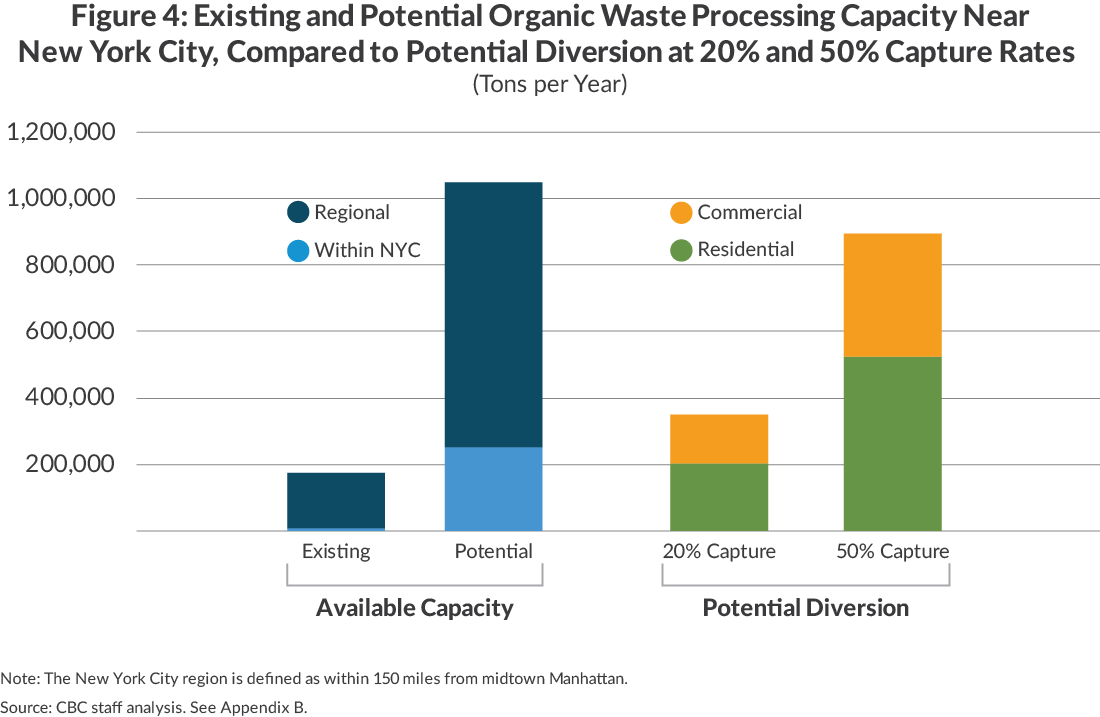
If current organics diversion programs are expanded, much greater processing capacity would be needed. A conservative estimate of the total amount of compostable organic material generated by New York City residents and businesses is 1.8 million tons per year.40 Given the City’s mandate for commercial food waste diversion, DSNY will compete with commercial haulers for organics processing capacity, making it important to consider available capacity for both sectors. Based on 1.8 million tons per year, a capture rate for compostable organic material between 20 and 50 percent would require processing capacity for between 358,000 tons and 896,000 tons of residential and commercial organics waste each year. At 20 percent diversion, a realistic scenario based on the experience of the residential pilot, all existing regional capacity would be used and an additional 175,000 tons of annual capacity would be needed.41
If proposed composting and anaerobic digestion developments occur, which is far from guaranteed, total in-city and regional capacity would increase from 176,000 to 1.2 million annual tons, which would need to be shared with increased supply from other localities. Diverting 20 percent of New York City residential and commercial organic waste would consume almost 30 percent of this capacity. (See Figure 4.)
How Much Would Residential Curbside Organic Waste Diversion Cost?
Even if sufficient processing capacity were to become available in the near future, the cost implications of large-scale organic waste diversion at the curb would be substantial. This section summarizes a detailed analysis of the costs of an expanded residential organic waste diversion program for each processing technology previously described. Three scenarios are considered:
- Curbside collection of organic waste at a 20 percent capture rate (similar to the current pilot program);
- Curbside collection of organic waste at a capture rate equal to each sanitation district’s current recycling capture rate, which ranges from 17 percent to 66 percent; and
- Diversion of food waste through in-sink disposers and sewer conveyance to wastewater treatment plants.
The analysis projects costs in the long term and is not based on the cost of the current pilot curbside program, which involves relatively small volumes of organic material. Curbside collection and in-sink food waste disposers are considered independently; the analysis does not account for potential interactions between the two approaches if both were in place.
The analysis uses actual collection data for each of the city’s 59 sanitation districts to determine whether a district has sufficient unused truck capacity to substitute an organic waste collection for one weekly refuse collection, or to use dual-bin trucks for joint organics and refuse pickup. Boroughs were analyzed separately to account for differences in household waste characteristics, housing density, and current refuse disposal costs.
The two curbside collection scenarios consider use of three composting technologies (turned windrows, aerated windrows, and in-vessel), anaerobic digestion, and wastewater treatment plant co-digestion. The third scenario assumes that organics diversion via in-sink disposers would reduce the number of refuse collections if the remaining refuse could fit into trucks on the remaining collection days.
The net financial impact considers the full range of expenses: new costs for upfront investments, collection costs or savings, transportation and processing costs for the diverted organic material, and savings from avoided refuse export to landfills and combustion plants. However, the analysis does not quantify the environmental benefits against which any cost increases must be weighed.
The analysis finds citywide curbside organics collection would add new annual costs ranging from $177 million to $251 million, largely due to new collection costs. (See Table 1.) In-sink disposers could save the City $4 million annually but would cost $45 million per year due to the purchase and installation of the devices and the cost of water and electricity to operate them. (Appendix A provides detailed information on the sources and assumptions used in the analysis, as well as additional tables.)
Download Appendix A
Cost Model Assumptions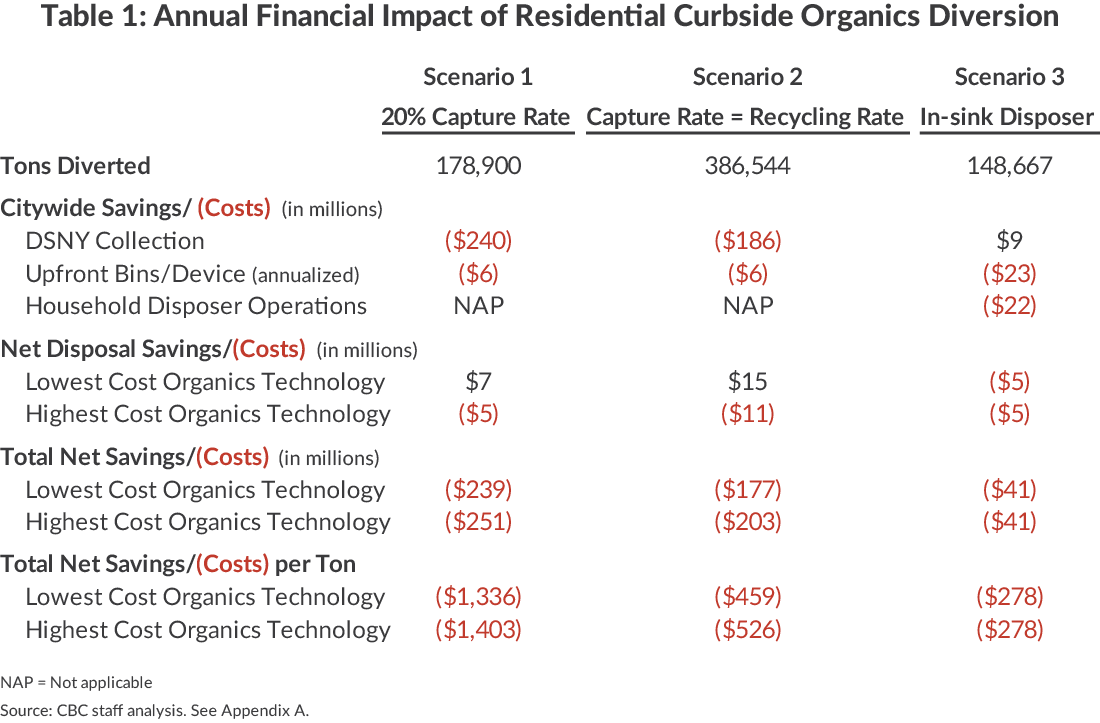
Costs of residential curbside collection
Applying the ratio from a 2004 DSNY waste composition study to current refuse tonnage, a 20 percent capture of compostable waste (food, yard waste, and soiled paper) would divert 178,900 tons. Capture rates that mirror district-level recycling rates would divert as much as 386,500 tons annually.
Collection of source-separated organic waste at the curbside would require additional DSNY truck routes or trucks with additional compartments on those routes with unused carting capacity. This would increase DSNY costs significantly. Direct refuse collection, excluding administrative expenses, currently costs $208 per ton, more than double the cost of disposal.42 High DSNY collection costs reflect high worker compensation and inflexible work schedules and routes.
For this analysis, the estimated impact on collections is based on current refuse collection patterns. While organics routes are longer now than refuse routes because not as many households set out an organics bin and require a truck stop, as more people participate organics routes should more closely mirror refuse routes. This analysis also assumes organics collection would be provided once per week citywide, even though some pilot districts now receive twice per week pickup.
If enough organic material is diverted from the refuse stream, DSNY could cut refuse pickup from current schedules by a day per week or switch to dual-bin trucks on some routes. This analysis estimates how many sanitation districts could drop a pickup or switch to dual-bin trucks without any other scheduling or route changes. DSNY has stated that it has plans for operational improvements and negotiations with the uniformed sanitationmen’s union to offset new costs but has not publicly disclosed any specific details. While this analysis does not consider potential new operational efficiencies or reconfigured routes for districts close to the required threshold for dropping a pickup, the collection savings are optimistic. Any change in collection frequency requires City Council approval and negotiation with the union. Past attempts to reduce collections have been met with Council opposition. Additionally, the analysis does not include potential costs for building managers to alter centralized collection areas and enforce separation rules.
If DSNY added a weekly organics pickup to all 59 districts, annual collection costs would increase by $242 million. Curbside organics pick up would add more than 114,000 new truck-shifts, which would also increase long-term capital costs for the truck fleet and add to local air pollution and traffic. Under scenario 1, only one sanitation district (Concourse, Highbridge & Mount Eden in the Bronx) could drop a weekly refuse pickup, saving DSNY $2 million per year and bringing the net annual collection cost increase to $240 million.43
Under scenario 2, if the residential organics capture rate were as high as current district-level recycling capture rates, an additional nine districts could drop a refuse pickup.44 Decreasing refuse collection in these 10 districts would save DSNY $56 million and reduce additional new citywide collection costs for organics to $186 million.45 The number of new truck-shifts would fall from 114,000 to 88,000 per year.
On a per-ton basis, curbside organics would add new collection costs of $1,353 per ton if the capture rate is 20 percent or $481 per ton of organic waste diverted if the capture rate is the same as district-level recycling capture rates.
The diversion of organic waste would also reduce the City’s refuse disposal costs. DSNY currently spends an average of $85 per ton to transport and dump trash at landfills and waste-to-energy plants. This cost excludes certain fixed costs associated with rail and marine transfer stations, such as containers and railcars. The actual per-ton cost of disposal varies across the city due to differences in the mode of transportation (truck or train) and the ultimate disposal destination; it is as low as $70 per ton for disposal at New Jersey waste-to-energy plants and as high as $105 per ton at the Varick Avenue rail transfer station in Brooklyn.46
While organics diversion avoids the cost of landfilling or combustion, the City would have to pay for its processing. For this analysis, processing costs are based on literature reviews of technology costs and publicly available facility tipping fees. Given higher costs for labor, land, and construction in the New York City area, actual processing fees may be higher. Contamination in the residential and school organic waste stream, particularly plastic bags, may also limit the number of facilities willing to accept the material and increase prices. For the ongoing residential and school pilot, export fees, including the cost of transportation and processing, range from $86 to $154 per ton.47
The analysis assumes prices would be $28 per ton at turned windrow composting facilities; $45 per ton at aerated windrow composters; and $95 per ton for in-vessel composting. Most large-scale composting facilities in the New York City region use aerated windrows, making this technology the most likely scenario.48
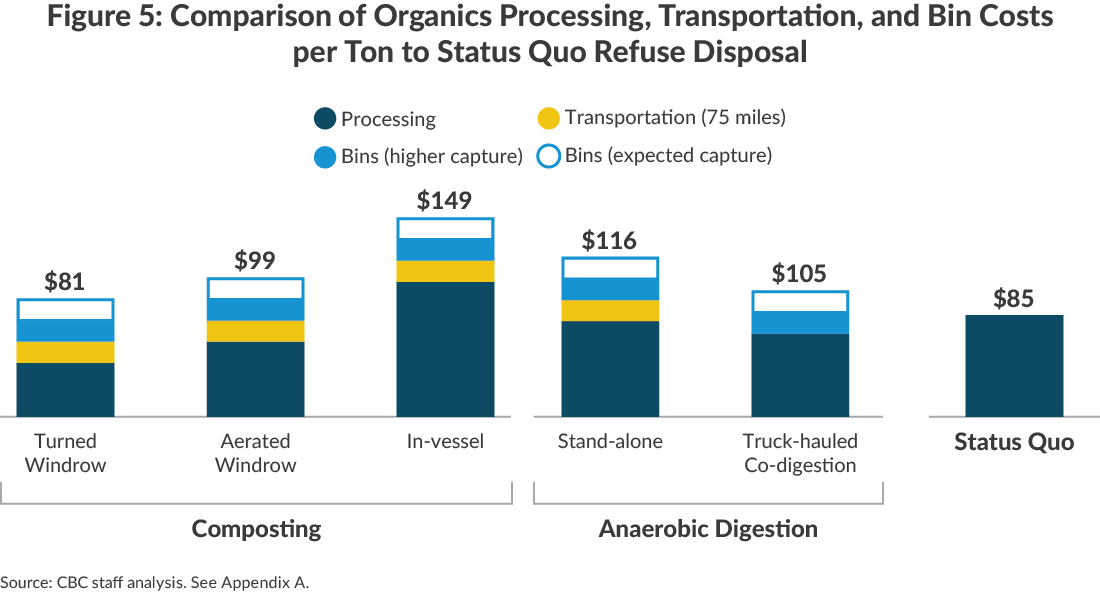
The cost assumptions for anaerobic digestion and co-digestion at wastewater treatment plants are based on capital investments, operating costs, and offsetting revenues from biogas sales. Based on these inputs, the analysis assumes anaerobic digestion would cost $62 per ton and co-digestion would cost $69.49 Capital and operating expenses would be higher on a per-ton basis for co-digestion due to the need for separate pre-processing facilities and upgrades to biogas equipment at treatment plants. Revenues are assumed to be higher for co-digestion at wastewater treatment plants because additional biogas would be produced from existing sewage. However, actual revenues from co-digestion will depend on the amount of biogas produced as well as the infrastructure needed to beneficially reuse it. The analysis assumes composting and anaerobic digestion facilities are located 75 miles from the city, adding a transportation cost of $18 per ton.
An additional cost must be considered for organics diversion programs requiring pickup at the curbside: waste bins. For the diversion of food waste, sealed bins are necessary to prevent odors and rodents. For the residential organics pilot, DSNY provides households with one 2-gallon kitchen collector and one or two 10- to 25-gallon curbside bins.50 The curbside bins are provided at no cost to households. Based on the number of bins delivered per household in the pilot and current costs to the City, the analysis assumes bins would cost $21 per household. Thus, providing bins citywide would cost $64 million. The analysis also assumes bins have a useful life of 10 years, for an annualized cost of $6 million. Under a 20 percent capture rate, the per-ton cost would be $36; if capture rates mirrored sanitation district recycling capture rates, the per-ton cost would fall to $17.
Processing, transportation, and bin costs total between $81 and $149 per ton, assuming residents set out 20 percent of their organic waste. Consequently, for all but one alternative organic waste disposal is more expensive than current refuse disposal practices. (See Figure 5.) This conclusion is true even in neighborhoods that do not require additional collection routes.
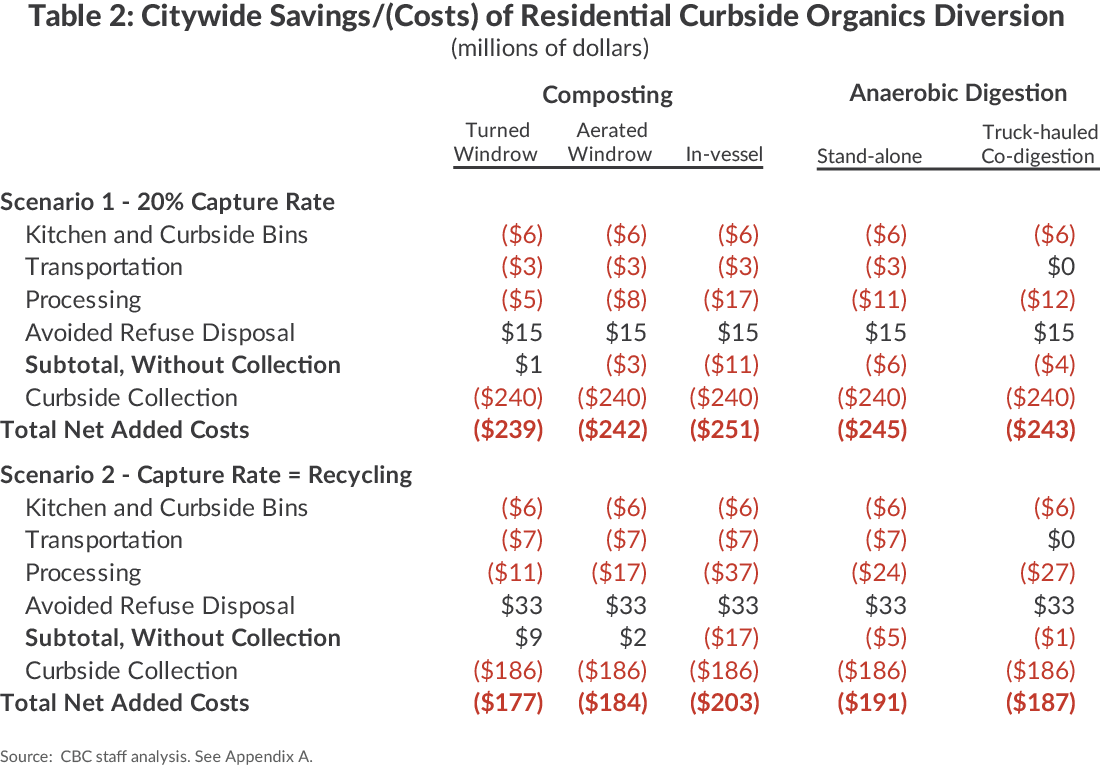
Considering all costs and savings, the net costs of residential organic waste diversion would total between $1,336 and $1,403 per ton if 20 percent of organics is diverted. If the capture rates are the same as district-level recycling rates for paper, metal, glass, and plastic, the net costs would range from $459 to $526 per ton. On an annual basis, the lower-diversion scenario would add costs of between $239 million to $251 million, and the higher-diversion scenario would add between $177 million and $203 million. (See Table 2.) The table below shows that the vast majority of added cost stems from the additional cost of collection in those districts where it is infeasible to either reduce regular refuse collection frequency or switch to dual-use trucks.
In-sink food waste disposers
In-sink food waste disposers grind household food scraps and convey the waste through a building’s water pipes to the city’s sewers to a wastewater treatment plant, where it goes through the same process as city sewage. Until 1997, the City of New York banned in-sink disposals in combined sewer areas, but the ban was reversed following a DEP study that found their use would have manageable impacts on the wastewater treatment system.51
According to the U.S. Census, 50 percent of American households have in-sink kitchen disposals, totaling 67 million disposers nationwide.52 In contrast, in the New York City metropolitan area only 7.5 percent of households have them; however, 17 percent of homes built in the last four years have installed these devices. Certain new luxury residential developments, including the LEED Platinum certified Visionaire in Battery Park City and the ultra-luxury One57 in midtown Manhattan, include garbage disposals as featured amenities.53 Nearby Philadelphia recently adopted an in-sink disposer mandate on all new residential construction.54
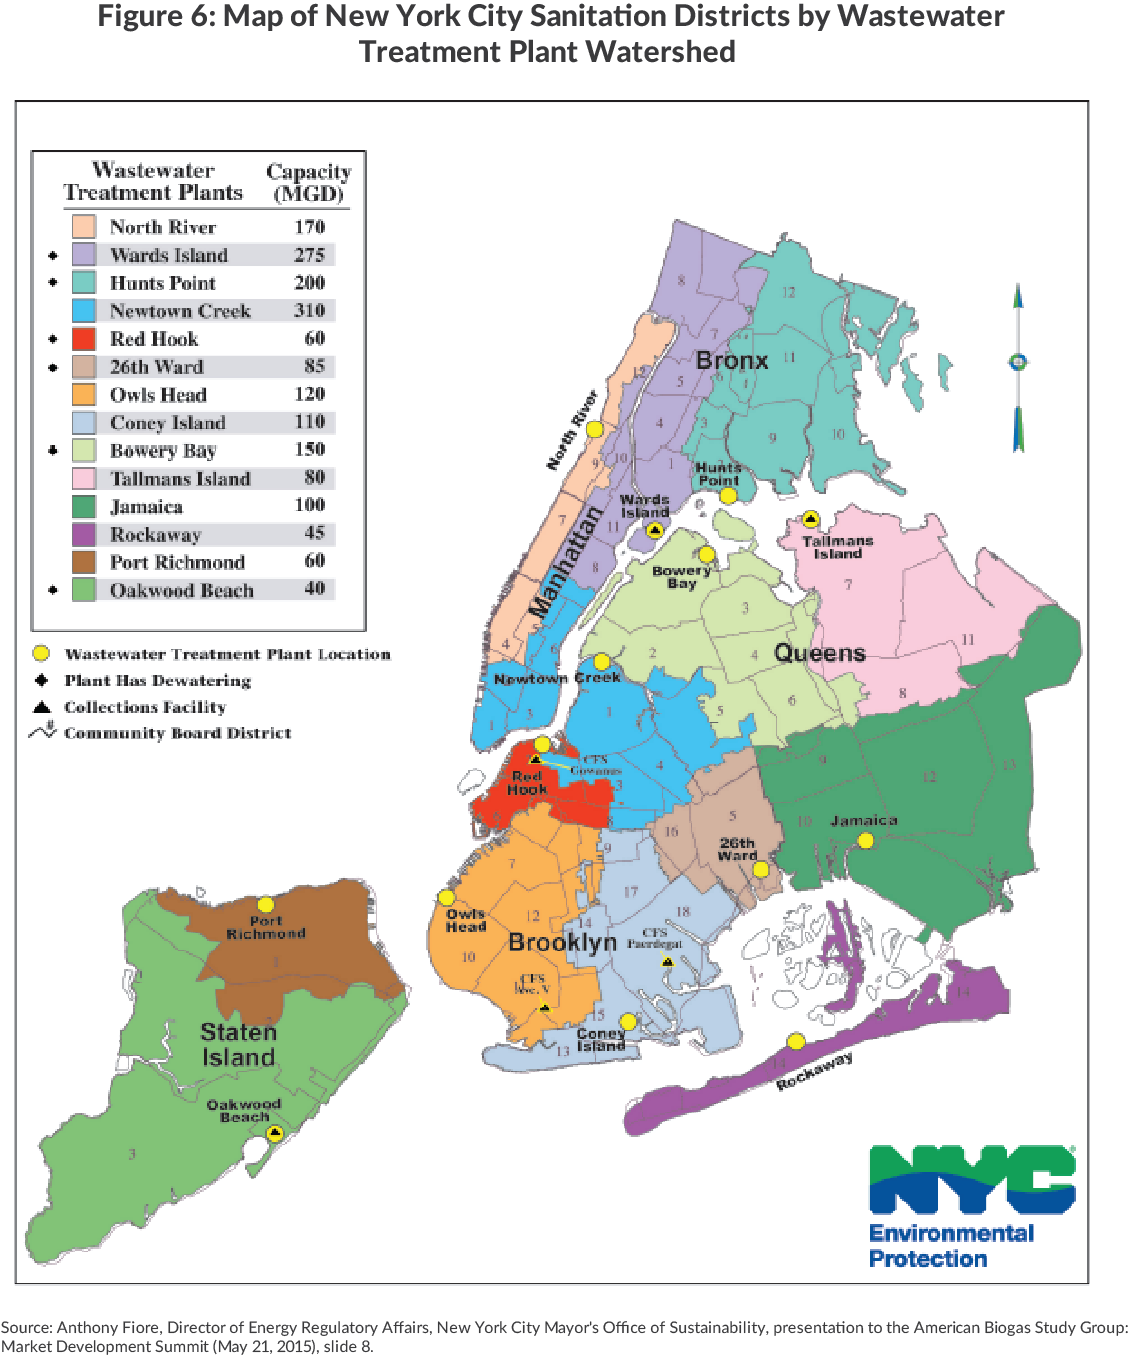
To operate, food waste disposers require about 1 gallon of running water per person per day.55 Installation citywide would increase water flow by 8.5 million gallons per day, or less than 1 percent of the current citywide average water flow of 1.3 billion gallons per day. Permitted design capacity at the City’s 14 wastewater treatment plants is 1.8 billion gallons per day, but varies at individual plants; introduction of in-sink disposers would use at most 6 percent of excess water flow capacity in the most impacted plant. (See Appendix A for data on all 14 plants.)
Adding more solids to the system would have a greater impact, however. About 30 percent of food waste is solids and 20 percent is suspended solids; the rest is water and dissolved solids. The City’s wastewater treatment system is designed to filter suspended solids and move them to plant digesters. At 100 percent household participation, total suspended solids (TSS) would increase 18 percent, from 273,407 tons to 323,639 per year.56 At the individual plant level, two plants already exceed monthly EPA suspended solid limits and two others would exceed EPA limits with 100 percent participation.57
Another important measure to consider is digester capacity. DEP found 9 of the 14 plants could handle additional solids in their digester tanks for an average of 15 days.58 Without sufficient digester capacity, DEP must spend more to dewater digested sludge and dispose of biosolids. The plants with no excess digester capacity are Bowery Bay in Queens, Coney Island in Brooklyn, Jamaica in Queens, North River in Manhattan, and Owls Head in Brooklyn, and they serve about 45 percent of the city’s population. Based on these physical constraints, the cost analysis assumes in-sink disposers are viable for 20 percent of households in Queens, 50 percent in Brooklyn and Manhattan, and 100 percent in the Bronx and Staten Island.
Any initiative involving in-sink disposers would also require consideration of the impacts on combined sewer overflows (CSOs), in which significant rainfall causes DEP to discharge untreated wastewater into city waterways, and potential impacts on permit requirements for nitrogen removal. The City’s 14 plants vary considerably and should each be analyzed separately. In regard to nitrogen impacts, the literature on in-sink disposers presents conflicting conclusions with some studies finding additional food waste in the sewer system increases nitrogen loads and other studies concluding the carbon content of food scraps reduces the need for supplemental carbon to remove nitrogen in the nutrient removal process.59 DEP has also expressed concerns about increased clogged pipes, the ability of old infrastructure to handle increased loads, and the impact of additional fats, oil, and grease in the sewer system. These problems are particularly severe in areas without combined sewers where the increase in volume could be more likely to impact the system. DEP has a consumer education campaign underway to encourage proper disposal of grease.
A typical in-sink food waste grinder can handle all food scraps except extremely fibrous materials such as corn husks and artichoke leaves; studies of disposer usage find households use them for about 50 percent of food scraps.60 Notably, this rate is substantially higher than average capture rates of about 20 percent in the residential organics pilot. If 50 percent of food waste went through disposers in the 55 percent of households where treatment plants have sufficient capacity, 148,667 tons of food waste would be diverted through the water system – 83 percent of the tonnage diverted by curbside organics collection with a 20 percent capture rate.
The first step to using food waste disposers is the purchase and installation of the device. This analysis assumes a device cost of $50; $142 for one plumber and one electrician for one hour each at prevailing wage rates to install; and a useful life of 10 years for the device, bringing the annualized purchase and installation cost to $23 million.61 On a per-ton basis, the cost would be $156 per year. If disposers are installed during new construction, these costs would be substantially lower.
For the operation of the in-sink disposers, there will be additional water and electricity usage. The added electric usage is about 4 kilowatt-hours annually; at current New York City electric prices of $0.04 per kilowatt-hour, this would cost $0.18 per household annually. The cost of water consumption would be higher, in part due to the City’s high water prices. Assuming added water usage of 1 gallon per person per day, additional water consumption would cost $13 per household per year at current prices of $0.01 per gallon. These costs would total $22 million per year, or $147 per ton. These charges could be paid by households or by the City.
DSNY would avoid fees associated with refuse export; such savings would total $13 million per year. Based on an analysis at the sanitation district level, four districts could drop a refuse pickup if 50 percent of food waste went down the sink: Bedford-Stuyvesant and Brownsville in Brooklyn and Mott Haven and Concourse in the Bronx.62 A reduction in refuse pickups for these four districts would save DSNY $9 million, for total DSNY savings of $22 million.
By shifting management of food waste to the wastewater treatment system, costs would increase for DEP. Based on a national study of food waste disposers, this analysis assumes in-sink disposers would cost DEP $83 per ton in operating costs and $49 per ton in annualized capital costs, including upgrades to equipment to reuse digester gas. The assumed added operational costs for DEP of $20 million would be partially offset by avoided electricity purchases from the grid of approximately $2 million, for net added costs of $18 million for DEP. Actual costs could be higher or lower depending on required infrastructure upgrades, particularly for greater biogas capture and revenue generation. Other factors that may drive actual costs higher or lower include actual participation rates, the future cost of disposing biosolids, and federal regulations.
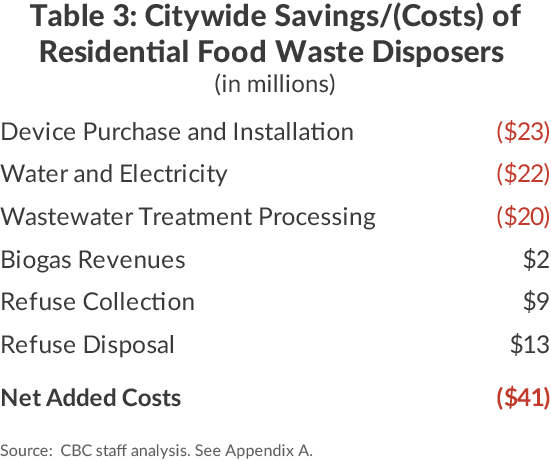
The net reduction in DSNY collection and disposal costs of $22 million per year, combined with the annualized cost of installation ($23 million), device operations ($22 million), and DEP processing costs ($18 million) yields an additional citywide cost for in-sink disposers of $41 million per year. This cost estimate assumes 100 percent participation in households served by treatment plants with physical capacity. On a per-ton basis, the net added costs would be $278, far less than the cost of curbside organics collection.
While in-sink disposers would be far less expensive as a method for organic waste diversion than curbside collection, they would divert less material and pose numerous logistical issues. Many residential buildings have bans in place, and additional costs are likely to accrue to building managers for occasional maintenance and repair work. Clogged pipes may also occur more often due to additional grease put down the sink. Despite resistance from building owners, residents would benefit from reduced trash odors, longer intervals between emptying the trash, and potentially fewer pest and rodent problems. Reduced food waste set on city sidewalks prior to collection would also have positive effects on odors and pests.
Options for Cost-Effective Organics Diversion
The above analysis finds citywide organic waste diversion is not a cost-neutral strategy: the cost of relying upon curbside collection without significant reduction in refuse collection would be prohibitive. Nonetheless, opportunities may exist to divert food waste and other organic materials in some neighborhoods, and DSNY should explore these opportunities.
Two potential strategies for economical diversion of organic waste are:
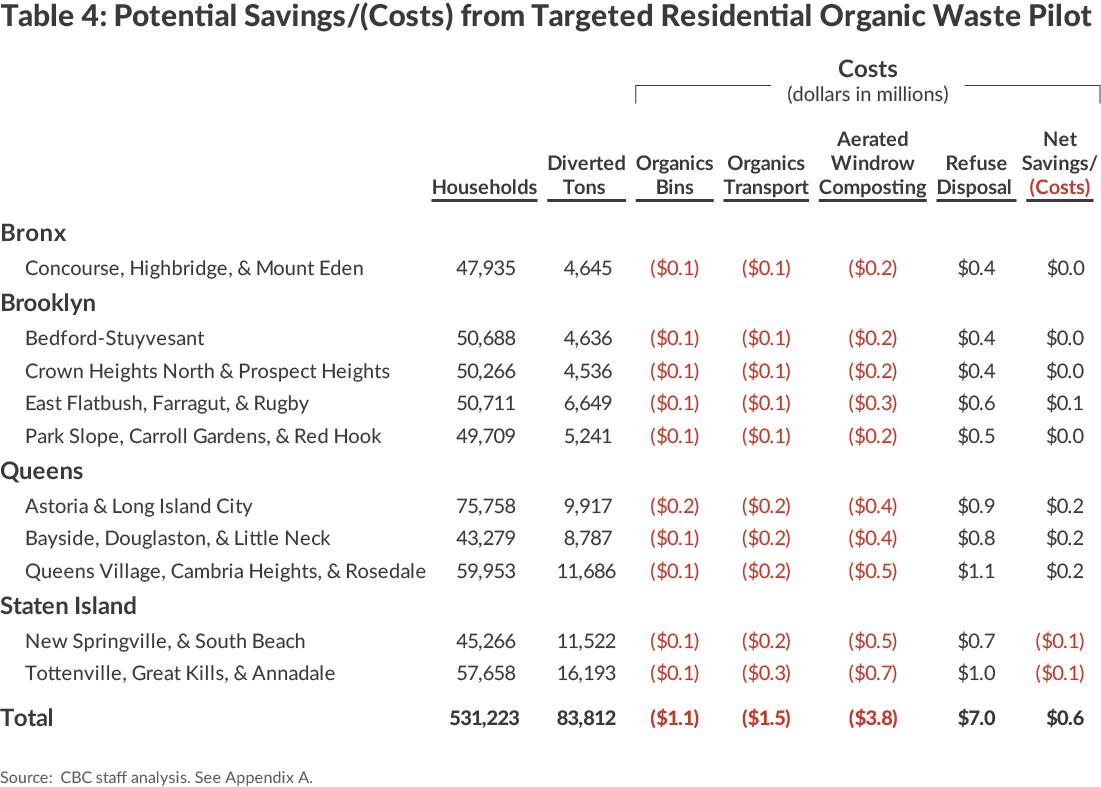
- Expand curbside collections only where additional collection routes are not required. Only one sanitation district can economically divert organic waste at current capture rates. If sanitation districts can divert organic waste at the same rate as recyclable paper, metal, glass, and plastic, as many as 10 districts could implement curbside organics diversion without adding new collection costs. This could be accomplished by dropping a weekly refuse pickup or collecting refuse and organics at the same time in dual-bin trucks. A reduction in refuse pickups would be challenging, requiring a substantial increase in resident participation rates and City Council approval. However, if DSNY limited source-separated curbside residential organic waste collection to districts that do not require additional collections, the City could divert 83,812 tons while avoiding new costs. Assuming the organic material is processed at an aerated windrows composting facility 75 miles from the City, the program would save $610,800 per year. The savings from avoided refuse export and disposal at landfills and combustion plants would offset the costs of new bins, transportation, and processing. (See Table 4.) Additional operational efficiencies or partnerships with the private sector could further allow for cost-effective program expansions in additional neighborhoods.
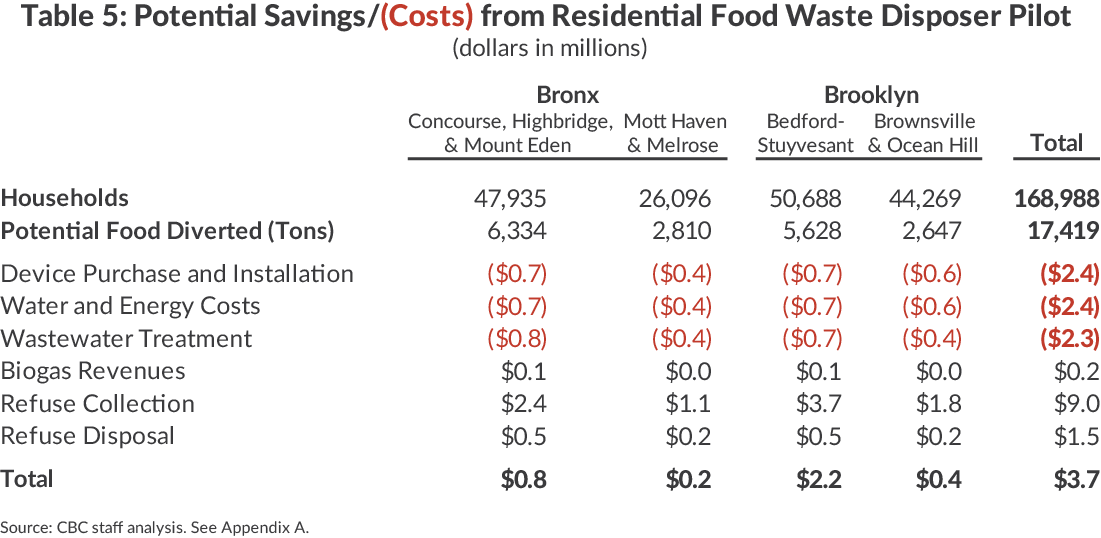
- Consider encouraging use of in-sink disposers in neighborhoods with adequate treatment plant infrastructure and capacity to reduce garbage collection. Diversion of food waste through in-sink disposers would be a cost-effective strategy in parts of the city with sufficient wastewater treatment infrastructure. DEP and DSNY should collaborate to identify suitable neighborhoods where sufficient capacity exists at the wastewater treatment plants and trash collections could be reduced. This analysis finds two districts in the Bronx and two in Brooklyn in areas served by adequate wastewater treatment infrastructure that could divert 17,419 tons of food waste and drop a weekly refuse pickup if disposers were adopted. This would generate $9 million in annual savings for DSNY and reduce truck traffic in these areas. Achieving such collection savings will require collaboration with the City Council. While DEP processing costs would increase $2.3 million annually, the collection reduction combined with avoided refuse disposal and revenues from biogas generation in DEP digesters would produce net savings of $8.4 million. About half of these savings would be offset by an additional $2.4 million (annualized) for device purchase and installation and $2.4 million annually for energy and water costs. (See Table 5.)
Conclusion
Citywide curbside organics collection would add new costs ranging from $177 million to $251 million annually, largely to pay for new truck routes. At least 88,000 new DSNY truck-shifts would be needed, adding traffic and contributing to local air pollution. Moreover, if residential or commercial organic waste diversion were to expand significantly, accessing processing capacity close to New York City would be a challenge, at least in the short run. If 20 percent of residential and business organic waste was diverted, all existing regional capacity would be exhausted and an additional 175,000 tons of annual capacity would be needed. Numerous developments have been proposed within and near the city that could accommodate this growth; their realization and cost structure need to be assessed in determining the feasibility of a large-scale New York City organics program.
An option for cost-effective organics recycling is to consider it only in those neighborhoods in which an additional collection route is not necessary. This could be achieved by dropping a weekly refuse pickup or using dual-bin trucks to collect organics and refuse at the same time on those routes with sufficient unused capacity. DSNY is already implementing such practices in several neighborhoods in the residential organics pilot and has expressed interest in identifying additional operating efficiencies. At a 20 percent capture rate this approach would only be viable in one sanitation district; should capture rates rise to current recycling rates (double that seen in the pilot program), this strategy could be viable in 10 districts, and could divert nearly 84,000 tons annually without adding new costs.
In areas where excess collection capacity does not exist, DEP and DSNY should collaborate in the design of pilot demonstrations for in-sink food waste disposers. These devices can deliver food waste to the anaerobic digesters already in operation at wastewater treatment plants. As the City invests in digester upgrades and equipment to improve its reuse of digester gas, food waste disposers could enable some digesters to function more efficiently. Installing food waste disposers in the four neighborhoods served by wastewater treatment plants with excess capacity and the capacity to reduce collection frequency could reduce costs by $3.7 million; collection and disposal savings of $8.4 million would be offset by the $2.4 million annualized cost of devices and the additional cost for water and electricity of $2.4 million per year.
If wider diversion of organic waste is a high priority, collection costs must be brought down as part of the program. This may require fundamentally altering collection routes and practices. For example, opening all or some residential waste collection to a competition in which private carters could bid on routes could reduce costs by more than enough to cover the additional collections required.63 As New York City seeks to achieve environmental benefits through the expansion of organic waste diversion, municipal leaders need to be mindful of the already outsized costs for waste collection.
Download Report
Can We Have Our Cake and Compost It Too?Footnotes
- CBC staff analysis of New York City Department of Sanitation, Fiscal Year 2014 Cost per Ton Analysis.
- See: Citizens Budget Commission, A Better Way to Pay for Solid Waste Management (February 2015).
- New York City Mayor’s Office of Sustainability, One New York Summary of Initiatives, www1.nyc.gov/html/onenyc/downloads/pdf/publications/OneNYC-Summary-of-Initiatives.pdf.
- New York City Department of Sanitation, 2015 NYC Organics Collection Report (October 2015), p. 5, www1.nyc.gov/assets/dsny/downloads/pdf/studies-and-reports/OrganicsCollection-LL77-NYCOrganicsCollectionReport-2015.pdf.
- Tonnage and cost figures for DSNY derived from New York City Department of Sanitation, Fiscal Year 2014 Cost per Ton Analysis, and New York City Mayor’s Office of Operations, Mayor’s Management Report (September 2015), p. 123, http://www1.nyc.gov/assets/operations/downloads/pdf/mmr2015/dsny.pdf; and commercial figures from Citizens Budget Commission, 12 Things New Yorkers Should Know About Their Garbage (May 2014), pp. 1-2.
- New York City Department of Sanitation, Fiscal Year 2014 Cost per Ton Analysis; and New York City Mayor’s Office of Operations, Mayor’s Management Report (September 2015), p. 124, www1.nyc.gov/assets/operations/downloads/pdf/mmr2015/dsny.pdf.
- Methane is generated by the decomposition of organic material in the anaerobic conditions of a landfill. CBC staff analysis of New York City Mayor’s Office of Long-Term Planning and Sustainability, New York City’s Pathways to Deep Carbon Reductions (December 2013), pp. 99-114, http://s-media.nyc.gov/agencies/planyc2030/pdf/nyc_pathways.pdf.
- New York City Department of Sanitation, 2012 Annual Report on Alternative Fuel Vehicle Programs (March 2013), p. 1, www.nyc.gov/html/dcas/downloads/pdf/fleet/fleet_local_law_38_DSNY_2012_final_report_3_25_2013.pdf.
- In fiscal year 2014, DSNY collected 3.7 million tons of waste (3.2 million tons of refuse and 553,200 tons of recycling). Assuming 90 percent of DSNY collections are residential and 31 percent of that is compostable organic material, city residents generate 1,045,000 tons annually. New York City Department of Sanitation, Local Law 77 of 2013 Organics Collection Pilot Program Report, through March 2014, p. 5, www1.nyc.gov/assets/dsny/downloads/pdf/studies-and-reports/OrganicsCollection-LL77-DiversionReportI-2014.pdf; New York City Office of Management and Budget, DSNY FY2014 Export Costs by Vendor; and New York City Office of the Mayor, Preliminary Mayor’s Management Report, Fiscal Year 2015 (February 2015), p. 92, www.nyc.gov/html/ops/downloads/pdf/pmmr2015/dsny.pdf.
- New York City Department of Sanitation, New York City 2004-05 Residential and Street Basket Waste Characterization Study, Section 4.4, pp. 79-93, www1.nyc.gov/assets/dsny/downloads/pdf/studies-and-reports/2004-2005-waste-characterization.pdf.
- The neighborhoods in the pilot are Westerleigh, Mariner’s Harbor, Graniteville, Castleton Corners, Port Richmond, and West Brighton in Staten Island; Throgs Neck, Country Club, Silver Beach, Edgewater Park, Riverdale, North Riverdale, and Fieldston in the Bronx; Windsor Terrace, Gowanus, Park Slope, Carroll Gardens, Cobble Hill, Red Hook, Bay Ridge, Sunset Park, Greenpoint, North Williamsburg, and Bay Ridge in Brooklyn; and Hamilton Beach, Howard Beach, Lindenwood, South Ozone Park, Ozone Park, Glendale, Middle Village, and Maspeth in Queens. New York City Department of Sanitation, 2015 NYC Organics Collection Report (October 2015), p. 11-12, www1.nyc.gov/assets/dsny/downloads/pdf/studies-and-reports/OrganicsCollection-LL77-NYCOrganicsCollectionReport-2015.pdf.
- New York City Department of Sanitation, “Instruction Brochure for Once per Week Collection” (accessed April 27, 2015), www1.nyc.gov/assets/dsny/downloads/pdf/recycling-and-garbage/OCP-2015expansion-1collection-per-week.pdf.
- CBC staff analysis of New York City Department of Sanitation, NYC Organics Collection Pilot: Diversion Report II (January 2015) and Diversion Report III (June 2015), www1.nyc.gov/assets/dsny/about/inside-dsny/organics-collection-pilot-reports-2014-2015.shtml; New York City Department of Sanitation, New York City 2004-05 Residential and Street Basket Waste Characterization Study, Section 4.4, pp. 79-93, www1.nyc.gov/assets/dsny/about/inside-dsny/waste-characterization-2005.shtml; New York City Department of Sanitation, Annual Report: New York City Curbside and Containerized Municipal Refuse by Borough and District, Fiscal Year 2015, www1.nyc.gov/assets/dsny/docs/about_dsny-curbside-collections-FY2015_0815.pdf; U.S. Census, American Community Survey, Selected Housing Characteristics: 2013; and New York City Open Data, “Department of Sanitation Recycling Diversion and Capture Rates by Community District” (accessed October 2, 2015), https://data.cityofnewyork.us/Environment/Recycling-Diversion-and-Capture-Rates/gaq9-z3hz.
- In fiscal year 2015, DSNY exported 10,117 tons of organic waste at a total cost of $1.1 million, according to data provided by the New York City Office of Management and Budget. New York City Department of Sanitation, 2015 NYC Organics Collection Report (October 2015), p. 45, www1.nyc.gov/assets/dsny/downloads/pdf/studies-and-reports/OrganicsCollection-LL77-NYCOrganicsCollectionReport-2015.pdf; Testimony of Kathryn Garcia, Commissioner of the City of New York Department of Sanitation before the New York City Council Committee on Sanitation and Solid Waste Management, Hearing on the FY 2016 Preliminary Budget and Mayor’s FY 2015 Preliminary Management Report (March 25, 2015), pp. 4-5, http://legistar.council.nyc.gov/View.ashx?M=F&ID=3687524&GUID=4AEABC44-3C41-48F0-BB3F-F84F08610C12; and New York State Department of Environmental Conservation, 2014 Transfer Station Reports for Brooklyn Transfer LLC, Tully Environmental, IESI NY Corporation Court Street, and Waste Management New York Varick 1, ftp://ftp.dec.state.ny.us/dshm/SWMF.
- New York City Department of Sanitation, New York City Commercial Solid Waste Study and Analysis, 2012, p. 39, www1.nyc.gov/assets/dsny/downloads/pdf/studies-and-reports/2012-commercial-waste-study.pdf.
- New York City Department of Environmental Protection, Commercial Food Waste Disposal Study (December 2008), Appendix A, www.nyc.gov/html/dep/pdf/dep_commercial_food_waste_disposal_study_12312008.pdf.
- New York City Local Law, Int. 1162-2013, http://legistar.council.nyc.gov/LegislationDetail.aspx?ID=1482542&GUID=DDD94082-C0E5-4BF9-976B-BBE0CD858F8F&Options=ID|Text|&Search=food+waste.
- New York City Department of Sanitation, Commercial Organics Assessment, 2015. See: New York City Department of Sanitation Public Hearing on Proposed Rules Governing Source Separation and Handling Requirements for Organic Waste Generated by Certain Commercial Establishments (October 5, 2015), p. 4, www1.nyc.gov/assets/dsny/downloads/pdf/about/laws/DSNY%20Public%20Hearing%20Proceedings%20Commercial%20Organic%20Waste%2010.5.15.pdf, and New York City Department of Sanitation, 2015 NYC Organics Collection Report (October 2015), p. 41, www1.nyc.gov/assets/dsny/downloads/pdf/studies-and-reports/OrganicsCollection-LL77-NYCOrganicsCollectionReport-2015.pdf.
- [1] The mandate would apply to food service establishments in hotels with 150 or more rooms; food service vendors in arenas and stadiums with seating capacity of at least 15,000; food manufacturers with floor area of at least 25,000 square feet; and food wholesalers with floor area of at least 20,000 square feet. Kathryn Garcia, Commissioner, New York City Department of Sanitation, “City and State On Energy Panel” (October 7, 2015); and New York City Department of Sanitation, Notice of Public Hearing and Opportunity to Comment (August 19, 2015), www1.nyc.gov/assets/dsny/docs/zerowaste_DSNY-Proposed-Commercial-Organics-Rule-With-Certifications-Preliminary-Certifications-8-19-15_0915.pdf.
- DEP is concerned about compliance with the existing ban on commercial food waste grinders given the energy-intensive nature of onsite digesters.
- De Blasio Administration Proposed Organics Recycling Requirements for Large-Scale Food Establishments, Vendors, Manufacturers, Wholesalers (press release, July 2, 2015), www1.nyc.gov/office-of-the-mayor/news/467-15/de-blasio-administration-proposes-organics-recycling-requirements-large-scale-food.
- Other alternatives for landfill diversion such as combustion and gasification are not considered in this report because they could be used broadly for all types of solid waste, not just the organic fraction. While minimal excess capacity is available in the region at such facilities, new combustion or thermal plants could process organics without the need for source-separated collection.
- For example, the Ulster County Resource Recovery Agency sells compost for $30 per ton. Ulster County Resource Recovery Agency, Fee Schedule (accessed October 2, 2015), http://ucrra.org/files/2015/05/Fee-Schedule-2015.pdf; and Jon Hurdle, “Heady Times for Compost Pioneers” New York Times (February 25, 2013), http://green.blogs.nytimes.com/2013/02/25/heady-times-for-compost-pioneers/?_r=0.
- For example, San Francisco uses several composting sites for its organic waste, including a 22-acre facility north of the city that processes 100,000 tons per year; six similarly-sized sites would be needed to process just a third of New York City’s organic waste. In-vessel systems have smaller footprints, about three to six acres for a 40,000-ton capacity system, but upfront capital costs are much higher. Recology Organics, “Jepson Prairies Organics” (accessed October 1, 2015), www.jepsonprairieorganics.com/index.php/compost-facilities-old/jepson-prairie-organics; and United States Environmental Protection Agency, Food Scrap Recycling: A Primer for Understanding Large-Scale Food Scrap Recycling Technologies for Urban Areas (October 2012), pp. 21-22, www3.epa.gov/region1/composting/pdfs/FoodScrapRecycling.pdf.
- Annual contract cost provided by the New York City Office of Management and Budget. Some of the cost is offset by fees charged to commercial users and revenues from the sale of compost (DSNY collects about $900,000 annually). New York City Department of Sanitation, “Commercial Landscaper Waste” (accessed April 29, 2015), www1.nyc.gov/assets/dsny/zerowaste/businesses/commercial-landscaper-waste.shtml; New York City Office of Management and Budget, Adopted 2016 Financial Plan Revenue (June 2015), p. 38, www.nyc.gov/html/omb/downloads/pdf/adopt15_rfpd.pdf; and New York City Department of Sanitation, Local Law 42: A 2012 Assessment of Composting Opportunities in NYC (2012), pp. 6-7, www1.nyc.gov/assets/dsny/downloads/pdf/studies-and-reports/2012-assessment-of-composting-opportunities.pdf.
- CBC staff converted cubic yard figures to tons. The Fresh Kills composting site is permitted for 72,500 cubic yards of yard waste per year and processed 63,382 cubic yards in 2014. The food waste permit allows 10 wet tons of food waste per day and 30 tons per week. The site processed 709 cubic yards of food waste in 2014, or about 355 tons. Communication with Samsudeen K. Arakhan, Environmental Engineer 3, Division of Materials Management, New York State Department of Environmental Conservation (August 26, 2015).
- DSNY applied to expand yard waste capacity to 319,000 cubic yards per year and food waste capacity to 600 tons per week. Communication with Samsudeen K. Arakhan, Environmental Engineer 3, Division of Materials Management, New York State Department of Environmental Conservation (August 26, 2015).
- The facility may also accept 50,000 tons of wood waste; 25,000 tons of yard waste; and 23,000 tons of mined hydrolyzed plant protein. Connecticut Department of Energy and Environmental Protection, New Milford Connecticut Farms, LLC Draft Permit to Operate, p. 4, www.ct.gov/deep/lib/deep/public_notice_attachments/draft_permits/2013november7newmilfordcoonecticutfarms.pdf. Final permit provided upon request. Communication with Jen Iannucci, Director, Housatonic Resource Recovery Authority (September 9, 2015); and Yale University Sustainability, “Compostable Waste” (accessed September 9, 2015), http://sustainability.yale.edu/compost.
- Connecticut Department of Energy and Environmental Protection, New Milford Connecticut Farms, LLC Quarterly Reports, 2014. Provided upon request.
- Net capacity from these facilities is unclear, given the amount of organic waste likely to come from other municipalities is unknown. New York City Department of Sanitation, 2015 NYC Organics Collection Report (October 2015), p. 41, www1.nyc.gov/assets/dsny/downloads/pdf/studies-and-reports/OrganicsCollection-LL77-NYCOrganicsCollectionReport-2015.pdf.
- CBC staff analysis of Agreement Between the City of San Jose and Zero Waste Energy Development Company for Organics Processing Services (October 18, 2011), Exhibit A, www.sanjoseca.gov/DocumentCenter/View/35418; City of San Jose, Proposed 2014-2015 Fees and Charges Report, p. C-7, www.sanjoseca.gov/DocumentCenter/View/30262; and Zero Waste Energy Development Company, “ZWEDC – San Jose, California” (accessed October 1, 2015), http://zerowasteenergy.com/what-we-do/our-projects/city-of-san-jose/.
- New York City Department of Environmental Protection, “Wastewater Treatment Process” (accessed October 1, 2015), www.nyc.gov/html/dep/html/wastewater/wwsystem-process.shtml, and New York City Department of Environmental Protection, New York City’s Wastewater Treatment System, www.nyc.gov/html/dep/pdf/wwsystem.pdf.
- DEP plans include a combined heat and power project at the North River plant in Manhattan and upgrading existing fuel cells, engines, and digester equipment. New York City Office of the Mayor, ONENYC, p. 305, http://www.nyc.gov/html/onenyc/downloads/pdf/publications/OneNYC.pdf.
- Reuse of biosolids is more expensive than landfilling and faces opposition from groups concerned with the hazardous nature of biological waste. Marla Weinstein, From Waste to Plate: Examining the Role of Urban Biosolids in Recycling Phosphorous, p. 17, (May 2013), http://academiccommons.columbia.edu/download/fedora_content/download/ac:162009/CONTENT/Weinstein_FromWastetoPlate.pdf; and Hilary Potkewitz, “Bronx Stews Over Sewage Treatment Proposals” Crain’s New York Business (January 16, 2011), www.crainsnewyork.com/article/20110116/SUB/301169986/bronx-stews-over-sewage-treatment-proposals.
- “City Announces Innovative New Partnerships that Will Reduce the Amount of Organic Waste Sent to Landfills, Produce a Reliable Source of Energy, and Improve Air Quality (press release, December 19, 2013), www.nyc.gov/html/dep/html/press_releases/13-121pr.shtml#.VTkEuyFVhBc.
- Waste Management and DEP have committed to increasing capacity from 50 tons per day in 2016 to 250 tons per day by 2018. Annual processing capacity assumes operations six days per week.
- Annual processing capacity based on 500 tons per day, six days per week, 52 weeks per year. An initial pilot determined the addition of food waste significantly increased methane output at Newtown Creek but DSNY waste is not well-suited for digestion due to inclusion of yard waste and contamination issues. New York City Department of Environmental Protection, “City Announces Innovative New Partnerships that Will Reduce the Amount of Organic Waste Sent to Landfills, Produce a Reliable Source of Clean Energy, and Improve Air Quality” (press release, December 19, 2013), www.nyc.gov/html/dep/html/press_releases/13-121pr.shtml#.U9jxxuNdXHU; Anthony Fiore, Director of Energy Regulatory Affairs, New York City Mayor's Office of Sustainability, Presentation for the New York Biogas Study Group: Market Development Summit (May 21, 2015), slide 21, http://nybsg.org/wp-content/uploads/sites/302/2015/05/Anthony-Fiore-Presentation.pdf; Bridget Anderson, “New York City Organics Collection” BioCycle, Vol. 56, No. 1 (January 2015), p. 64, http://www.biocycle.net/2015/01/14/new-york-city-organics-collection/; and New York State Department of Environmental Conservation, Notice of Complete Application (September 2014), www.wm.com/NYCMA/WM_Varick1_NOCA-REV1.pdf.
- The gas-to-grid construction is expected to be completed in the fall of 2016. For the first five years of operation, the new equipment will be exempt from property taxes up to a maximum savings of $3.2 million. Additionally, for the first five years National Grid will retain 100 percent of revenues from the sale of gas; after that period, revenues in excess of operating and capital costs will be split between National Grid and the City. The City also received a $250,000 grant from the New York State Energy Research and Development Agency (NYSERDA) to monitor the project’s performance. New York City Industrial Development Agency (NYCIDA), Board Meeting Minutes (June 12, 2012), www.goodjobsny.org/sites/default/files/docs/IDA%20June%2012%202012%20PART%202.pdf; New York City Industrial Development Agency (NYCIDA), Project Cost/Benefit Analysis (June 7, 2012), www.goodjobsny.org/sites/default/files/docs/ng_public_hearing_pacage_eaf_sheets_11_to_21_removed_5.24.12.pdf; and City of New York Franchise and Concession Review Committee, Construction License and Concession Agreement by and between the City of New York acting by and through its Department of Environmental Protection and the Brooklyn Union Gas Company doing business as National Grid NY (November 13, 2013), p. 69, www.nyc.gov/html/mocs/downloads/pdf/fcrc_other/fcrc_meeting_documents%2011_13_13.pdf.
- New York City Office of Management and Budget, FY2015 Organics Processing Costs; and New York State Department of Environmental Conservation, Waste Management Varick I Transfer Station Report (2014), ftp://ftp.dec.state.ny.us/dshm/SWMF/Transfer%20Station/Transfer%20Annual%20Reports/Transfer%20Annual%20Reports%20-%202014/R2/24T66_WMNY_Varick_1_ts_R2_2014.2015-03-10.AR.pdf.
- Estimate includes 1.0 million tons of residential material and 747,000 tons of commercial material.
- Calculation is net of 7,000 tons of organic waste collected by DSNY in calendar year 2014.
- Moreover, a 2014 CBC report estimated DSNY collection costs are more than double those of the city’s private waste carters to handle business waste. Citizens Budget Commission, 12 Things New Yorkers Should Know About Their Garbage (May 2014), www.cbcny.org/sites/default/files/REPORT_GarbageFacts_05222014.pdf.
- On average, workers in this district dump 1.9 truck-loads per shift, versus an average of 1.1 citywide. This Bronx district is located close to transfer stations, enabling workers to complete more than one dump per shift. CBC staff analysis of fiscal year 2012 data provided by the New York City Department of Sanitation.
- In addition to Concourse in the Bronx, districts that could drop a pickup are Bedford-Stuyvesant, Park Slope/Red Hook, Crown Heights/Prospect Heights, and East Flatbush in Brooklyn; Astoria/Long Island City, Bayside, and Queens Village/Rosedale in Queens; and New Springville/South Beach and Tottenville/Great Kills in Staten Island.
- Six of these districts could alternatively switch to dual-bin trucks: Park Slope, Astoria, Bayside, New Springville, Tottenville, and Queens Village. Dual-bin trucks cost $300,000 and have a useful life of seven years.
- New York City Office of Management and Budget, Fiscal Year 2014 Export Costs by Vendor.
- New York City Office of Management and Budget, Organics Processing Costs.
- Both Ag Choice in New Jersey and the former Wilmington Organic Recycling Center in Delaware charge tipping fees of $45 per ton. Fees at more distant facilities are slightly lower. However, current prices at New Milford Farms in Connecticut, the facility with the greatest excess capacity in the region today, are $60 per ton. Association of New Jersey Recyclers, Legislative Proposal: Commercial Food Waste Recycling (March 27, 2014), p. 6, www.anjr.com/news_front/2014/ANJR%20Food%20Waste%20Recycling%20White%20Paper%203-27-14.pdf; Jon Hurdle, “Heady Times for Compost Pioneers” New York Times (February 25, 2013), http://green.blogs.nytimes.com/2013/02/25/heady-times-for-compost-pioneers/?_r=0; Communication with Jen Iannucci, Director, Housatonic Resource Recovery Authority (September 9, 2015); and Yale University Sustainability, “Compostable Waste” (accessed September 9, 2015), http://sustainability.yale.edu/compost.
- There are few operating plants for examples of actual charges. The anaerobic San Jose plant charges $75 to $99 per ton; the Oakland co-digestion plant charges $30 to $65 per ton. CBC staff adjusted year-one tipping fees according to contracted inflation adjustments. Agreement Between the City of San Jose and Zero Waste Energy Development Company for Organics Processing Services (October 18, 2011), Exhibit A, www.sanjoseca.gov/DocumentCenter/View/35418; City of San Jose, Proposed 2014-2015 Fees and Charges Report, p. C-7, www.sanjoseca.gov/DocumentCenter/View/30262; Zero Waste Energy Development Company, “ZWEDC – San Jose, California” (accessed October 1, 2015), http://zerowasteenergy.com/what-we-do/our-projects/city-of-san-jose/; and East Bay Municipal Utility District, “Wastewater Rates – Effective July 1, 2015” (accessed January 15, 2016), www.ebmud.com/wastewater/rates-and-charges/.
- City of New York Request for Proposals, Waste Bins: Organics Collection (DSNY) (October 10, 2014), https://mspwvw-dcscpfvp.nyc.gov/CROLPublicFacingWeb/Search/GetFile?sectionId=6&requestId=20141010017&requestStatus=Archived&documentId=17056.
- New York City Department of Environmental Protection, The Impact of Food Waste Disposers in Combined Sewer Areas of New York City (1997), www.nyc.gov/html/dep/pdf/grinders.pdf.
- U.S. Census Bureau, 2013 American Housing Survey, Heating, Air Conditioning and Appliances (accessed October 5, 2015), http://factfinder.census.gov.
- The Visionaire, “Homes – Residence Features” (accessed December 15, 2015), www.thevisionaire.com/#/Homes/Residence%20Features?mode=english; and Douglas Elliman Real Estate, “Listing for One57, 157 West 57th Street, 44B” (accessed December 15, 2015), www.thealexanderteam.com/dev/property/details/one57-157-west-57th-street-44b. See: , Elizabeth Harris, “Besides the Gym and the Great Views, Don’t Forget to Mention the Garbage Disposal” New York Times (February 4, 2013), www.nytimes.com/2013/02/05/nyregion/garbage-disposals-are-the-new-kitchen-amenity.html.
- Ben Messenger, “Nutter Signs In-sink Food Waste Disposal Law in Philadelphia” Waste Management World (January 13, 2016), http://waste-management-world.com/a/nutter-signs-in-sink-food-waste-disposal-law-in-philadelphia.
- City of San Jose, Task No. 4 Project Memorandum No. 10B: Food Waste Separation (August 2009), p. 3, www.sanjoseca.gov/Archive/ViewFile/Item/1551.
- CBC staff analysis of New York City Department of Environmental Protection, Monthly Operating Efficiency, 2014 (accessed through New York Open Data), https://data.cityofnewyork.us/Environment/Wastewater-Treatment-Plant-Performance-Data/hgue-hj96.
- The permit limit is for solids removal prior to discharge.
- Anthony Fiore, Director of Energy Regulatory Affairs, New York City Mayor's Office of Sustainability, presentation to the American Biogas Study Group: Market Development Summit (May 21, 2015), slide 23, http://nybsg.org/wp-content/uploads/sites/302/2015/05/Anthony-Fiore-Presentation.pdf.
- Water Environment Research Foundation, Sustainable Food Waste Evaluation (2012), p. 3.15, http://www.werf.org/c/_FinalReportPDFs/OWSO/OWSO5R07e.aspx.
- City of Vancouver Greenest City 2020 Action Plan, Centralized Composting and Food Waste Disposer Use as Competing Organic Waste Management Strategies in Vancouver Multi-Family Homes (July 2012), p. 4, https://sustain.ubc.ca/sites/sustain.ubc.ca/files/Zero%20Waste%20-%20Alison%20McKenzie%20-%20Garburators%20vs%20%20Composting.pdf.
- New York State Department of Labor, “Prevailing Wage: Plumber and Electrician” (as of July 1, 2015), https://wpp.labor.state.ny.us/wpp/publicViewWageSchedule.do?method=showIt&scheduleTypeId=General%20Construction&id=1308 and https://wpp.labor.state.ny.us/wpp/publicViewWageSchedule.do?method=showIt&scheduleTypeId=General%20Construction&id=1381.
- Two additional districts, East Flatbush in Brooklyn and Queens Village in Queens, could drop a weekly refuse pickup based on volume, but are served by treatment plants with limited physical capacity (Coney Island and Jamaica).
- Chicago recently used this strategy to reduce the cost of expanding its recycling service; the competition led public recycling crews to change work rules and reduce their costs 24 percent. As a result of that savings and the award of contracts to private carters in four of six service areas, Chicago reduced total costs of expanded recycling service 37 percent. See: Citizens Budget Commission, Getting the Fiscal Waste Out of Solid Waste (September 2014), p. 9.