Delaying the Pain
The truth about cost-cutting in New York City's November Plan
Readers of this blog have probably heard about new and increased fees and charges that the Mayor included in the November budget modification to help close the looming $4.5 billion fiscal year 2012 budget gap: increased parking meter fees, higher charges for parks and recreation permits, a proposal to charge insured motorists who get into accidents for emergency response services. During one of the worst recessions in history that has many New Yorkers struggling to make ends meet, these revenue raisers are headline grabbers. A closer look at the November plan reveals two notable points about the gap closing measures proposed for the current fiscal year:
- Nearly two-thirds of the current year program of $585 million consists of new revenue, not expenditure cuts, but the new fees are only a small part of the large revenue package.
- The more modest program of $216 million in current year expenditure cuts is spread unevenly with health, welfare, libraries and cultural institutions bearing most of the burden.
Filling the holes with temporary revenues
The fiscal year 2011 portion of the program to eliminate the gap (commonly called the “PEG” or “agency program”) totals $585 million. This PEG consists of revenue actions (including the fees mentioned above), and expenditure actions which may be service cuts but may also be other types of cost-saving actions such as efficiency measures.
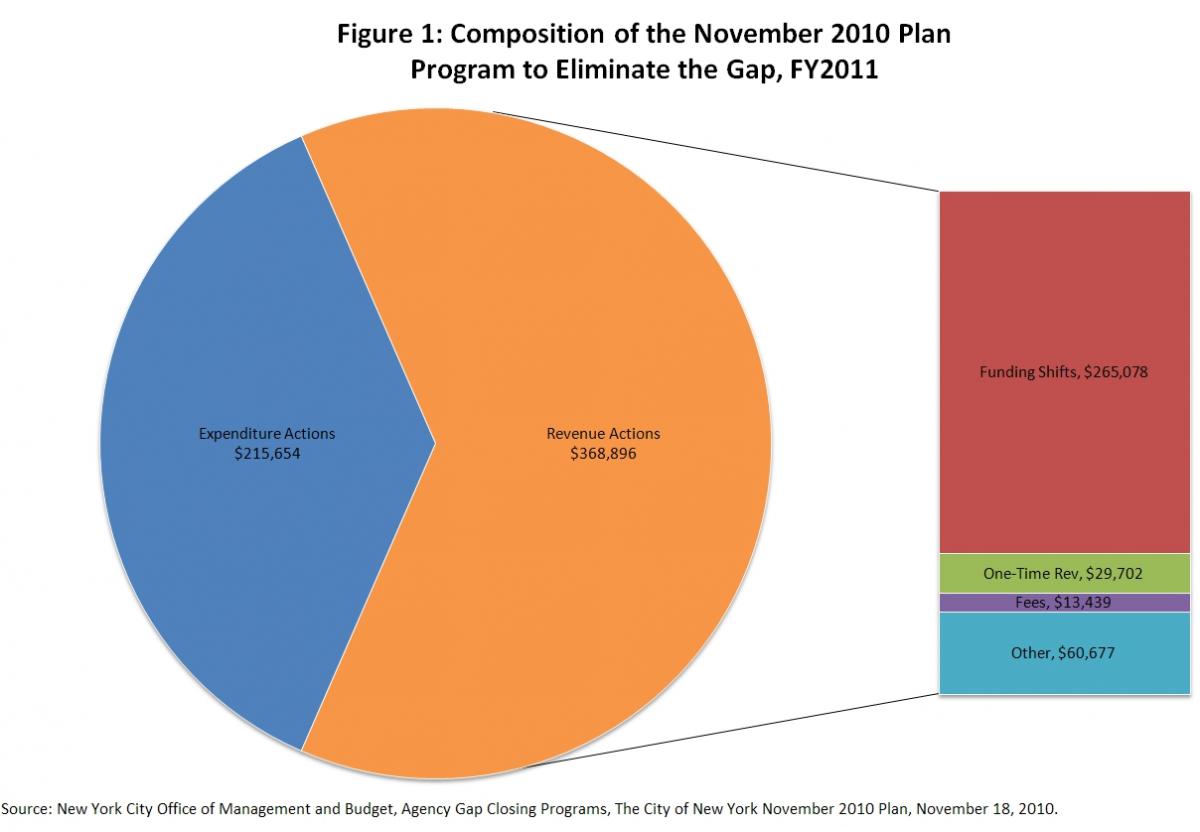
Of the $585 million of actions being taken in this fiscal year, $369 million or 63 percent comes from revenue actions.[1] (See Figure 1.) The new and increased fees that have made headlines are a small share of these revenue actions, less than 4 percent or about $14 million. Part of the reason the fees make up such a small share of the PEG is that they go into effect mid-year, with a few (like the charges for emergency response services) not going into effect until next fiscal year (if they make it through the budget negotiations).
Most of the current year revenue actions, nearly 72 percent, are “funding shifts;” that is substitutions of federal or state grants for local taxes. For example, $159 million in funding from the federal education jobs bill and $51 million in additional state aid will allow the City to sustain 4,000 teacher positions until fiscal year 2012. Other examples of funding shifts include $24.3 million from the federal Department of Homeland Security to fund police overtime, $10.6 million in one-time revenues from the state for Social Services, $7.9 million in Federal Highway Administration funds and $3.7 million in state funds for transportation projects, and $7.3 million in private grants to fund operations in the Fire Department. By and large, these funding shifts are not recurring revenues; many are associated with federal stimulus or residual relief funds for World Trade Center-related programs and end in fiscal year 2012
In addition to the funding shifts, there are plenty of other one-shot revenue sources in the fiscal year 2011 PEG, such as land and property sales, delays in procurement, drawdowns from trust funds and awards from litigation. Together, funding shifts and other one-time revenue sources make up nearly 80 percent of the revenues in the PEG and over 50 percent of the total PEG in this fiscal year.
Unequal treatment
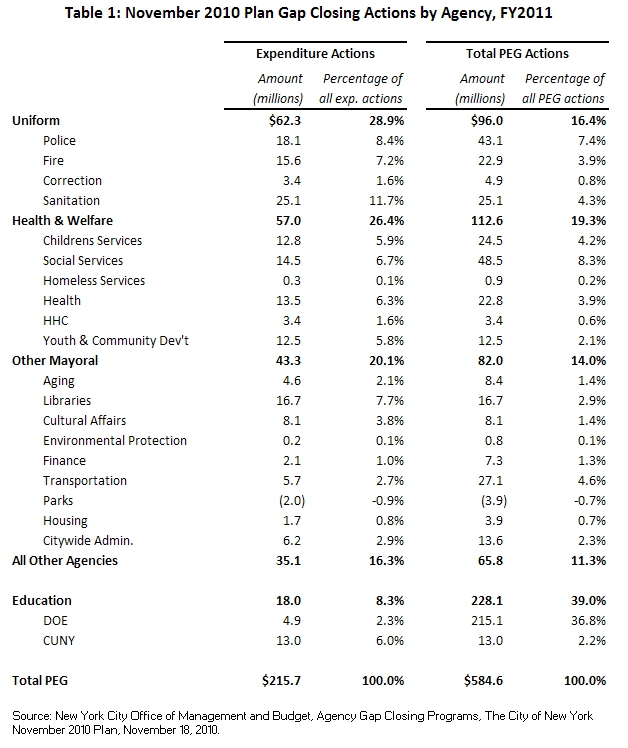
To the extent that certain agencies are aided more by revenue actions in the fiscal year 2011 PEG, many of the painful cuts to staff and services for those agencies have been put off while other agencies face the chopping block now. Table 1 shows this year’s expenditure actions and total PEG actions in the November plan by agency.
In FY2011, looking at the total PEG, it would appear that the Department of Education bears a heavy burden: almost 37 percent of the total PEG. But most of that comes from the infusion of cash from the federal government and other temporary shifting of funds. Expenditure cuts to education make up only 2 percent of all expenditure actions in the fiscal year 2011 PEG and represent less than one-tenth of one percent of the $7.6 billion City-funded education budget. (The total education budget before cuts is $19.1 billion for fiscal year 2011, with most funds coming from the state.)
By comparison, revenue actions make up a considerably smaller share of PEG actions in most of the health and welfare agencies, and the libraries and cultural institutions receive no help from additional revenues. Cuts to health and welfare agency budgets make up over a quarter of the expenditure actions in this year’s PEG, while libraries and cultural institutions contribute 11 percent to this year’s cost cutting measures.
Expenditure reductions may be achieved not only by reducing headcount or cutting services, but also by increasing efficiency or by reducing certain “other than personal services” costs, like office supplies. While the November Plan provides details on gap-closing actions, it can be difficult to assign them to categories of program cuts versus efficiency savings. One way to make the distinction is to separate expenditure actions that have headcount reductions versus those that do not.
For this fiscal year, about 42 percent of the dollar amount of expenditure actions has associated headcount reductions; these cuts save about $91.6 million and result in the loss of over 2,000 positions. Once again, the headcount-related cuts are not spread evenly among the agencies. In the uniformed agencies, the Fire Department is spared headcount reductions this year, while the Police Department will cut 350 civilian positions, sanitation will lose 200 uniformed workers and the Department of Correction will cut 28 positions. The savings from these cuts represent 76 percent, 40 percent and 51 percent, respectively, of these agencies’ expenditure actions for the current fiscal year. As noted previously, the DOE is able to completely avoid headcount reductions this fiscal year, but CUNY schools will be cutting 92 positions, for 90 percent of its expenditure actions.
Delaying the pain
While the story for the current fiscal year is mostly about newly found revenues and selected cuts hitting a few agencies hard, the picture for fiscal year 2012 is very different. According to current plans, which are subject to significant change due to State budget actions and City Council modifications, revenues will make up only about a quarter of the proposed $1 billion PEG for fiscal year 2012,with funding shifts and other one-shot revenues making up just 5 percent of all actions. Agencies face a much tighter expenditure squeeze in the year to come. Next year’s PEG includes over $750 million in expenditure actions, with $350 million in cuts to education alone, and a total headcount reduction of 8,264. As the easier opportunities for efficiency savings within each agency are exhausted, without reforms to reduce employee health insurance or pension costs, harmful cuts to services may become a major means to close future budget gaps.
By Courtney Wolf
[1] Calculations of the dollar amounts and shares of the PEG that fall into the revenue and expenditure categories cited in this post are based on categorization of PEG line items by CBC staff.

