Educating an Average NYC Public Elementary School Class Costs About $560,000
In 2017 educating an average elementary school class cost $561,246. Besides teacher compensation, that figure also includes the costs of non-classroom teachers, principals, support personnel and supplies, transportation and food, facility debt service, and central Department of Education (DOE) spending. An average middle school class was a little more costly, $590,351, while the average high school class was $534,050.
Most Funding Stays within the School
Citizens Budget Commission (CBC) staff calculated the average class based on the average class size and the average per student cost for elementary schools in Districts 1 to 32.1 Actual spending per student and per class vary based on the size of the school and the specific programs offered.
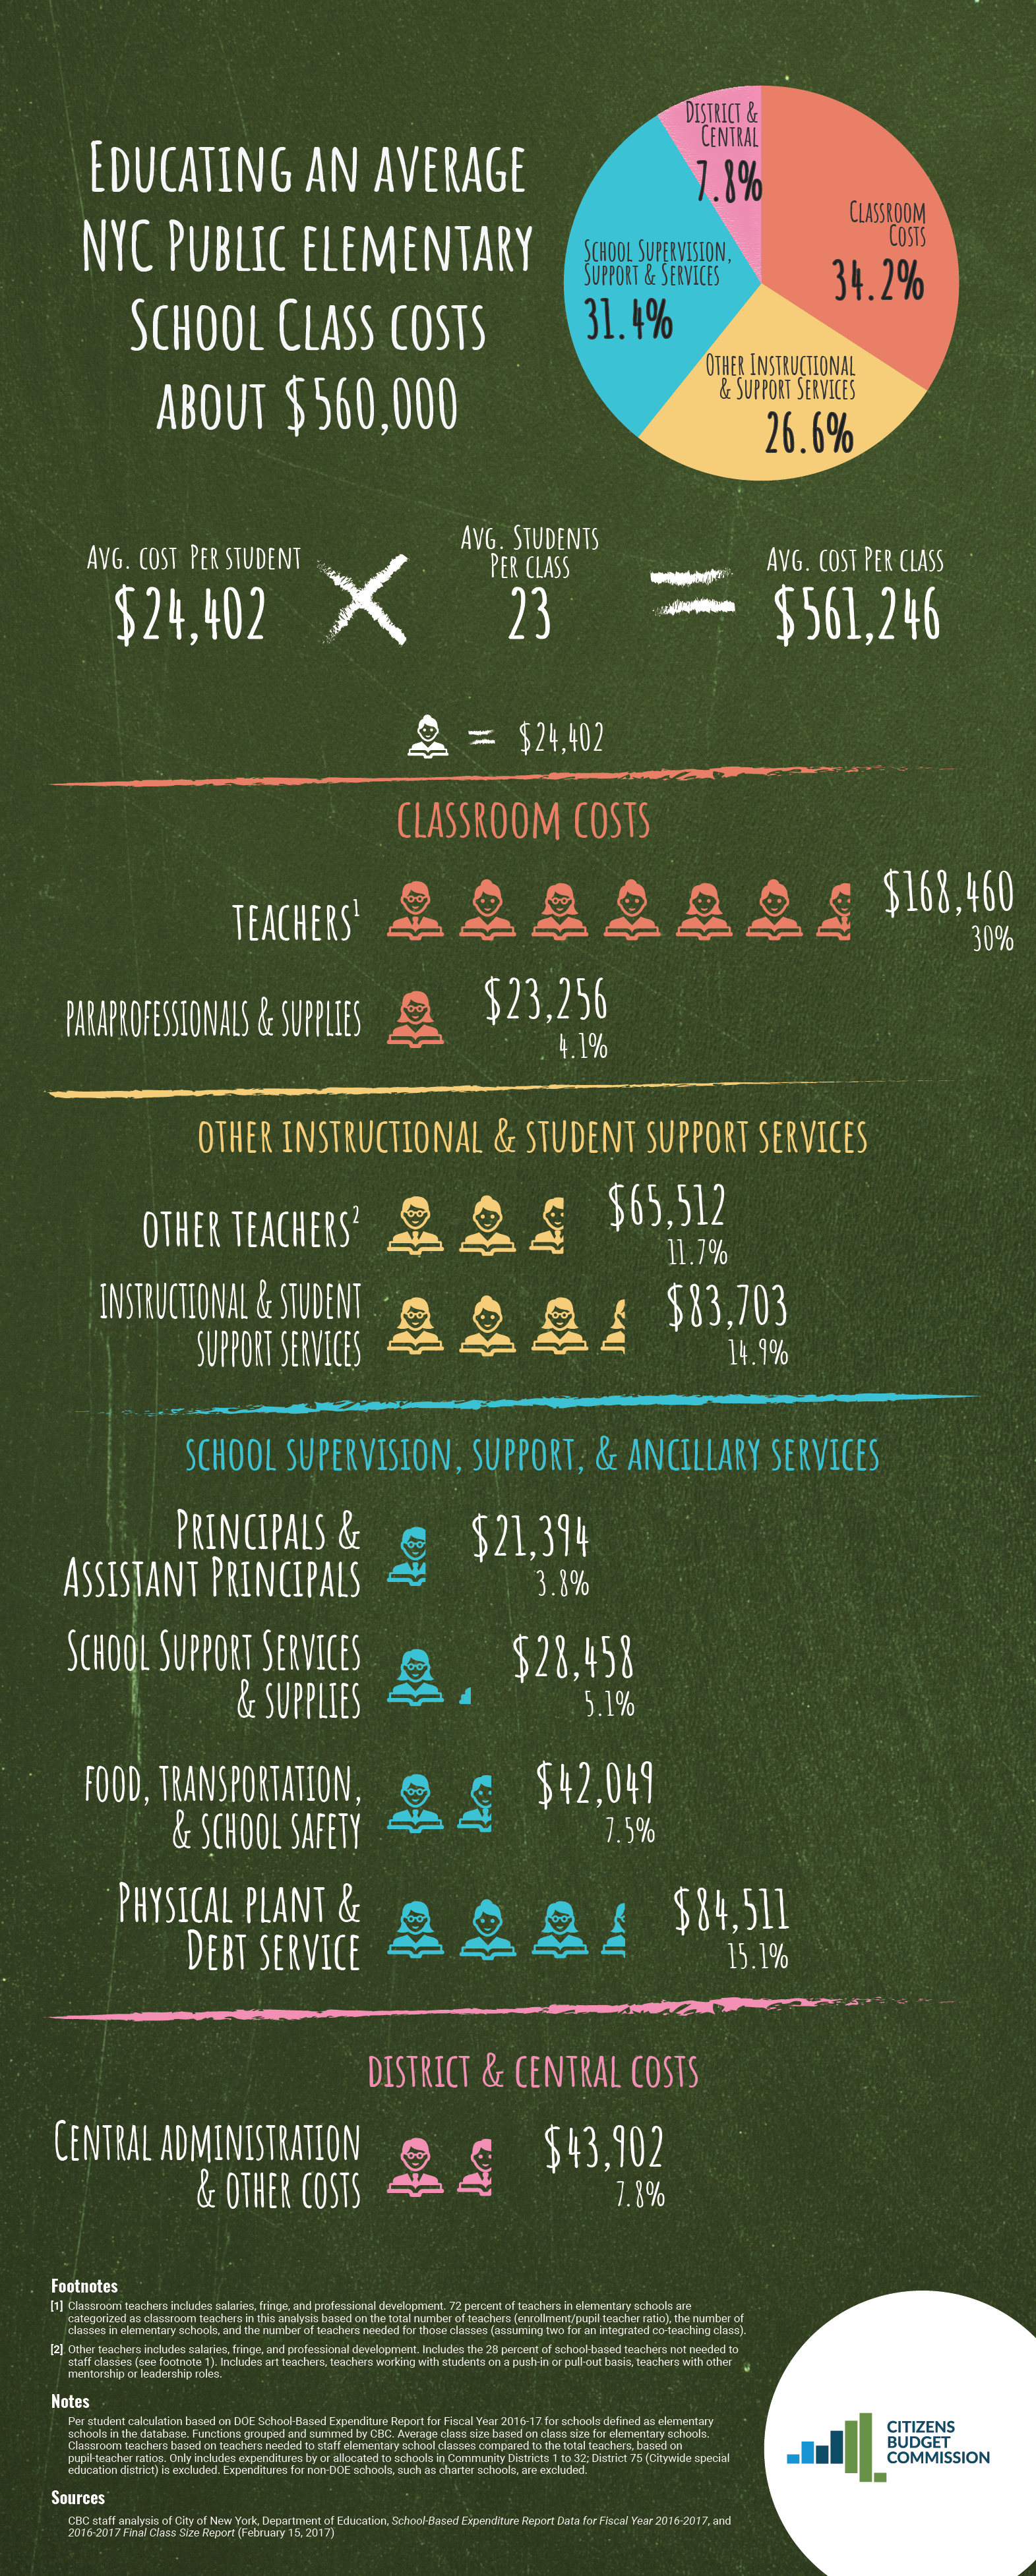
An average DOE elementary school class had about 23 students and the average per student funding was $24,402, resulting in the class costing a little more than $560,000. Of that 34 percent stayed within the classroom to fund the teacher, paraprofessionals, and supplies and materials.
- About 30 percent, or $168,500, funded the classroom teacher (or two teachers, for an integrated co-teaching class), including salaries, fringe benefits, and professional development.2 Fringe benefits were 62.5 percent of salary expenditures.
- Another $23,300, about 4 percent, provided funding for classroom paraprofessionals, textbooks, materials, and equipment.
An additional 27 percent, about $149,200, provided funding for other teachers and for instructional and classroom support services.
- $65,500 supported other school teachers, including those teaching art, reading, and music; providing special education on a push-in or pull-out basis; and in leadership or mentorship roles.
- Instructional and student support services, including special education evaluation, related services, school activities, librarians, and library books, cost $83,700, or nearly 15 percent of the total.
About one-third of the funding stayed within the school but was not directly providing classroom and instructional services.
- Principals and assistant principals comprised nearly 4 percent of spending ($21,400 per class), and 5 percent of spending was for school-based support, including school secretaries, attendance services, and computer support.
- Ancillary services were about $42,000 per class (8 percent)—divided among food services (45 percent), transportation (35 percent), and school safety (20 percent).
- About $84,500 (15 percent) was for the physical plant, including energy costs, maintenance, custodial services, and leases (if applicable). This category also includes a substantial expenditure for debt service to support capital improvements in schools.
The remaining 8 percent ($43,900) of the cost to educate an average elementary school class funded the cost of the DOE’s central and district offices and paid for health and welfare benefits of retired DOE employees.
How Do Middle Schools and High Schools Compare?
Middle and high school students move from class to class over the course of the day. Illustrative classes were created using an average class size of 25 students in middle and high school, and average per student expenditures of $23,614 in middle schools and $21,362 in high schools.3 The average middle school class was the costliest (more than $590,000), while the high school class was the least costly ($534,000).
While the allocation was generally comparable across school levels, with less than 60 percent funding the classroom and other instructional and student support, one-third supporting the school other than instructional classroom services, and a little less than one-tenth funding central costs, there were some differences between school levels.
Classroom and instructional and student support were slightly higher in elementary school, reflecting the greater presence of classroom-based paraprofessionals and related services for special education students in elementary schools. In high schools, spending on activities, summer school, and after school programs was higher (about twice the amount in elementary schools), while the spending on related services and special education evaluations was less.
Ancillary services (food, transportation, and school safety) were higher in elementary and middle schools and lower for high schools, with the reduction concentrated in food services and transportation. As students age, they are less likely to rely on school cafeterias and more likely to take mass transit than school buses, which was reflected in lower ancillary service expenditures.
Download Infographic
Educating an Average NYC Public Elementary School Class Costs About $560,000Footnotes
- Data are from school-based expenditure reports for fiscal year 2017, the most recent year available, and represent expenditures for schools in 32 community school districts. CBC staff analysis excluded expenditures for District 75, which exclusively serves severely disabled students, and expenditures for non-DOE students (such as charter schools, for example). DOE provides a categorization of functional areas, which CBC staff aggregated for this presentation. Detailed crosswalks between the DOE and CBC categories are available upon request. Source: CBC staff analysis of City of New York, Department of Education, 2016-2017 Final Class Size Report (February 15, 2017), http://infohub.nyced.org/docs/default-source/default-document-library/february2017_avg_classsize_school.xlsx?sfvrsn=258ae627_2, and School-Based Expenditure Report Data for Fiscal Year 2016-2017, https://www.nycenet.edu/offices/d_chanc_oper/budget/exp01/y2016_2017/guide.asp.
- This calculation is based on the total number of elementary school teachers (enrollment/pupil teacher ratio) compared to the number of classroom teachers (with ICT classes counting as two teachers). There is an average of 1.24 teachers per class in elementary schools. While CBC cannot calculate average teacher salary by school level, the average teacher salary was $84,108 for the 75,638 general education and special education teachers active on June 30, 2017. Source: CBC staff analysis of City of New York Office of Payroll Administration, Open Data, “Citywide Payroll Data (Fiscal Year)” (accessed October 3, 2017).
- The average number of students per class in middle and high schools, where students are in multiple classes of different sizes over the day, is based on the sum of students in all classes (in other words, a student in 6 classes counts as 6 students) divided by the sum of all classes (those 6 classes in the previous example count separately). Classification of schools as elementary, middle, or high school is from the DOE School-Based Expenditure Report. Source: CBC staff analysis of City of New York, Department of Education, 2016-2017 Final Class Size Report (February 15, 2017), http://infohub.nyced.org/docs/default-source/default-document-library/february2017_avg_classsize_school.xlsx?sfvrsn=258ae627_2, and School-Based Expenditure Report Data for Fiscal Year 2016-2017, https://www.nycenet.edu/offices/d_chanc_oper/budget/exp01/y2016_2017/guide.asp.