Fringe Benefits Pushed New York Education Spending Higher in 2013
Public elementary and secondary education is a $55 billion enterprise in New York, and for decades the state has been one of the nation’s top spenders. New U.S. Census data for 2013 shows this trend continues. Total spending on public education averaged $19,818 per student in New York, 85 percent higher than the national average of $10,700, exceeding all other states and the District of Columbia.1 Even neighboring states of Connecticut and New Jersey spent far lower amounts - $16,631 and $17,572 per student, respectively.
The following analysis and accompanying map show high levels of school spending largely reflected the relatively high cost of employee compensation. In particular the cost of employee retirement plans and other fringe benefits far exceeded national norms and continued to grow faster than all other educational spending. While spending varied significantly among New York’s 681 school districts, all districts exceeded the national average in 2013.
Salaries Much Higher Than National Norms, Fringe Benefits Even Higher
On average New York schools allocated 22 percent of their 2013 budgets to instructional staff fringe benefits. This compared to a national average of 15 percent. In dollars terms, instructional staff fringe benefits added up to $4,412 per student for the average New York school district in 2013, nearly triple the national average of $1,609. U.S. Census data on instructional expenses includes regular, special, and vocational programs offered during both the regular school year and summer school.
Teacher salaries and wages were also much higher than national norms but to a lesser degree than fringe benefits. New York schools spent an average of $8,359 per student on instructional salaries and wages, nearly double the national average of $4,305. In comparison school budgets included $5,646 per student for support services, such as administration, pupil transportation, and social work, 50 percent more than the national average of $3,762. (See Figure 1.)

In the last decade, fringe benefits have driven high overall growth in public elementary and secondary spending. In total, spending per student increased an average of 5.0 percent each year, well above 2.6 percent average annual growth in the cost of living. While teacher salaries and wages grew at an average annual rate of 3.4 percent from 2003 to 2013, instructional employee benefits increased 9.4 percent annually. This growth pushed teacher fringe benefits from 15 percent of school budgets in 2003 to 22 percent in 2013. (See Table 1.) While school districts set their staffing levels, state laws make controlling employee benefit costs more difficult. School districts negotiate health insurance benefits for active employees through collective bargaining, but retirement benefits for teachers and other school staff are set by the State Legislature. In addition, outside of New York City retiree health insurance benefits cannot be diminished below the level provided to active workers.
In more recent years, high growth in fringe benefits has led to cuts in other areas of school budgets, as districts have contended with the impacts of the recession and the implementation of a property tax cap in 2012. For example, from 2012 to 2013 non-compensation spending for instruction, including classroom supplies and materials, decreased 5.0 percent from $1,037 to $985 per student. School spending on teacher salaries and wages was essentially held flat, growing only 0.6 percent in 2013. At the same time, fringe benefits for teachers rose 4.2 percent. (See Table 2.)


Variations in Spending Across NYS
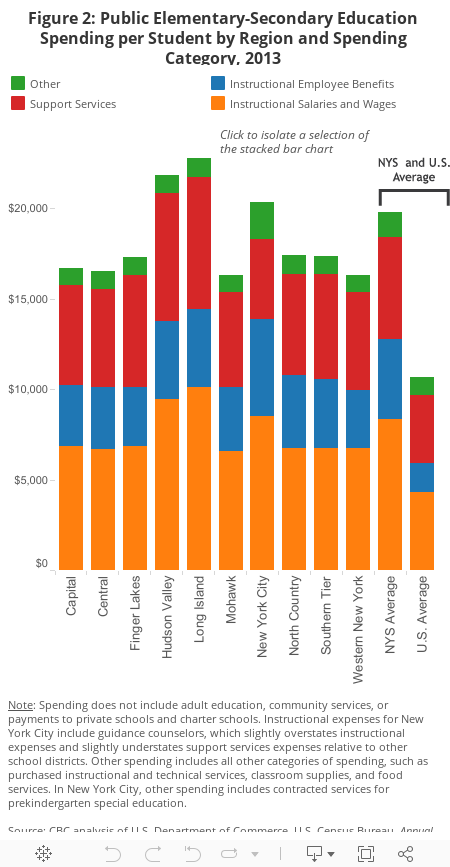
High teacher compensation costs are evident across the state, although regional differences exist. Among the state’s 10 regions, spending was highest in Long Island, with an average of $22,810 per student. Of this total, $10,126 went to instructional salaries, 135 percent above the national average, and $4,296 went to instructional employee fringe benefit costs, 167 percent above the national average. Average overall spending per student in the Hudson Valley and New York City were close behind Long Island at $21,863 and $20,331, respectively. Notably, fringe benefit costs in New York City were the highest among the regions, averaging $5,342 per pupil, in part because most districts in the state require some contribution to health insurance premiums from employees, while New York City does not.2 The two lowest-spending regions were the Mohawk Valley and Western New York, spending $16,299 and $16,328 per student respectively. (See Figure 2.)
Of New York’s nine largest districts after New York City, public education expenses were highest in Rochester and Newburgh at $20,333 and $20,040 per student, respectively. (See Table 2.) Rochester spent the most on support services among the state’s largest districts ($8,217 per student), while Newburgh ranked the highest on instructional employee benefits ($4,607). Such spending commitments placed these two districts fifth and seventh highest among the nation’s 878 school districts with enrollment greater than 10,000.
Although the Western New York region ranked at the bottom for average spending per student, its largest school district, Buffalo, spent $18,773 per student. The district spent $4,136 per student on instructional employee benefits, 157 percent higher than the national average of $1,609. Similar to New York City, the district covers 100 percent of health insurance premium costs for active workers, although a modest contribution is required from retirees.3 Further driving high per-pupil costs, from 2003 to 2013 Buffalo’s student enrollment fell 25 percent.4 Compared to the eight next largest districts in New York, however, Buffalo allocated the lowest amount to teacher salaries and wages, $6,551 per student.
Among New York’s largest districts, the Rochester suburb of Greece spent the lowest total amount per student, $16,114, and the lowest amount on teacher fringe benefits, $2,962 per student.

In the aggregate New York spends generously on its public schools, particularly in regard to employee fringe benefits, yet some districts in the state spend significantly less than others. The allocation of school dollars among categories of spending such as teacher salaries and benefits and support services also vary significantly. To examine the differences in the level and composition of school spending in New York’s 681 districts in 2013, view CBC’s new interactive map.
Footnotes
- Throughout this analysis, “average” refers to mean spending. U.S. Department of Commerce, U.S. Census Bureau, Annual Survey of School System Finances, 2013, www.census.gov/govs/school/.
- Elizabeth Lynam and Selma Mustovic, "School Districts Should Achieve Substantial Savings by Following State Practices for Employee Health Insurance Premiums," Citizens Budget Commission Blog (February 2, 2011).
- In Buffalo, eligible retirees contribute a fixed dollar amount to health insurance premiums. The annual contributions ($475 for a single plan and $950 for a family plan) have not changed since the teachers’ contract expired on July 1, 2003. These contributions are less than 5 percent of the annual premium cost. Buffalo teachers must work for 15 years to be eligible for retiree health insurance. Buffalo City School District, Four-Year Financial Plan 2015-16 to 2018-19 (May 1, 2015), pp. 2-32 and 2-33, www.city-buffalo.com/files/1_2_1/Mayor/FourYearPlan-2016-2019/Board_Education_Four_Year_Plan.pdf.
- U.S. Department of Education, National Center for Education Statistics, Common Core of Data (CCD), "Local Education Agency (School District) Universe Survey," 2012-13, v.1a, http://nces.ed.gov/ccd/.