Hard Choices That Can Balance New York City's Budget
The Covid-19 pandemic and associated economic disruption have led to sudden and deep shortfalls in tax revenue, and have opened up multi-billion dollar budget gaps in New York City’s four-year financial plan. Mayor Bill de Blasio’s initial effort primarily used short-term strategies to balance the current and upcoming fiscal years by relying on federal aid, reserves, and modest spending cuts. The de Blasio Administration remains focused on securing additional federal aid to fill growing budget gaps and has called on the State to authorize long-term borrowing for operating expenses; this request is premature since borrowing should be used only as a last resort to balance the budget in extraordinary circumstances. The Citizens Budget Commission’s (CBC’s) Hard Choices Framework acknowledges that difficult decisions must be made to balance revenues and expenses, but stresses the need to minimize negative impacts, especially for those in need; maintain the City’s competitiveness; and not burden future generations. It is also important that budget-closing actions do not disproportionately burden disadvantaged communities.
Following this rubric, this policy brief demonstrates that by making the right hard choices—reducing spending closer to norms of past recessions, modestly shrinking the workforce through attrition, collaborating with labor to improve productivity and modify benefits, and instituting a relatively small and temporary tax increase—the City can balance the budget without resorting to long-term borrowing, widespread layoffs, the most damaging service cuts, or counterproductive tax increases. If authorized, additional federal aid could provide budget relief, improving future fiscal prospects and providing flexibility in transition to a more efficient government that better serves New Yorkers’ needs. Conversely, future fiscal reality may prove worse than current projections, requiring additional hard choices; if needed, additional spending constraint and workforce shrinkage are possible and would align with prior City experience.
Summary of Hard Choices Framework
The Hard Choices Framework identifies a range of options available to balance revenues and expenditures. State and local leaders should choose among them based on their impacts, with the aim of minimizing harm, particularly to New Yorkers most in need and maximizing benefit for the greatest number of New Yorkers. Two other implications should be given strong weight in these decisions. First is the impact on the long-run competitiveness of the jurisdiction as a place to live and conduct and grow a business. When the pandemic has passed, to the extent possible, actions taken should have had minimal impact on the factors that make New York a desirable and economically competitive location. Second is the impact on future generations of New Yorkers. Actions should preserve “intergenerational equity;” future generations should not be obliged, usually through long-term borrowing, to pay for services for today’s residents. Moreover, the debt service for such borrowing constrains the resources available in the future for services and makes future budget decisions harder. Wise public officials will give careful consideration to the implications of their decisions for their heirs.
Projected Budget Gaps Facing New York City
The Fiscal Year 2021 Executive Budget, released by the de Blasio Administration on April 16, 2020, was balanced for fiscal years 2020 and 2021, as required by law. The budget gaps in fiscal years 2022, 2023, and 2024 were projected to be $5.0 billion, $4.5 billion, and $4.9 billion, respectively.
Since the Executive Budget’s release, certain risks have been identified and increase the fiscal year 2021 to 2024 gaps by $1.6 to $1.8 billion annually. (See Table 1.) Including estimates for these risks increases the budget gaps to $1.6 billion in fiscal year 2021, $6.9 billion in fiscal year 2022, $6.1 billion in fiscal year 2023, and $5.8 billion in fiscal year 2024. There is risk that these gaps could grow more, especially if tax revenue forecasts prove optimistic or State aid cuts are deeper.
City Revenue Forecast Risk
On May 26, 2020 the de Blasio Administration sent the annual revenue letter to the New York City Council. The letter identified $1.5 billion in reductions to the fiscal year 2021 tax revenue forecast, due mostly to lower projections for sales, hotel, and real estate transfer taxes, and $134 million in reductions to non-tax City revenues, mainly from fines and forfeitures.1 Fiscal year 2021 tax revenues are now expected to be $6.9 billion, or 11 percent, less than the Preliminary Budget forecast published in January.
The City has not yet updated the outyear revenue forecast, but the substantial fiscal year 2021 decrease is expected to carry through to future years’ forecasts. CBC estimates the associated risk by assuming that tax revenues will reach the Executive Budget forecast for fiscal year 2024, but from a lower fiscal year 2021 base; this would reduce the fiscal year 2022 forecast by $708 million and the fiscal year 2023 forecast by $232 million.2 Forecasts released by the City’s fiscal monitors project similar shortfalls; the Office of the New York City Comptroller and the Independent Budget Office forecast that fiscal year 2022 tax revenues would be $804 million and $754 million below the City’s Executive Budget, respectively.3
Each forecast is based on a set of economic assumptions, partly associated with trajectory of mitigating the pandemic and “reopening” the economy. Given the great uncertainty, there is risk that tax revenues could rebound more slowly in fiscal years 2022 to 2024.

State Education Aid Risk
The City’s financial plan assumes higher state education aid in fiscal years 2022 to 2024 than the State is reporting in its Enacted Budget Financial Plan. The City adjusted its fiscal year 2021 state aid projection to reflect a $360 million shortfall against its prior expectations; however, the City did not adjust the revenue estimate for fiscal years 2022 to 2024 to incorporate the reduction in fiscal year 2021 and to lower outyear levels.4 Assuming the State distributes aid to districts in the same proportion as fiscal year 2021 (rather than better targeting funding to high-need districts as CBC recommends), State education aid could be $1.1 billion less than the City’s projection in fiscal year 2022, $1.3 billion less in fiscal year 2023, and $916 million less in fiscal year 2024. Should the State allocate the funds like this, City leaders would need to choose whether to reduce funding to the Department of Education or use City funds to compensate, as has been done in recent years including fiscal year 2021.
Greater Risks Remain
Despite best efforts to quantify risks to the City’s budget, substantial downside risks remain. If the budget gaps are greater than expected at this time, the City would need to make additional hard choices, including deeper expenditure and headcount reductions. There are four significant risks.
First, the Enacted State Budget Report released on April 25, 2020 included at least $8.0 billion in cuts to local aid that have yet to be specified. The City receives 40 percent of all State school aid and more than $14 billion in total State aid annually, and could experience significant cuts.[5] CBC has presented a series of actions that the State could take to limit local aid cuts to $800 million.[6] In the absence of a plan detailing cuts from the Governor, additional State aid risk is not quantified for the purpose of this analysis, but any future cuts could put a major strain on the City’s ability to maintain a balanced budget.
Second, budgeted contributions for the City’s five pension funds are actuarially determined assuming a 7 percent investment return each fiscal year. If the returns fall short, the City is required to make up the difference between the actual and assumed rate of return.[7] The difference is split into six annual installments which are then each amortized over 15 years, with a one-year lag. For example, if the City pension funds were to suffer a 10 percent decline as recorded on June 30, 2020, the City would need to increase its contribution by $259 million in fiscal year 2022, $518 million in fiscal year 2023, and $777 million in fiscal year 2024.[8] During the 2008 recession, the funds suffered an 18 percent loss in fiscal year 2009.[9]
Third, the City’s more recent tax revenue forecast could prove optimistic, depending on the pace and trajectory of the recovery. While prior experiences provide some sense of the potential recovery, this crisis is different—the economic impact was deeper and more immediate, triggered by pandemic response rather than economic forces, and is dependent partly on the trajectory of economic reopening. As reopening of the economy takes place, more data will become available to help assess the revenue forecast risk since there is a lag to release of key economic data.
Fourth, the City historically has underestimated certain spending items, such as uniformed overtime, homeless services, special education services, and charter school reimbursements. The City’s fiscal monitors have highlighted these in recent reports.[10] To the extent the City does not limit spending to budgeted levels, expenditures may be higher than planned.
CBC Recommendations for Closing the Gaps
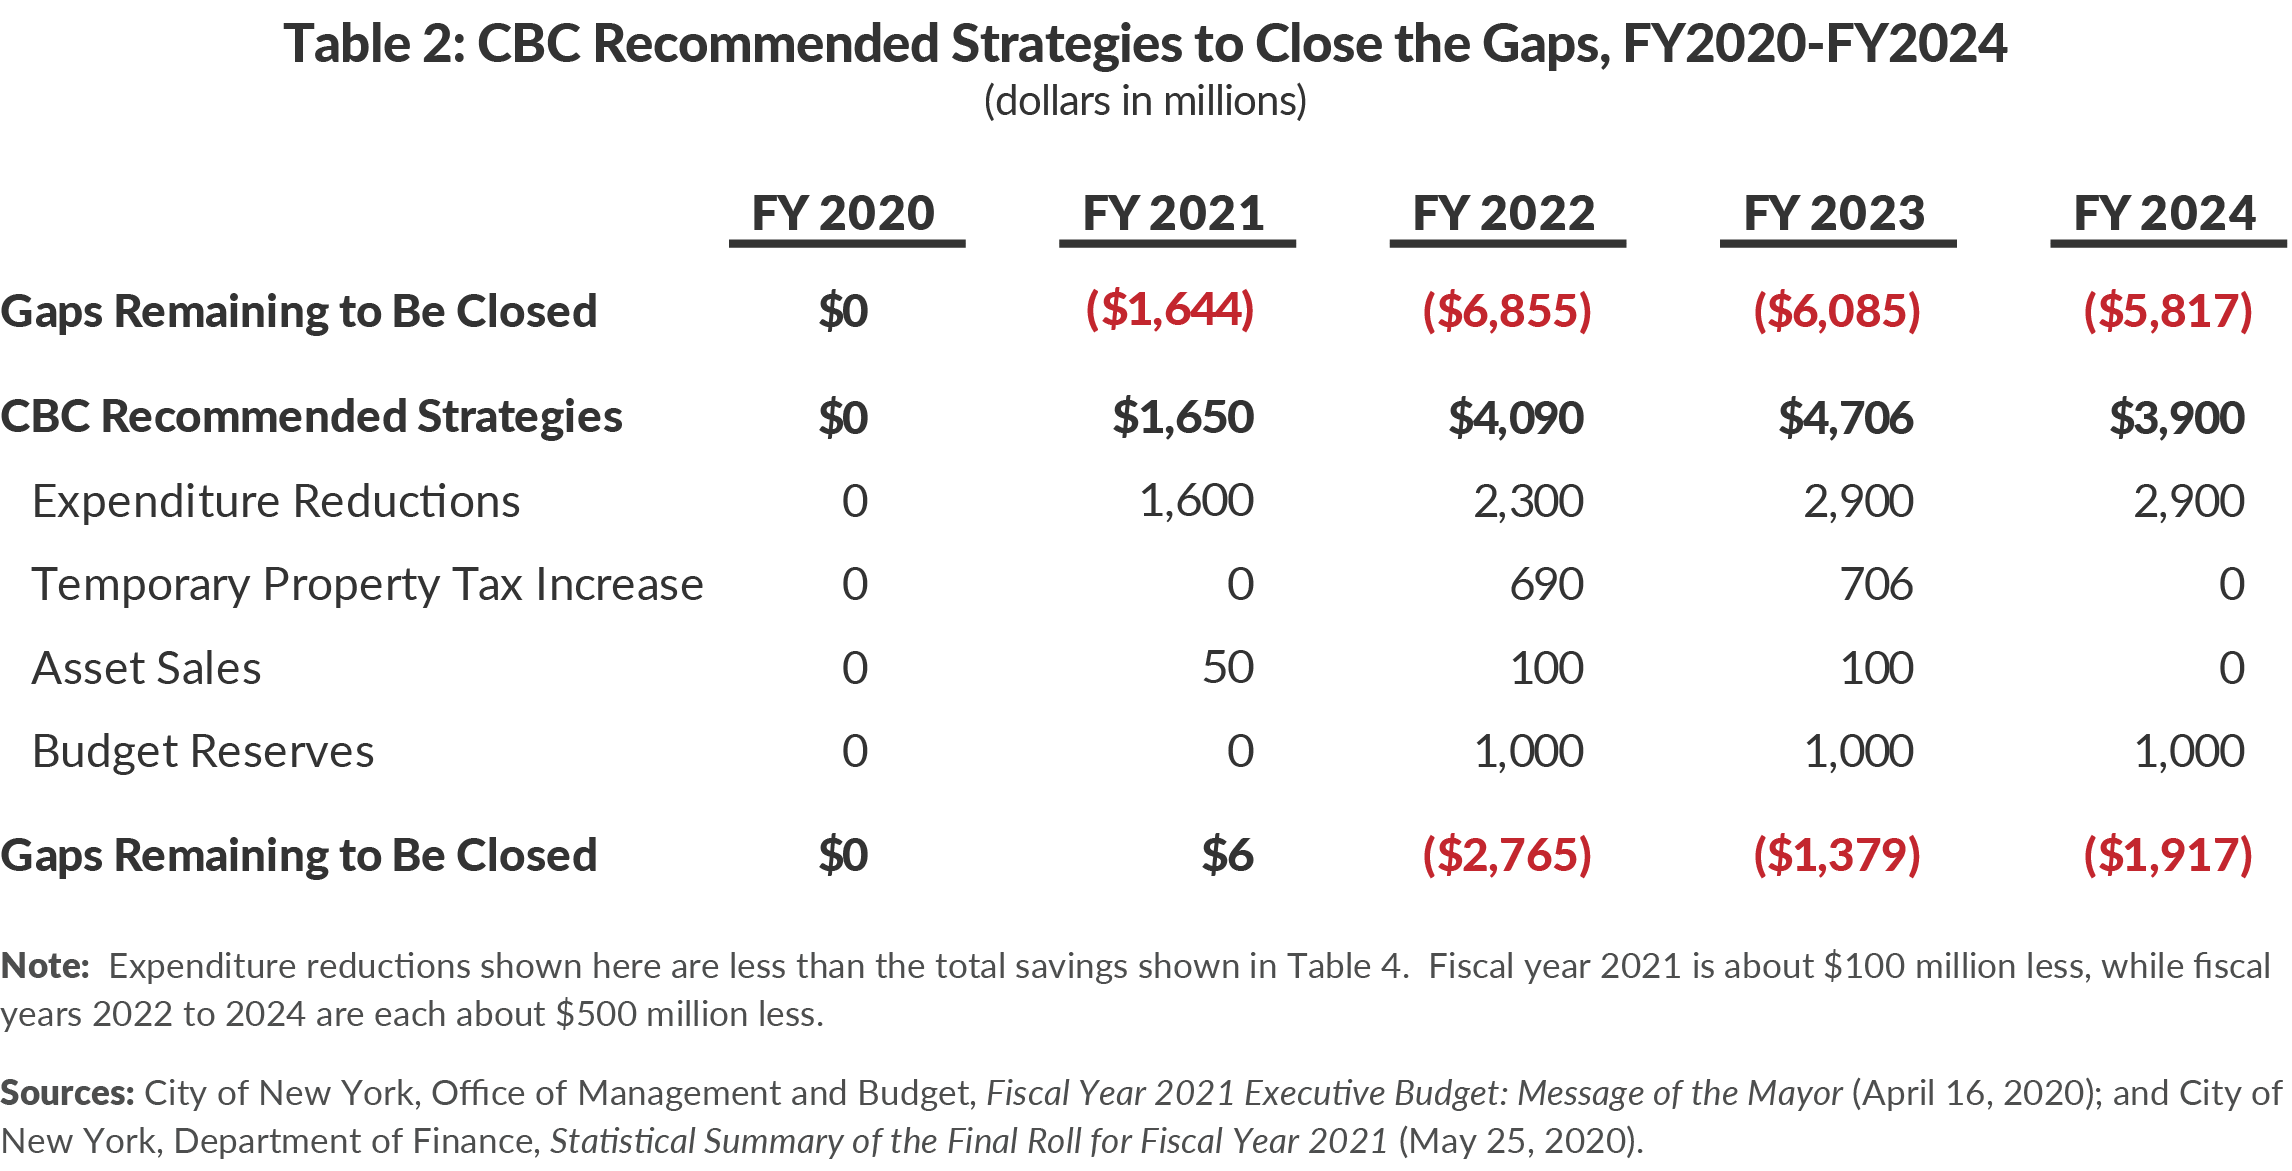
Following the Hard Choices Framework, CBC recommends a set of actions to close or substantially reduce the City’s projected budget gaps while mitigating negative impacts on current and future New Yorkers, and maintaining the City’s competitiveness. (See Table 2.) These are hard choices with difficult consequences, but provide almost $1.7 billion in fiscal year 2021, resulting in a $6 million surplus. The strategies save $4.1 billion, $4.7 billion, and $3.9 billion in fiscal years 2022 to 2024, respectively. As a result, gaps, before new federal aid or any long-term borrowing, can be eliminated for next year and are reduced to $2.8 billion in fiscal year 2022, $1.4 billion in fiscal year 2023, and $1.9 billion in fiscal year 2024.
Expenditure Reductions
CBC recommends expenditure reductions equal to $1.6 billion in fiscal year 2021, $2.3 billion in fiscal year 2022, $2.9 billion in fiscal year 2023, and $2.9 billion in fiscal year 2024. Multiple strategies and approaches can reduce City expenditures.
Achieving these savings requires a laser focus on prioritizing efficient delivery of the most critical services. This will require improving productivity, often working with labor to change work rules, job titles, and other arrangements; reducing the workforce by roughly 9,000 positions, which could be done through attrition; likely reducing some services; and requiring some fringe benefit cost-sharing with employees and retirees. Efficiencies are preferable; they increase effectiveness and reduce unit costs while maintaining service levels and quality. Working cooperatively with labor can minimize the possible need for layoffs and greater service reductions.
Expenditure reductions of nearly $3 billion annually, while challenging, are reasonable when compared to past recessions. As a share of projected City-funded expenditures, these cuts are 2.3 percent, 3.1 percent, 3.8 percent, and 3.8 percent in fiscal years 2021 to 2024, respectively. Including spending cuts incorporated by the de Blasio Administration in the Executive Budget, spending reductions would be 4.4 percent in fiscal year 2021, 4.2 percent in fiscal year 2022, and 5.0 percent in fiscal year 2023, and 4.9 percent in fiscal year 2024 against planned expenditure growth. If budget gaps prove greater than currently expected, deeper spending cuts would be needed, but still would be in line with prior recessions. (See Table 3.)
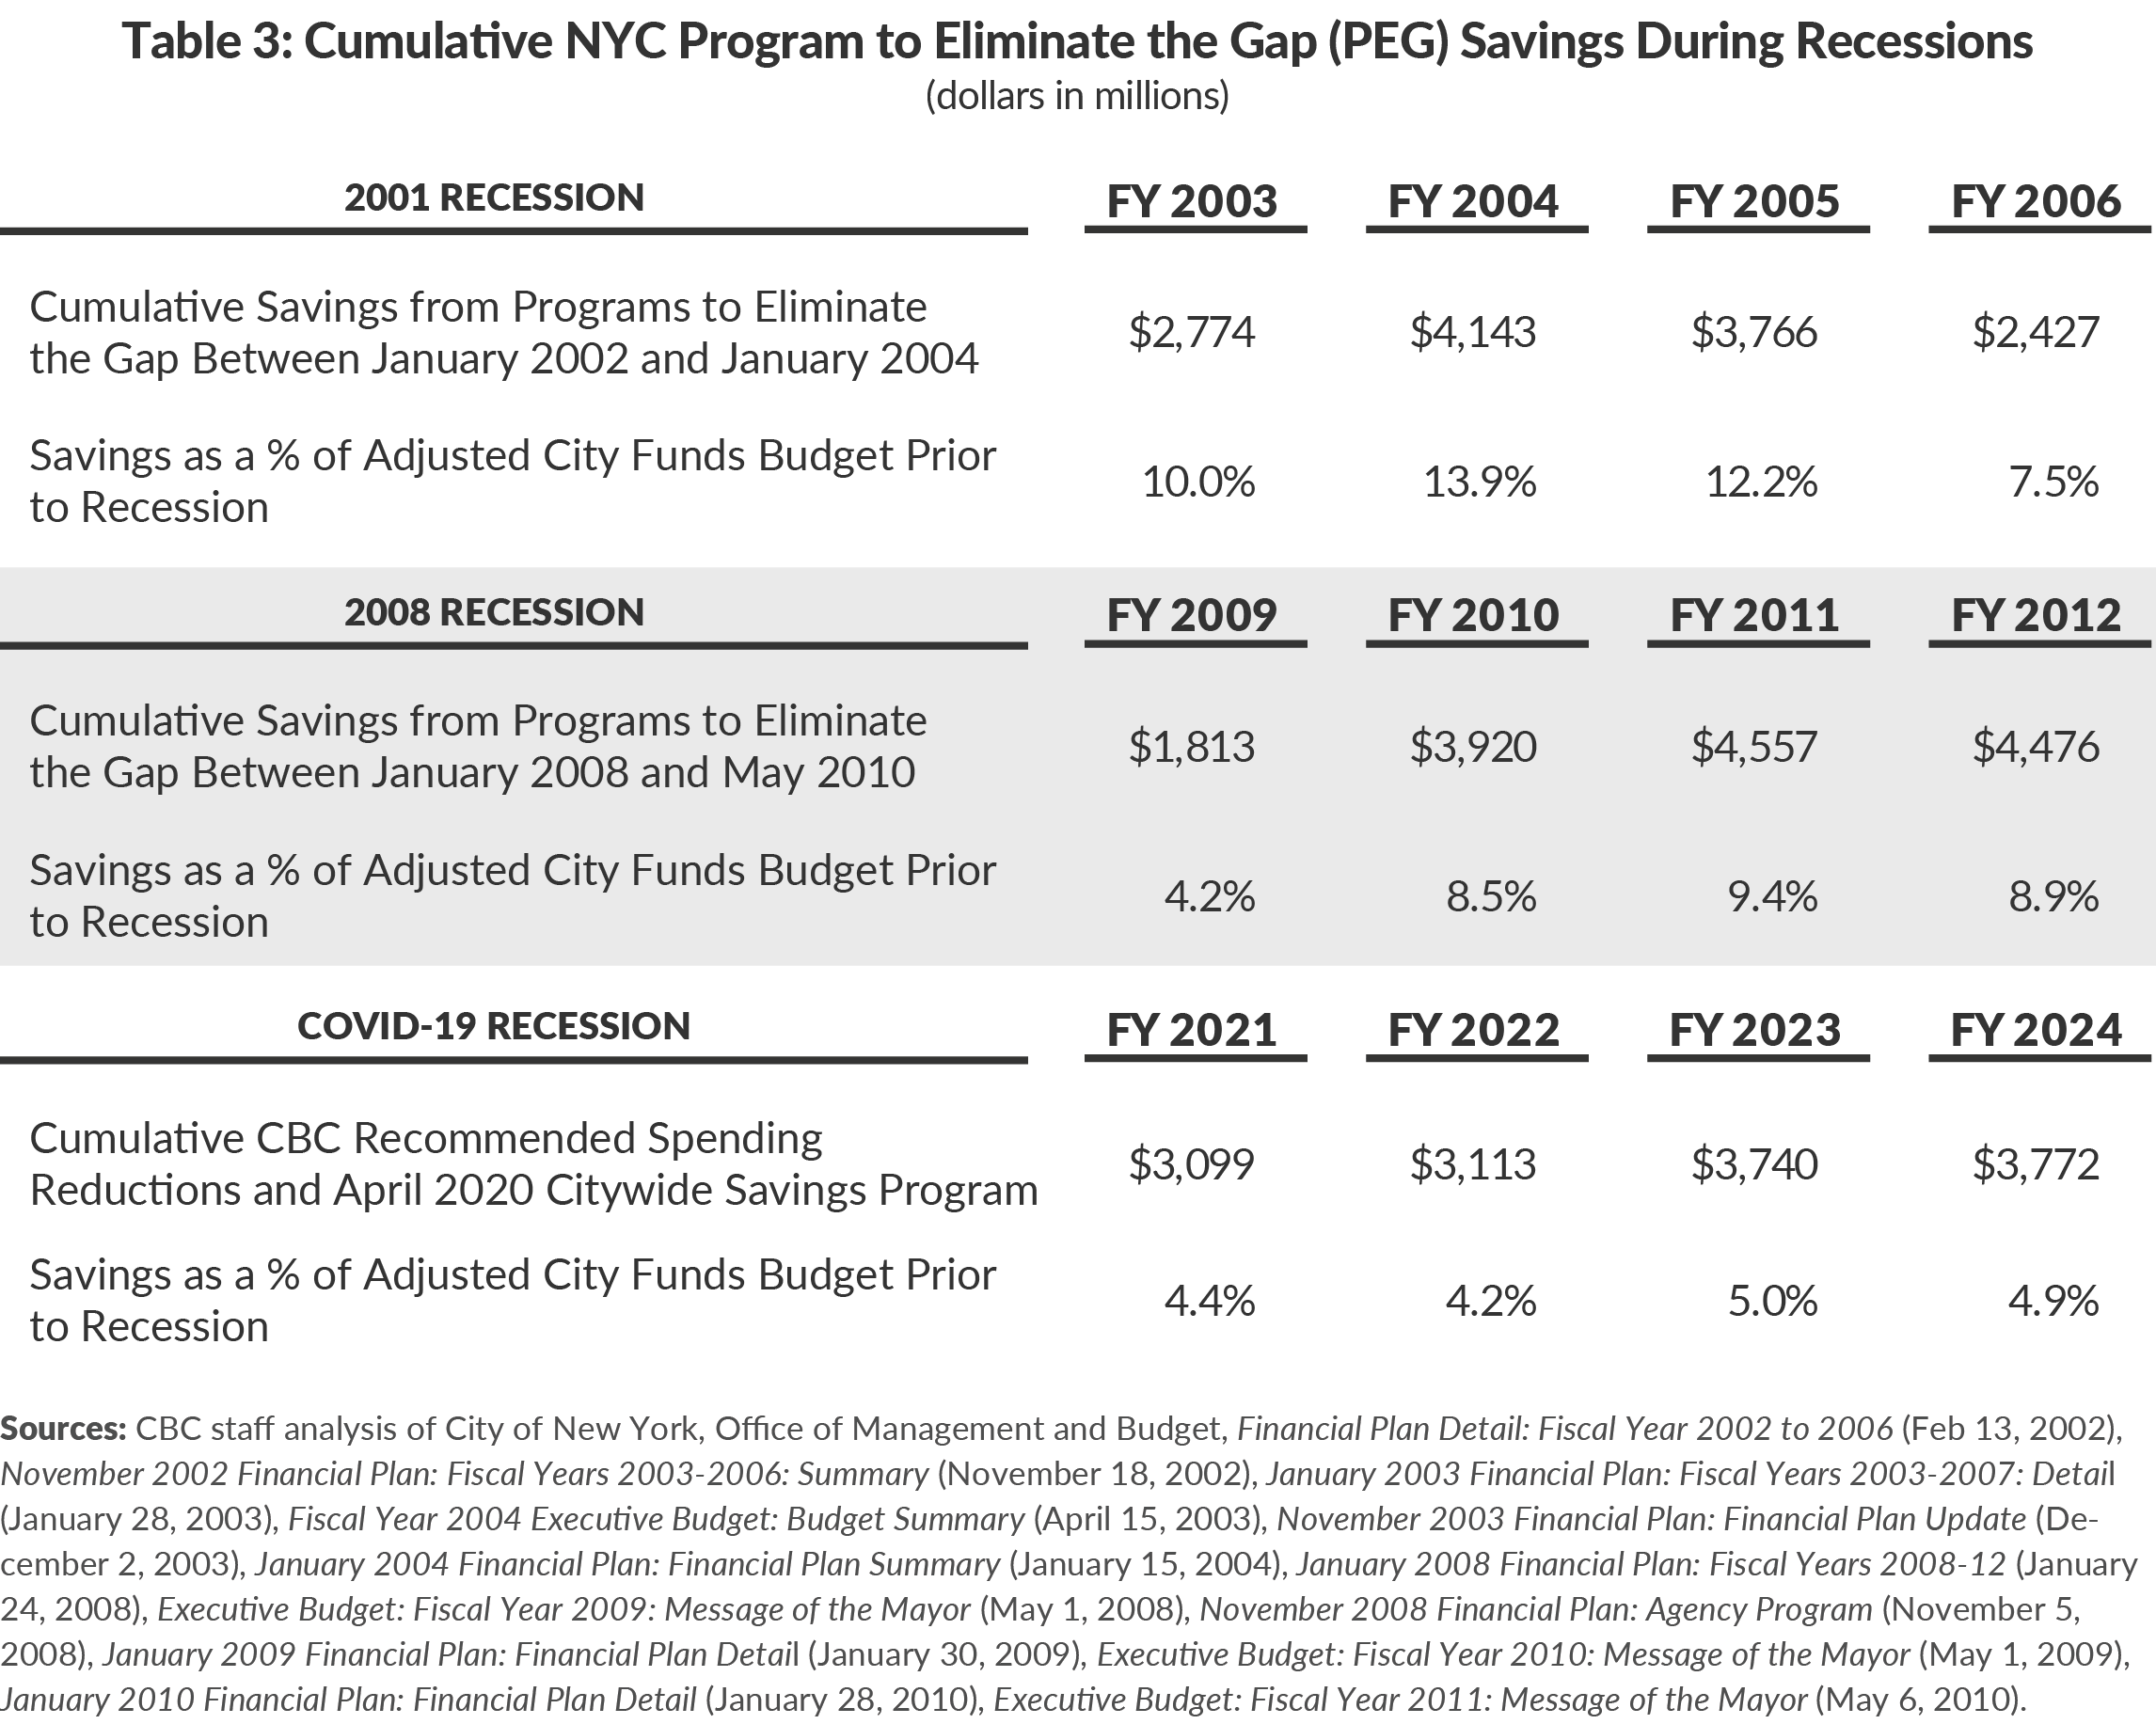
Expenditure reductions in prior recessions exceeded these levels, in relative and sometimes absolute terms. (See Table 3.) Six rounds of the Program to Eliminate the Gap (PEGs) implemented between January 2002 and January 2004 reduced annual spending between 8 percent and 14 percent of the City-funded budget prior to the recession. For example, $2.8 billion in agency savings were identified for fiscal year 2003, which is 10 percent of the $27.7 billion fiscal year 2003 adjusted City-funds budget, as projected in January 2002 prior to the start of the recession. Seven rounds of PEGs between January 2008 and May 2010 reduced the fiscal year 2009 to 2012 budgets between 4 percent and 9 percent.
Headcount Reductions
Spending reductions of this magnitude will require reductions in the number of City workers (“headcount”), which reached a record high level. (See Figure 1.) Headcount previously peaked at 304,922 and 311,018, at the end of fiscal years 2002 and 2008, respectively. At the end of fiscal year 2019, headcount was 326,739, an increase of 15,721 above the prior peak. After accounting for the roughly 6,000 staff associated with new universal pre-K programs, the City could reduce headcount by 9,000 and still remain above the fiscal year 2008 peak. In fact, at 311,739, headcount would remain 18,189 above the fiscal year 2012 trough.
Three areas should be targeted for headcount reduction. First, civilian headcount reductions of 7,326 over the course of fiscal year 2021 through 2022 save $364 million in fiscal year 2021 (assuming 50 percent are achieved in the first year) and about $750 million per year thereafter.11 Cutting headcount by this magnitude likely result in a mix of increased efficiency and service reductions.
Second, the number of uniformed police officers could be reduced to prior peak headcount. City leaders increased the police uniformed ranks by nearly 1,400 between fiscal years 2015 and 2016. Reducing the force by 1,174 over two years through attrition and adjusting the size of classes of police recruits would save $57 million in fiscal year 2021 and about $100 million annually thereafter.12 This would result in a force of 35,287 officers, slightly below the peak at the beginning of the Great Recession of 35,641 but well above the 33,777 trough after that recession.
Third, DOE civilian headcount increased by 1,579 from 23,704 in fiscal year 2014 to 25,283 in fiscal year 2019. A reduction of 500 positions by fiscal year 2022 would save about $60 million annually when fully implemented.

Cumulatively, these reductions should be achievable over 2 years by attrition, without layoffs, while also permitting the City to fill roughly two-thirds of the vacancies that occur if, as in past recessions, attrition rates do not decline significantly. Annual separations average 7 percent of the workforce (over 22,000 positions).13 Even if separations declined, this target could be met while refilling most positions.
If budget gaps become larger than currently projected, additional headcount reduction through attrition would be possible and still leave the workforce larger than in prior recessions. Filling one in three vacancies over the next two years would reduce headcount to about 314,000 by the end of fiscal year 2021 and 301,600 by the end of fiscal year 2022, while generating recurring annual savings of $1.7 billion.14 Headcount would remain about 8,000 positions above the fiscal year 2012 trough of 293,550.
Improved Efficiency
Past CBC research has identified several areas in which the City could improve the efficiency of city services. Welfare fund consolidation could generate efficiency savings on both administrative and benefit costs; CBC has estimated savings of $164 million. Similarly, improvements in productivity at the Department of Sanitation that require collective bargaining could save nearly $100 million per year. The City should resume study of and implement a volume-based fee for refuse; such fees have been shown to reduce waste generation by households as the cost of disposing of one’s waste becomes more immediately felt. Implementation is assumed in fiscal year 2022, with half of the savings realized in the first year; annual savings could reach $57 million.
Centralizing procurement at the Department of Citywide Administrative Services could save about $80 million, assuming a 5 percent reduction in contract costs. Procurement savings can also be attained through strategic efforts to increase bidders and reduce costs on the City’s largest contracts.
During the 2017-2018 school year, the Absent Teacher Reserve (ATR) cost the City $136 million. The City has already implemented programs to reduce the cost of the ATR by $80 million. CBC has called for time limits on or elimination of the ATR, changes that would need to be negotiated with the United Federation of Teachers. Potential savings are about $60 million per year.
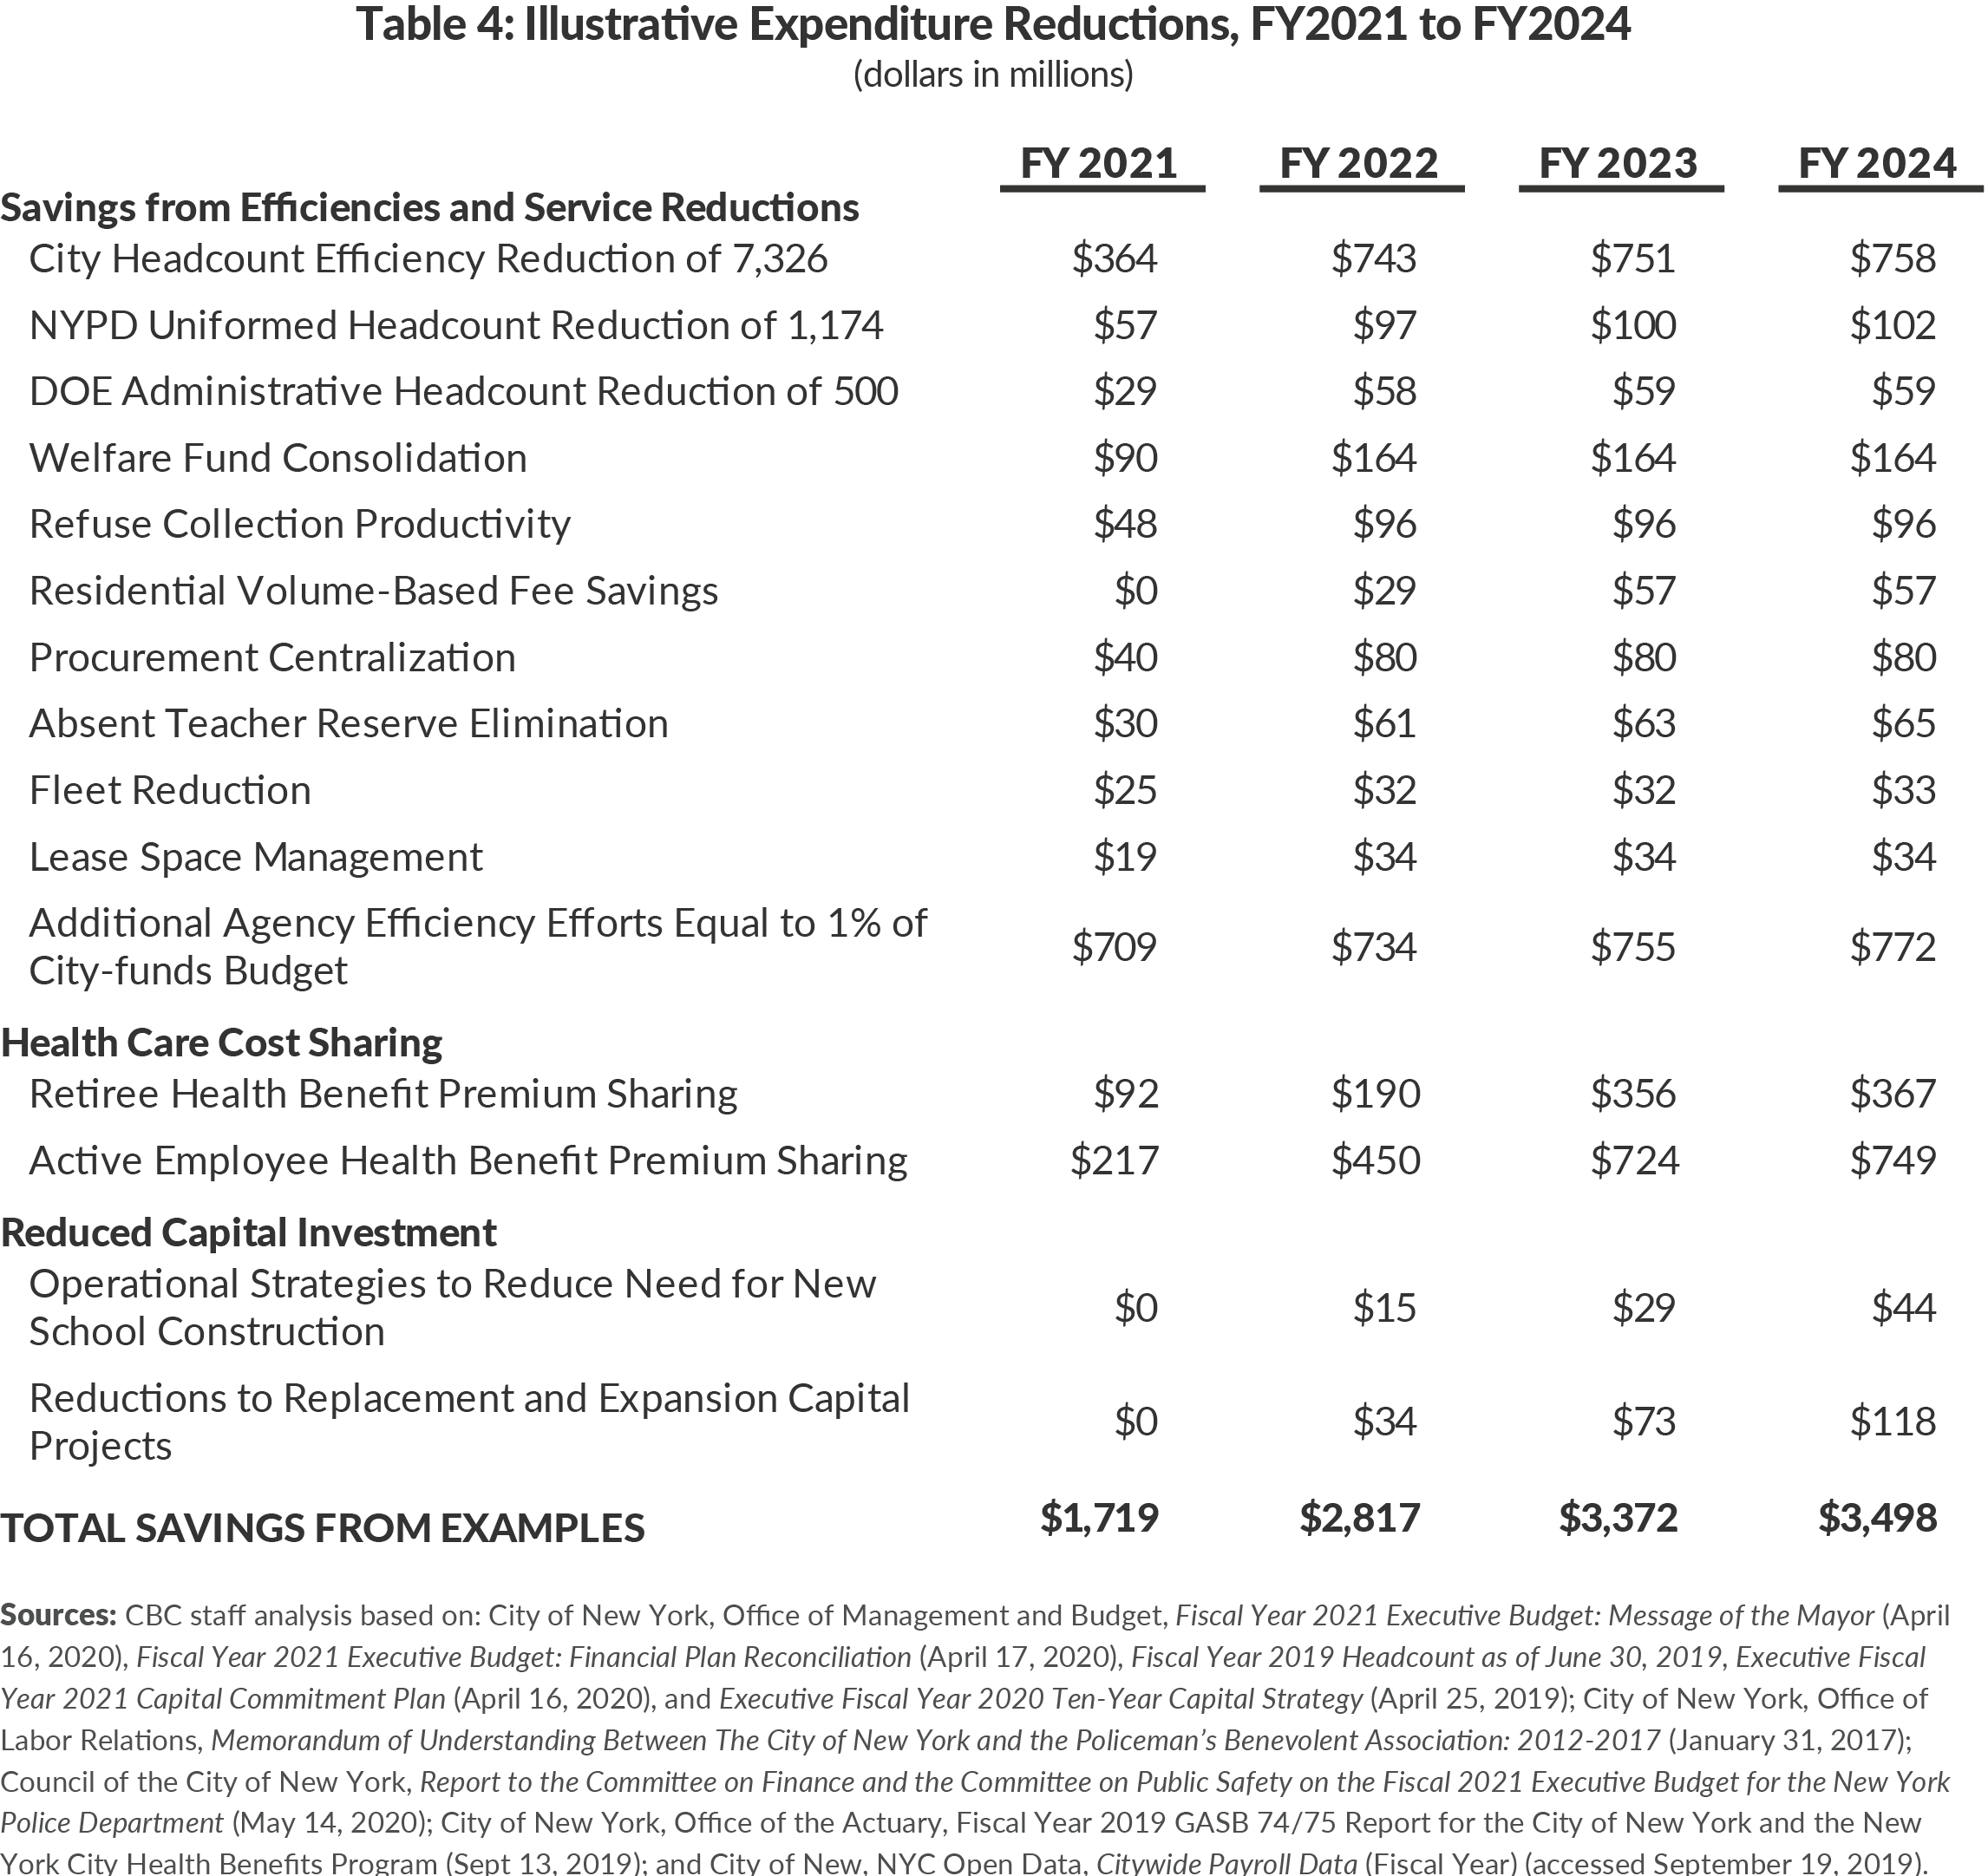
The City has implemented initiatives to reduce lease and fleet costs; however, savings to date have been limited. Total savings of $40 million on each should be attainable; Table 4 presents savings net of initiatives already in place.
City-funded spending has grown at an annual rate of 4.7 percent, well above inflation, while efforts to reduce spending have focused on debt service savings, re-estimates, and funding shifts. City agencies should be able to find savings equal to 1 percent of their City-funded budgets, in addition to the roughly 3 percent identified above, for savings of about $700 million per year.
While some of these reductions can be incorporated into increased efficiencies, spending reduction of this magnitude may also affect services. While there is room for efficiency gains in City operations and savings can be taken from back-office functions, some services would need to be reduced, but critical services could be maintained. All City programs should be evaluated for effectiveness; those providing limited benefits should be retooled or eliminated. Additionally, during the crisis, with many City employees working from home, some routine functions and processes were suspended or altered; this situation should provide insight into which processes and job functions are essential for critical service delivery.
Health Insurance Reform
Unlike other private and public sector employees, the overwhelming majority of City employees and retirees opt for coverage under plans that do not require any contribution toward the cost of insurance. Implementing a health insurance premium-sharing arrangement would provide significant recurring savings while ensuring the City continues to provide attractive benefits.
New York City employees and retirees with over 10 years of City service are eligible for health insurance with no cost-sharing for the premium, a generous benefit that exceeds that received by New York State workers or the private sector average. Approaches to premium cost-sharing that graduate costs based on salaries, years of service, and type of insurance can be used to minimize the impact on lower wage workers. While the City can make some changes in city law, most changes would need to be negotiated with the Municipal Labor Committee. CBC modeled three potential premium-sharing arrangements.
If retirees contributed 16 percent of the premium for pre-Medicare insurance and 25 percent of the premium for Medicare Part B and Supplemental Medicare coverage, the City would reduce annual costs by about $350 million when fully implemented (assuming a gradual phase-in over fiscal year 2021 through 2023).15 At full implementation, pre-Medicare retirees would pay about $2,500 per year, while Medicare beneficiaries would pay about $800.16
Similarly, if employees with salaries less than $65,000 contributed 6 percent of premiums for single coverage and 8 percent for family coverage, and those with salaries greater than $65,000 contributed 14 percent of premiums for single coverage and 16 percent for family coverage (at or below contribution rates for New York State employees), the City would save more than $700 million annually when fully implemented.17 Annual employee costs would be $575 for single coverage and $2000 for family coverage for employee’s making less than $65,000; employees making over $65,000 would contribute $1,350 for single coverage and $4,000 for family coverage.
Delaying and Limiting Unnecessary Expansion Projects
The five-year capital plan could be reduced by $2.4 billion through operational strategies to reduce planned new school construction and by $4.3 billion by delaying and limiting expansion projects; together these cuts would be 10 percent of the current city-funded capital plan.18 They could generate debt service savings of $50 million in fiscal year 2022, $100 million in fiscal year 2023, and $150 million in fiscal year 2024.19
The savings from these itemized expenditure reductions are summarized in Table 4. Together, they provide savings of $1.7 billion in fiscal year 2021, $2.8 billion in fiscal year 2022, $3.4 billion in fiscal year 2023, and $3.5 billion in fiscal year 2024 – slightly more than the expenditure reduction target identified by CBC and summarized in Table 2. This is intended to provide some flexibility in implementing the initiatives.
Temporary Property Tax Increase
A temporary increase in the property tax rate in fiscal years 2022 and 2023 is also reasonable and justified as part of a package to close budget gaps. The Hard Choices Framework recognizes that temporary broad-based tax increases can be a viable option to balancing revenues and expenditures. Delaying the increase until fiscal year 2022 would allow time for the current fiscal stress on property owners to abate, in line with economic forecasts of return to employment growth. As a generally high-tax jurisdiction, the importance of attracting and retaining businesses and residents following the pandemic make it critical that the increase be temporary, only for the years it is needed to balance the budget. City leaders should not let the harmful anti-competitive potential of a tax increase be realized by allowing it to become permanent.
The recommended temporary increase is also much lower than in past recessions. The City implemented an 18.5 percent property tax rate increase in January 1, 2003 and a 7.5 percent property tax rate increase in January 1, 2009.20 A 2 percent increase in the average rate, from 12.283 percent to 12.529 percent, implemented effective July 1, 2021 through June 30, 2023 would generate $690 million in fiscal year 2022 and $706 million in fiscal year 2023. The average homeowner would pay $143 more in fiscal year 2022.21
Assets Sales
Asset sales, such as sales of property, can provide revenue to help weather the abrupt decline in tax revenue, as they have in prior recessions. Specific assets to be sold are not identified here; the City should assess the possibility of selling parking lots and underutilized buildings with the aim of generating $50 million in fiscal years 2021 and $100 million each in fiscal years 2022 and 2023.
Reserves
While the City does not have a Rainy Day Fund, contingency reserve funds of $1.25 billion annually are included in the budget for fiscal years 2022 to 2024. The City is required to maintain a general reserve of at least $100 million. The current budgeted general reserve of $1 billion should be reduced to $250 million, releasing $750 million per year for gap closing. Additionally, the entire $250 million capital stabilization reserve should be released in fiscal years 2022 to 2024.
The City already plans to use $2.6 billion of the $4.7 billion in the Retiree Health Benefits Trust, leaving a balance of $2.1 billion. At this point, those funds are not needed for additional gap closing.
Impact of Illustrative Federal Aid
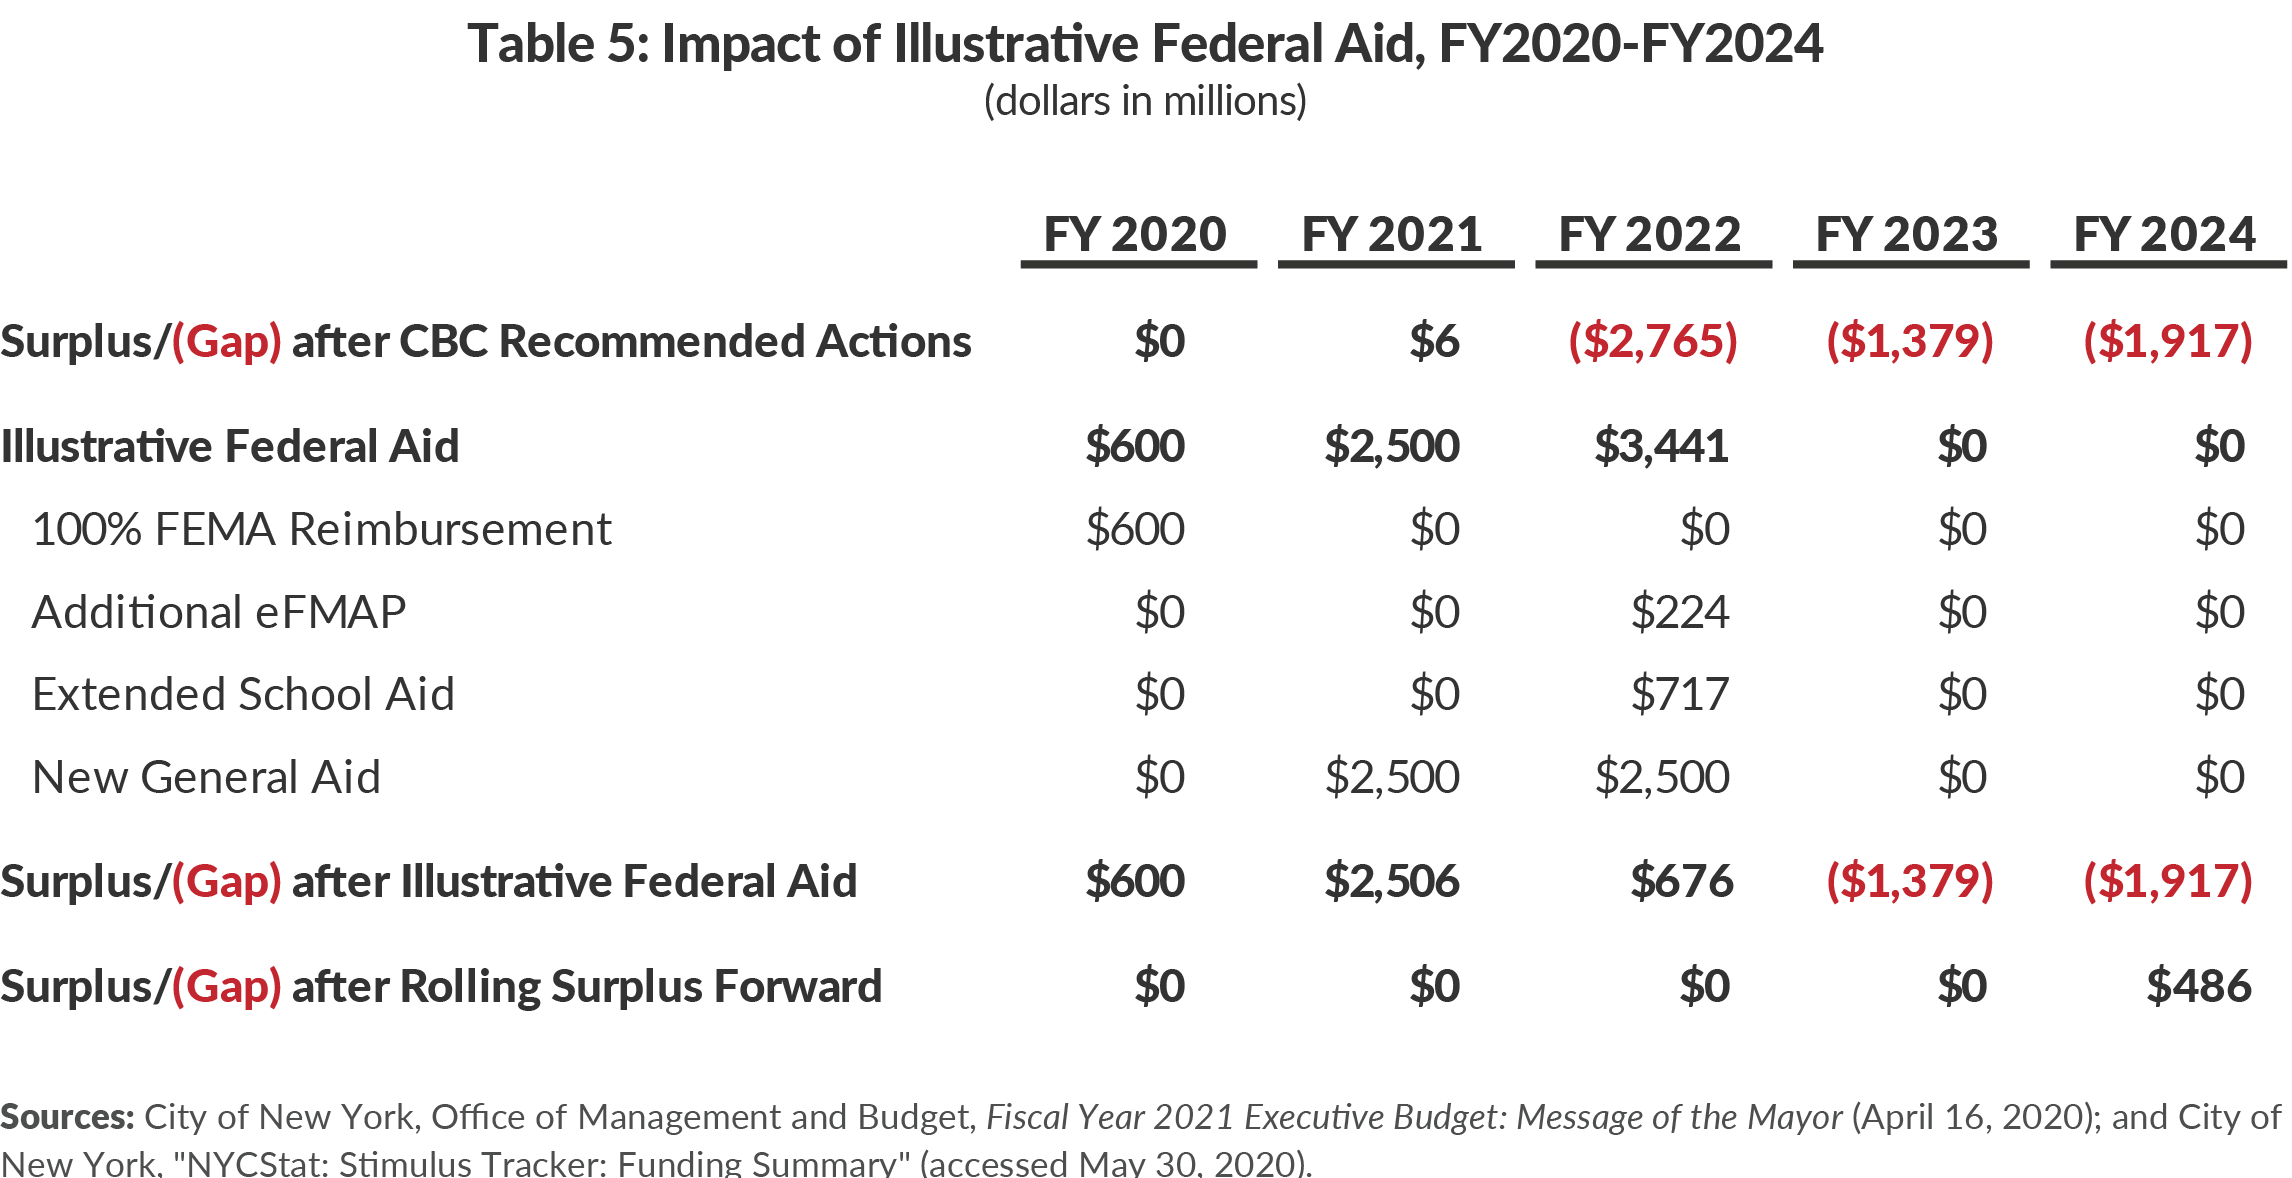
Additional federal aid is uncertain. The City should proceed apace to implement actions to close the upcoming and reduce future budget gaps. The CBC-recommended actions leave gaps of $2.8 billion in fiscal year 2022, $1.4 billion in fiscal year 2023, and $1.9 billion in fiscal year 2024. It is possible that additional federal aid could provide the resources needed to close most of those gaps. For example, if the City were to receive $6.5 billion over fiscal years 2020 through 2022, the gaps through fiscal year 2024 would be closed. (See Table 5.)
Potential federal aid could come in four streams. First, if the Federal Emergency Management Administration (FEMA) were to waive the 25 percent local share for disaster funding, which Governor Andrew Cuomo and President Donald Trump have discussed, the City would gain $600 million in already approved federal aid.22
Second, the City assumes the already enacted enhanced Federal Medical Assistance Percentage (eFMAP) increase of 6 percent will end on December 31, 2020. If this were to be extended to July 2021, the City could receive $224 million in fiscal year 2022 budget relief. Combined with the $1.0 billion in eFMAP already reflected in the Executive Budget, total eFMAP would be $1.2 billion. During the Great Recession, the City received $2.6 billion in eFMAP.23
Third, the City received $717 million in federal education aid through the State. The State may receive an additional $1.2 billion in federal education aid in state fiscal year 2022; in prior recessions education aid was provided over two years.24 If the State receives this aid and directs it to districts in accord with current patterns, the City could receive $717 million in fiscal year 2022. During the Great Recession, the City received a total of $2.7 billion in education aid.25
Fourth, the City is lobbying to receive general federal aid to assist with the recovery. For illustration, CBC shows the impact of the the City receiving an additional $5 billion in fiscal years 2021 and 2022.
The total $8.2 billion in federal funding—$6.5 billion in potential federal aid plus the $1.7 billion in eFMAP and education aid already reflected in the City budget—is a reasonable estimate. It is $1 billion less than the total federal funding following the Great Recession, excluding capital funding, which was $9.2 billion.26
Conclusion
New York City is addressing the most severe fiscal crisis in generations. Initial efforts to balance the budget have relied on federal aid, reserves, and relatively modest spending cuts, but long-term budget gaps remain and are likely to grow. The City’s strategy now is to seek additional federal aid and the authority to issue up to $7 billion in long-term debt to balance the budget. While significant federal budget relief would be welcome and some additional relief would be in line with what has happened in past recessions, a strategy that entails assertive but reasonable spending cuts, collaboration with labor, and a small but temporary property tax increase, would balance the budget and preserve critical services without mass layoffs or requiring future generations to pay for today’s expenses.
The current crisis is unprecedented, and the pace and timing of recovery is uncertain. The budget gaps being forecast are reasonable given the data available, but substantial downside risks remain. The set of choices recommended above may be insufficient if budget gaps are larger than currently expected. In that case, more aggressive spending and headcount reductions could be pursued, yet they still would likely be within the norms of the past.
Download Report
Hard Choices That Can Balance New York City's BudgetFootnotes
- City of New York, Office of Management and Budget, email to Citizens Budget Commission staff, Fiscal Year 2021 Revenue Letter to the City Council (May 26, 2020).
- CBC staff kept the Executive Budget forecast for fiscal year 202, which increases the projected growth in tax revenue between fiscal year 2021 and fiscal year 2024. Fifty-three percent of the growth was assumed to occur in fiscal year 2022, 32 percent in fiscal year 2023, and 15 percent in fiscal year 2024, in line with growth projected in the Executive Budget. See: City of New York, Office of Management and Budget, Fiscal Year 2021 Executive Budget: Revenue (April 16, 2020), https://www1.nyc.gov/assets/omb/downloads/pdf/exec20-rfpd.pdf, and Fiscal Year 2021 Revenue Letter (May 26, 2020).
- Office of the New York City Comptroller, Comments on New York City’s Fiscal Year 2021 Executive Budget (May 21, 2020), https://comptroller.nyc.gov/reports/comments-on-new-york-citys-fiscal-year-2021-executive-budget/; and New York City Independent Budget Office, Tumbling Tax Revenues, Shrinking Reserves, Growing Budget Gaps: New York City Faces Substantial Fiscal Challenges in the Weeks and Months Ahead (May 18, 2020), https://ibo.nyc.ny.us/iboreports/tumbling-tax-revenues-shrinking-reserves-growing-budget-gaps-new-york-city-faces-substantial-fiscal-challenges-in-the-weeks-and-months-ahead-may-2020.pdf.
- The state kept foundation and expense-based aids flat in fiscal year 2021 but used federal aid to cover some of the expense. The baseline for state aid going forward is fiscal year 2021 less the federal back-fill, increasing 4.6 percent, 3.6 percent, and 3.3 percent, over fiscal years 2022 to 2024, respectively. New York State Division of Budget, FY 2021 Enacted Budget Financial Plan (April 2020), https://www.budget.ny.gov/pubs/archive/fy21/enac/fy21-enacted-fp.pdf.
- New York State Division of Budget, FY 2021 Enacted Budget Financial Plan (April 2020), https://www.budget.ny.gov/pubs/archive/fy21/enac/fy21-enacted-fp.pdf; New York State, Financial Control Board, Fiscal Stress Created by COVID-19 (June 1, 2020), www.fcb.state.ny.us/pdf/FCBNY20200601_StaffReport.pdf; Office of the New York State Comptroller, Review of the Financial Plan of the City of New York (Report 1-2021, May 2020), https://www.osc.state.ny.us/sites/default/files/reports/documents/pdf/2020-05/rpt-1-2021.pdf; Office of the New York City Comptroller, Comments on New York City’s Fiscal Year 2021 Executive Budget (May 21, 2020), https://comptroller.nyc.gov/reports/comments-on-new-york-citys-fiscal-year-2021-executive-budget/; and New York City Independent Budget Office, Tumbling Tax Revenues, Shrinking Reserves, Growing Budget Gaps: New York City Faces Substantial Fiscal Challenges in the Weeks and Months Ahead (May 18, 2020), https://ibo.nyc.ny.us/iboreports/tumbling-tax-revenues-shrinking-reserves-growing-budget-gaps-new-york-city-faces-substantial-fiscal-challenges-in-the-weeks-and-months-ahead-may-2020.pdf.
- Dave Friedfel and Charles Brecher, New York State's Hard Choices: Next Steps to Address Fiscal Stress, Citizens Budget Commission (May 22, 2020), https://cbcny.org/research/new-york-states-hard-choices.
- Similarly, if the funds outperform the assumption, the excess is amortized on the same schedule. In each year, the total adjustment is a combination of the adjustments from multiple prior years. For more information, see: Robert Callahan, Another Covid-19 Cost? As the Stock Market Tumbles the City’s Pension Costs May Climb, New York City Independent Budget Office, (March 30, 2020), https://ibo.nyc.ny.us/iboreports/another-covid-19-cost-as-the-stock-market-tumbles-the-citys-pension-costs-may-climb-fb-march-2020.pdf.
- CBC calculation based on methodology used by New York City Independent Budget Office. See: Robert Callahan, Another Covid-19 Cost? As the Stock Market Tumbles the City’s Pension Costs May Climb, New York City Independent Budget Office, (March 30, 2020), https://ibo.nyc.ny.us/iboreports/another-covid-19-cost-as-the-stock-market-tumbles-the-citys-pension-costs-may-climb-fb-march-2020.pdf.
- Office of the New York City Comptroller, Comprehensive Annual Financial Report for the Fiscal Year Ended June 30, 2009 (October 30, 2009), https://comptroller.nyc.gov/wp-content/uploads/documents/cafr2009.pdf.
- See: New York State, Financial Control Board, Fiscal Stress Created by COVID-19 (June 1, 2020), www.fcb.state.ny.us/pdf/FCBNY20200601_StaffReport.pdf; Office of the New York State Comptroller, Review of the Financial Plan of the City of New York (Report 1-2021, May 2020), https://www.osc.state.ny.us/sites/default/files/reports/documents/pdf/2020-05/rpt-1-2021.pdf; Office of the New York City Comptroller, Comments on New York City’s Fiscal Year 2021 Executive Budget (May 21, 2020), https://comptroller.nyc.gov/reports/comments-on-new-york-citys-fiscal-year-2021-executive-budget/; and New York City Independent Budget Office, Tumbling Tax Revenues, Shrinking Reserves, Growing Budget Gaps: New York City Faces Substantial Fiscal Challenges in the Weeks and Months Ahead (May 18, 2020), https://ibo.nyc.ny.us/iboreports/tumbling-tax-revenues-shrinking-reserves-growing-budget-gaps-new-york-city-faces-substantial-fiscal-challenges-in-the-weeks-and-months-ahead-may-2020.pdf.
- Estimate based on average civilian salary of $65,000 at the start of fiscal year 2020, grown at 2 percent in fiscal years 2021 and 2022 and 1 percent per year thereafter, plus a fringe rate of 50 percent. City of New, NYC Open Data, Citywide Payroll Data (Fiscal Year) (accessed September 19, 2019), https://data.cityofnewyork.us/City-Government/Citywide-Payroll-Data-Fiscal-Year-/k397-673e.
- The City typically runs two Police Academy classes per year to train new recruits. These classes can be decreased in size or eliminated if fewer new police officers are needed to replace those who leave City service, thereby reducing the total size of the uniformed police force. Based on new officer salary schedule in the most recent contract, plus fringe benefit costs (decreasing from 91 percent of salary in the first year to 70 percent once the highest base pay is attained.) See: City of New York, Office of Labor Relations, Memorandum of Understanding Between The City of New York and the Policeman’s Benevolent Association: 2012-2017 (January 31, 2017), https://www1.nyc.gov/assets/olr/downloads/pdf/collectivebargaining/pba-nyc-moa-2012-2017.pdf; City of New York, Office of Management and Budget, Fiscal Year 2021 Executive Budget: Financial Plan Reconciliation (April 17, 2020), https://www1.nyc.gov/assets/omb/downloads/pdf/exec20-fprecon.pdf; and Council of the City of New York, Report to the Committee on Finance and the Committee on Public Safety on the Fiscal 2021 Executive Budget for the New York Police Department (May 14, 2020), https://council.nyc.gov/budget/wp-content/uploads/sites/54/2020/05/FY21-NYPD-Executive-Report-1.pdf.
- City of New York, Department of Citywide Administrative Services. New York City Government Workforce Profile Report (Fiscal Year 2017), https://www1.nyc.gov/assets/dcas/downloads/pdf/reports/workforce_profile_report_2017.pdf.
- This assumes a lower separation rate of 6 percent due to the recession. Total reduction would be 25,386, excluding the already recommended reduction of 9,000, an additional reduction of 16,386, assuming salary and fringe described in endnote 21.
- Savings estimates in a previous CBC report were inflated by 3.5 percent per year for pre-Medicare and 2.5 percent per year for Medicare. Savings are reduced by 50 percent in the first year. See: Thad Calabrese, Price of Promises Made: What New York City Should Do About Its $95 Billion OPEB Debt (Citizens Budget Commission, October 25, 2017), https://cbcny.org/research/price-promises-made.
- Fifty-three percent of pre-Medicare beneficiaries are retired police officers and firefighters, many of whom are employed post-retirement and may be eligible to take employer coverage if it is less costly. See: City of New York, Office of the Actuary, Fiscal Year 2019 GASB 74/75 Report for the City of New York and the New York City Health Benefits Program (Sept 13, 2019), https://www1.nyc.gov/assets/actuary/downloads/pdf/OPEB_GASB_7475_Report_FY2019.pdf.
- Estimates based on active full-time employment at the end of fiscal year 2019 and current costs for single and family plans for City employees. Premium-sharing arrangement is phased in. The first period is 18 months, running from Jan 1, 2021 through June 30, 2022 (half of fiscal year 2021 and all of fiscal year 2022), given need to negotiate and implement changes. Contributions in the first period are 4 and 6 percent for those under $65,000 and 8 and 10 percent for those over $65,000. The full contributions would be in place beginning July 1, 2022. See: City of New, NYC Open Data, Citywide Payroll Data (Fiscal Year) (accessed September 19, 2019), https://data.cityofnewyork.us/City-Government/Citywide-Payroll-Data-Fiscal-Year-/k397-673e; and Office of the New York City Comptroller, Comprehensive Annual Financial Report for the Fiscal Year Ended June 30, 2019 (October 31, 2019), https://comptroller.nyc.gov/wp-content/uploads/documents/CAFR2019.pdf.
- This analysis excludes capital related to the water and sewer system which is financed by the Municipal Water Finance Authority. For more discussion of strategies to reduce new school construction, see: Riley Edwards, Cut Costs, Not Ribbons: Alternatives That Reduce School Crowding, Citizens Budget Commission, (July 9, 2019), https://cbcny.org/research/cut-costs-not-ribbons.
- New school construction reductions based on CBC report, Cut Costs, Not Ribbons. Capital plan reductions are based on the Capital Commitment Plan, excluding planned commitments for education and water and sewer. The percentage classified as program expansion or replacement is based on the Ten-Year Strategy. Proposed reductions in capital spending are divided evenly over fiscal years 2020 through 2024; fiscal year 2020 is included as capital projects have already been delayed or paused due to the pandemic. Capital commitments are assumed to be capital expenditures with a two-year lag, so commitments avoided in fiscal year 2020 would be reflected in lower expenditures and debt service starting in fiscal year 2022. Debt service savings from new school construction are calculated using a 30-year term and interest rate of 4.5 percent (to reflect borrowing estimates in the City budget not current rates). Debt service savings for all other capital projects calculated using 30-year term but 2.5 percent interest to reflect a mix of projects with different period of probable usefulness. Based on CBC staff analysis of: City of New York, Office of Management and Budget, Executive Fiscal Year 2021 Capital Commitment Plan (April 16, 2020), https://www1.nyc.gov/assets/omb/downloads/pdf/com4-20a.pdf, and Executive Fiscal Year 2020 Ten-Year Capital Strategy (April 25, 2019), https://www1.nyc.gov/assets/omb/downloads/pdf/typ4-19.pdf; and Riley Edwards, Cut Costs, Not Ribbons: Alternatives That Reduce School Crowding, Citizens Budget Commission, (July 9, 2019), https://cbcny.org/research/cut-costs-not-ribbons.
- City of New York, Department of Finance, Annual Report of the New York City Property Tax: Fiscal Year 2019 (August 2019), https://www1.nyc.gov/assets/finance/downloads/pdf/reports/reports-property-tax/nyc_property_fy19.pdf.
- The average increase of $143 is for a Class 1 property owner. The average increase for Class 2 owner would be $134 per unit (so the average increase for a ten-unit building would be $1,340).
- Currently the City is budgeting $600 million of federal aid from The U.S. Coronavirus Aid, Relief, and Economic Security (CARES) Act to meet the City’s local share requirement. If FEMA reimburses at 100 percent, the City could redirect this aid to gap closing. See: City of New York, Office of Management and Budget, Fiscal Year 2021 Executive Budget: Message of the Mayor (April 16, 2020), https://www1.nyc.gov/assets/omb/downloads/pdf/mm4-20.pdf.
- City of New York, “NYCStat: Stimulus Tracker: Funding Summary” (accessed May 30, 2020), www.nyc.gov/html/ops/nycstim/html/summary/summary.shtml.
- Dave Friedfel and Charles Brecher, New York State's Hard Choices: Next Steps to Address Fiscal Stress, Citizens Budget Commission (May 22, 2020), https://cbcny.org/research/new-york-states-hard-choices.
- City of New York, “NYCStat: Stimulus Tracker: Funding Summary” (accessed May 30, 2020), www.nyc.gov/html/ops/nycstim/html/summary/summary.shtml.
- City of New York, “NYCStat: Stimulus Tracker: Funding Summary” (accessed May 30, 2020), www.nyc.gov/html/ops/nycstim/html/summary/summary.shtml.