Improving the Poorly Targeted Proposed School Aid Increase
One of the items yet to be settled in the State budget is the distribution of the Governor’s proposed $805 million state aid increase for school districts. Governor Cuomo’s education aid proposal contains three parts: 1) an increase in foundation aid of $290 million; 2) the addition of $265 million in categorical aids; and 3) $250 million for new competitive performance grants. The increase – promised last year – would come after two consecutive years of cuts. School district officials and the Board of Regents disapprove of the size of the competitive grant program, which would put nearly one-third of the aid increase out of the reach of many districts.[1] This concern is valid, and the proposal has additional shortcomings. As New York’s financial situation gradually improves and additional investments in public education again become possible, establishing fair school aid formulas is crucial. Not only is the set-aside for competitive grants too large, but the formulas for foundation and categorical aid work at cross purposes, undermining overall targeting to the most needy districts.
Two Years of School Aid Cuts
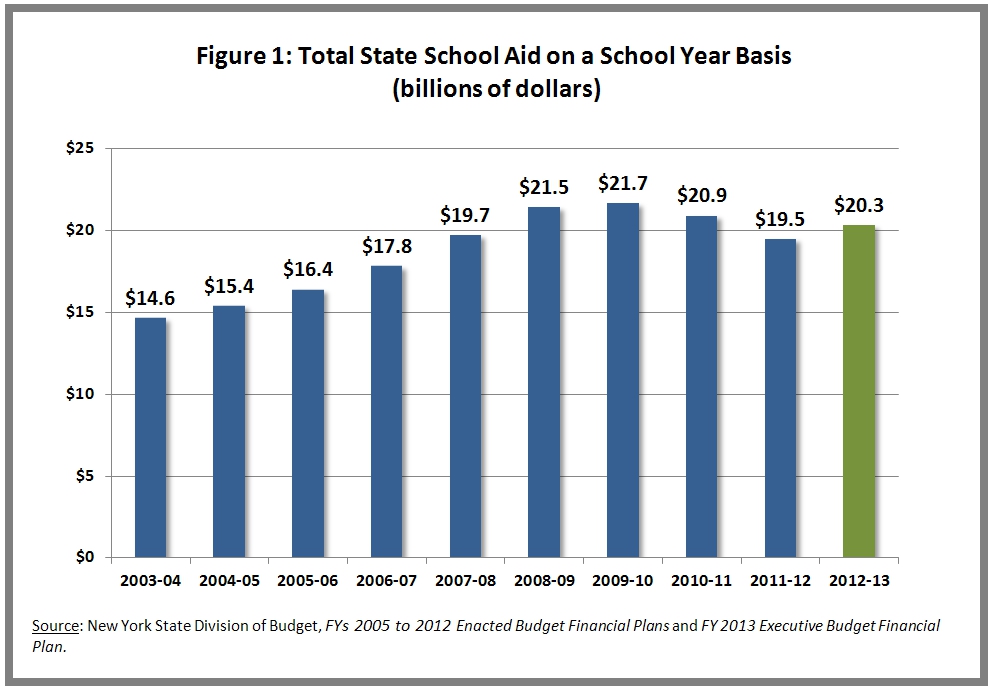
To help close large budget gaps in fiscal years 2010-11 and 2011-12, school aid was cut by $2.2 billion from its $21.7 billion peak in school year 2009-10. (See Figure 1.) School aid is the single largest item funded by general state revenues, comprising nearly 30 percent of total spending, and before fiscal conditions began to deteriorate in 2007, it had been growing rapidly. From school year 2003-04 to 2009-10 the average annual increase in aid was $1.2 billion a year, or 6.8 percent. After two consecutive years of cuts school aid is proposed to grow this coming fiscal year from last year’s level of $19.5 billion to $20.3 billion.
One of the main functions of school aid is to equalize differences in wealth and ability to pay among districts. The ability of New York’s 678 school districts to support education spending locally varies greatly. Consequently, it is important that reductions in aid be targeted so that districts that rely most heavily on State aid are harmed the least.
To evaluate how well State school aid targets district need, this analysis divides school districts into ten groups, or deciles, according to their relative student and financial need.[2] The ‘high need’ district group in any given year includes the one tenth, or decile, of school districts with the neediest students and the lowest local financial resources, while the ‘low need’ group includes the one tenth, or decile, of districts with the lowest student need and the greatest local tax base. An example of a district in the highest need group is the city of Rochester, where 89 percent of students participate in the free- or reduced-price lunch program and average property values to support local education spending are about $173,000 per pupil. At the other end of the spectrum in the lowest need group, the district of Scarsdale has no students in the free- or reduced-price lunch program and average property values to support local education spending of $1.9 million per pupil. To evaluate how well the distribution of aid targets a certain need level, these groups of districts are compared to each other before and after the most recent cuts and before and after the proposed increase for next year.
Insufficient Targeting
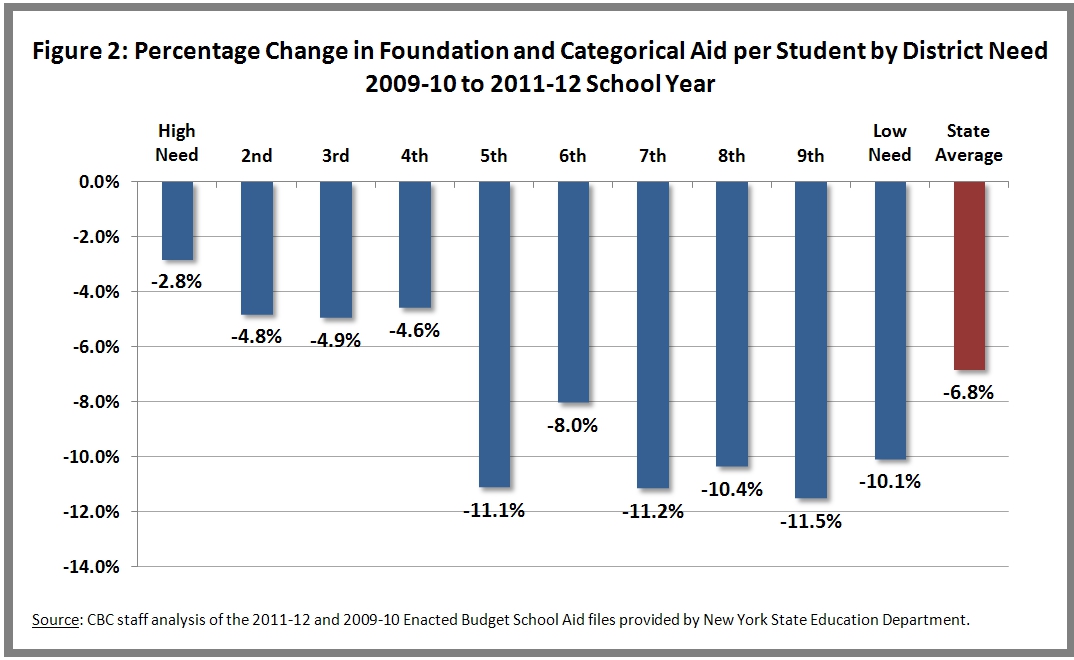
Although the cumulative cuts of the last two years were generally well targeted, some anomalies in the overall distribution are evident. The high need group experienced an average reduction in aid per student of 2.8 percent while the low need group experienced an average 10.1 percent reduction. (See Figure 2.) In the middle, however, the 5th, 7th, and 9th need deciles each experienced cuts exceeding 11 percent. Aid reductions in the 4th decile averaged 4.6 percent, less than those experienced by the needier 2nd and 3rd deciles. To illustrate, the William Floyd school district in southern Long Island in the 4th decile experienced a 3 percent cut in aid, while in the vicinity of Albany the needier 2nd decile district of Troy had to contend with a 13 percent cut.
Increases in Categorical Aid Mask Deep Cuts in Foundation Aid
The anomalies in the overall distribution of aid reductions occurred because of the way in which the cuts were made. Total school aid in New York is divided among numerous programs with different formulas for aid distribution. Some are driven by student need and ability to pay, and others are not. Foundation aid, which is the main source of general operating aid, comprises about $14.9 billion of total aid and is allocated by a formula that equalizes for district wealth and hence, ability locally to support education. The remainder of the aid, categorical aid, is distributed through more than a dozen separate formulas, only some of which account for need and ability to pay. The total cuts per district were a combination of steep decreases in foundation aid partly offset by increases in the less well-targeted categorical aid.
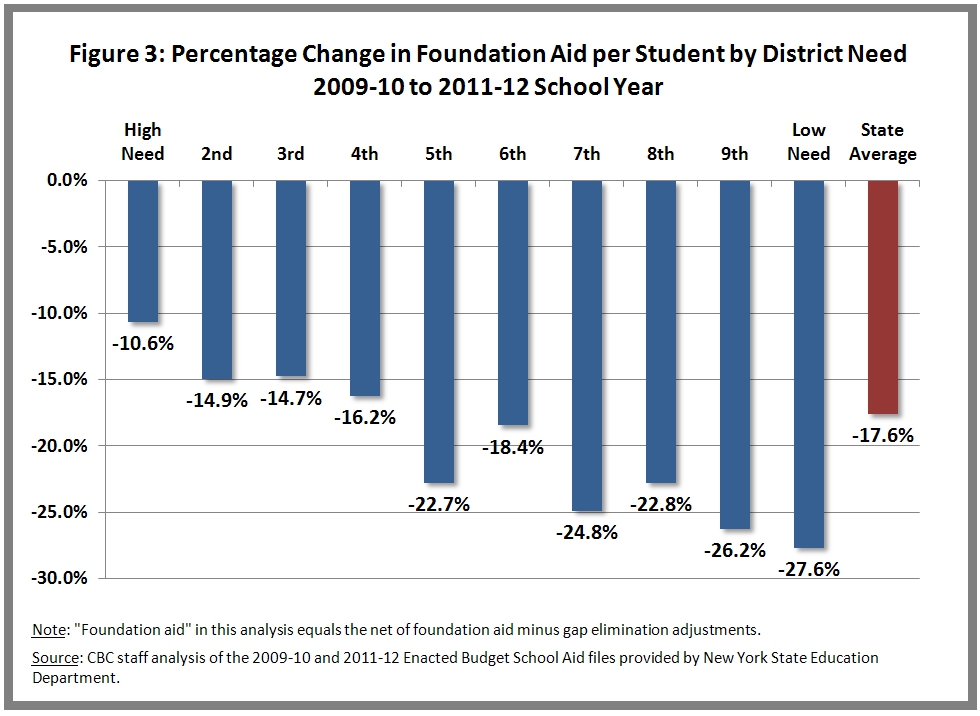
The statewide average reduction in foundation aid per student from school year 2009-10 to 2011-12 was 17.6 percent, a figure more than twice the overall aid reduction of 6.8 percent. (See Figure 3.) Districts in the highest need decile experienced a 10.6 percent reduction per student on average and the least needy districts experienced foundation aid decreases over the two-year period averaging 27.6 percent. Although the cuts in foundation aid were more targeted than the overall distribution, they were nonetheless not targeted enough. For example, the average district reduction in the 5th decile was 22.7 percent, higher than the 18.4 percent average cut experienced by districts in the less needy 6th decile.
During the period of cutbacks, foundation aid was frozen at the 2008-09 school year level and annual cuts, or “gap elimination adjustments,” were made to provide State budget relief. The foundation aid distortions were created by the interaction between the frozen foundation aid and the formula by which the cuts were made. Since the 2008-09 school year, districts have experienced changes in their student enrollment and property values. Nearly all school districts experienced changes in enrollment; 123 had an increase and 552 had decreases, and in 60 districts the decreases were a substantial 10 percent or more. The wealth measure included in the aid formulas also changed substantially for many districts; in all but one school district property values increased.[3] Although these changes were included in the formula for calculating the size of the cut, they were not included in the calculation that determined the size of the overall foundation aid package. As a result, for example, a district that experienced an increase in enrollment had a gap elimination adjustment that reflected the larger enrollment figure subtracted from a base foundation aid figure that did not, and the district was “over” cut. Similarly, districts that got wealthier were “under” cut – they experienced larger gap elimination adjustments on a base foundation aid amount that stayed the same despite their increase in ability to pay.
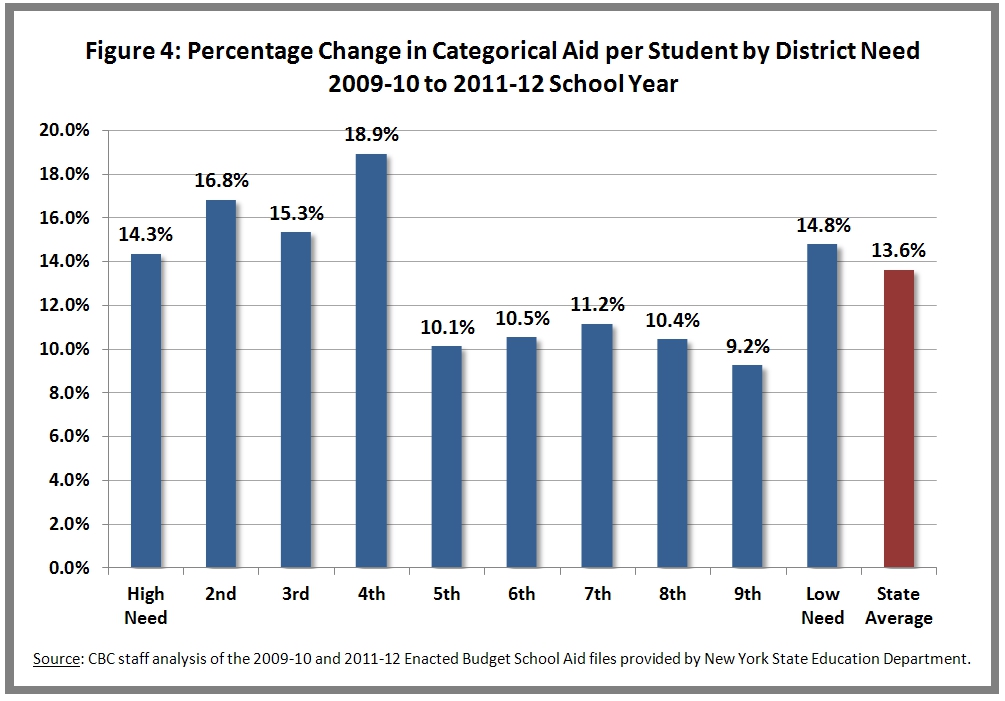
Over the two-year period large increases in categorical aid fully or partly offset the reductions in the adjusted foundation aid. In the East Hampton school district on Long Island, for example, foundation aid was cut by 31 percent but categorical aid increased by 57 percent resulting in a net decrease in total aid of just 8 percent. Categorical aid includes transportation aid, building aid for capital projects approved by the State Education Department, excess cost aid for very high need special education students, and a variety of smaller programs and grants.[4] Because the formulas that distribute categorical aids are based in large measure on district spending for specific purposes rather than on ability to pay, the increases were not at all proportional to district need. Categorical aid for districts in the neediest category increased by 14.3 percent per student and by nearly the same degree, 14.8 percent, for the least needy. (See Figure 4.) Thus, the untargeted nature of the categorical aid increases distorted the overall change in aid and resulted in widely divergent overall aid cuts that do not follow a need-based pattern of distribution.
Proposed Increases for School Year 2012-13
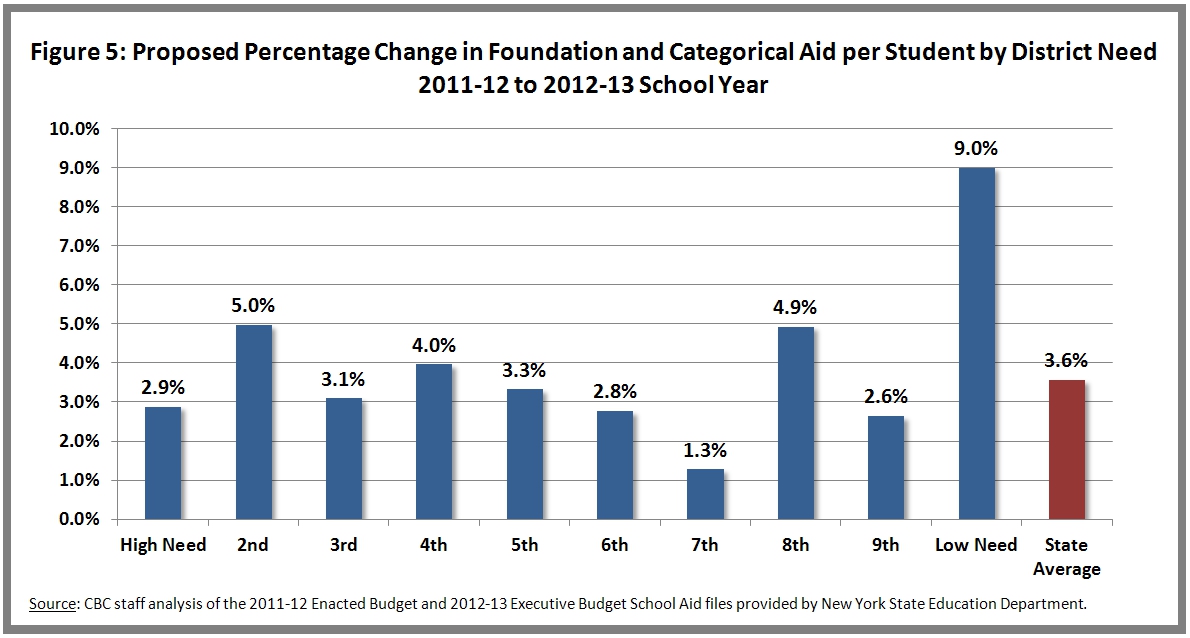
Not counting the competitive grant pool, the Governor’s proposed school aid increase for school year 2012-13 totals $555 million, an average statewide increase per student of 3.6 percent with a high degree of variation in the distribution by need. (See Figure 5.) The least needy districts in the State would benefit from an increase of 9.0 percent on average, more than three times what the neediest districts can expect under the proposal. In fact, the proposed increase for the neediest 10 percent of districts is just 2.6 percent, well below the statewide average. The expected increase for the districts in the middle of the distribution ranges from 1.3 percent in the 7th decile to 5.0 percent in the 2nd decile.
Poorly Targeted Foundation and Categorical Increases
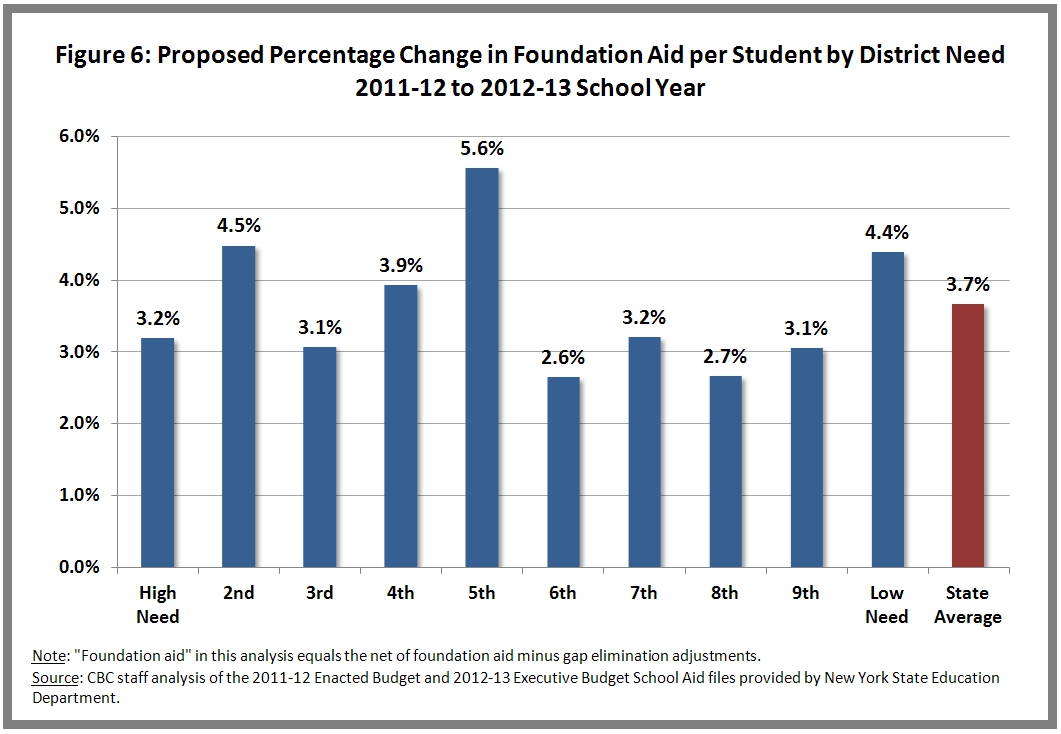
In the Governor’s proposal neither foundation aid nor categorical aid increases are well targeted. Although the average statewide increase in foundation aid per student proposed for the next year is 3.7 percent, the high need districts would experience a smaller 3.2 percent increase. Oddly, the 5th decile’s group would experience an increase of 5.6 percent, the greatest among the deciles, and the 6th decile would experience the lowest increase of 2.6 percent. (See Figure 6.)
Because the proposed allocation of increases follows the flawed frozen foundation aid method used for the previous years’ cuts, the increases vary widely within the same need group. For example, Wyoming and Williamson – in the 5th need decile with similar regional cost factors – would receive very different aid increases. Foundation aid per student for Wyoming would increase by 15 percent despite a 12 percent reduction in enrollment; in Williamson it would decrease by one percent despite a 3 percent increase in enrollment.
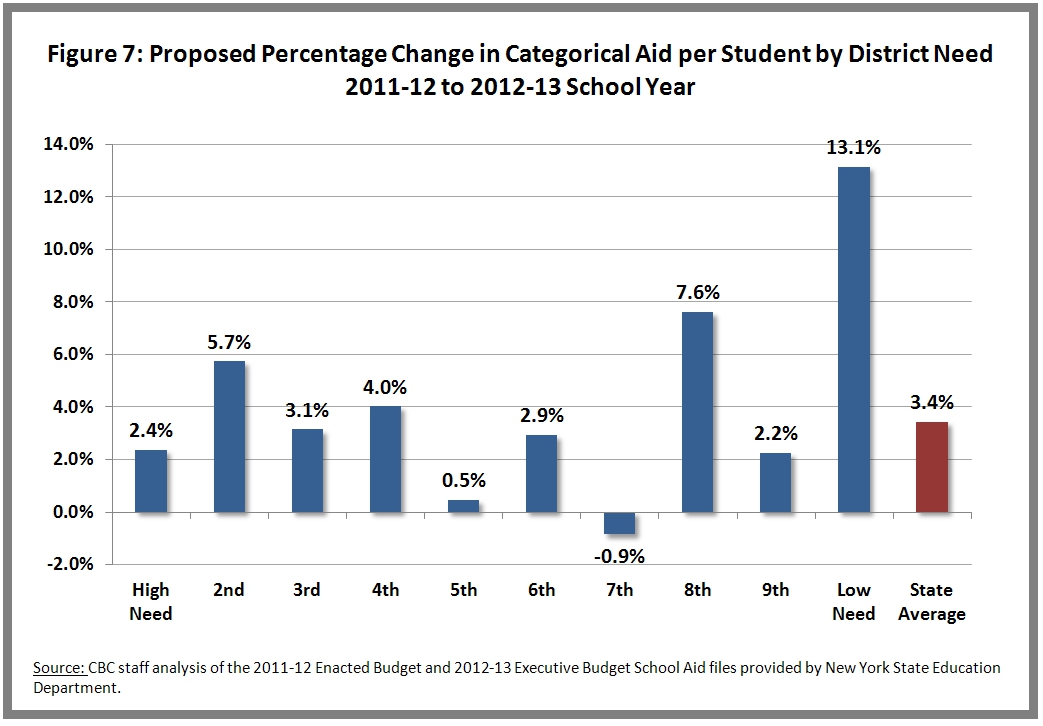
The Governor proposes categorical aid increases of $265 million for school year 2012-13, a statewide average increase per student of 3.4 percent. (See Figure 7.) These increases are even more poorly targeted than the increments to foundation aid. The wealthiest/lowest need districts would receive an average increase of 13.1 percent per student, an increment more than five times the 2.4 percent increase to be received the poorest/neediest districts.
The Untargeted Competitive Grant Pool
The Governor proposes distributing the final third of the total aid increase through competitive performance grants. Two competitive performance grant programs were authorized in the fiscal year 2011-12 budget, and the first $50 million from those programs will be distributed in the 2012-13 school year.[5] The new funding the Governor has proposed this year would add to the reward program for districts that improve academic achievement and implement the new teacher evaluation system in a timely way.[6]
The approach sets nearly one third of the total proposed increase in school aid beyond the reach of many districts. The grants will not be targeted by need and many needy districts may not apply because the criteria for the existing grant program have proven difficult to meet. Under the current program, districts must have an already approved work plan for a federal Race to the Top grant, show progress in implementing high quality student assessments and professional development for teachers, and display competitive gains in student performance from the prior year.[7] The extensive eligibility and application requirements have put struggling and small districts at a disadvantage. In fact only about 10 percent of districts applied for the already approved competitive grant of $50 million, for which the deadline was February 10.[8]
Better Targeting the Proposed Aid Increase
To help high need districts recover from two years of cuts, the proposed $805 million increase should be highly targeted to the neediest districts by relying heavily on distribution through the foundation aid formula. Categorical aid should be frozen or subject to a tight growth cap; the competitive grant program should be much smaller, if not eliminated.
In coming years, all the formulas for distributing school aid should be reexamined. When the formulas were last revised in 2007, State leaders facing rosier long-term fiscal prospects were embarking on a multi-year commitment to increase spending on education by more than $7 billion over three years. Although Governor Cuomo has committed to annual school aid increases linked to growth in personal income, it is unlikely that the State will return to the heady days of $2 billion annual school aid increases any time soon. This means that the excesses and inefficiencies built into the formulas during flush years should be flushed out. Aid formulas that contain provisions especially beneficial to wealthier districts thwart the goal of making every dollar of school aid in New York count toward boosting student achievement. A full-on effort to retool the school aid formulas should be launched.
Footnotes
- Dr. John B. King, Jr., "2012-13 Budget Presentation," New York State Education Department, January 23, 2012, http://usny.nysed.gov/docs/2012-P-12-budget-testimony.pdf; Fernanda Santos, “Regents and Cuomo Split on School Performance Grants,” New York Times School Book, January 23, 2012, accessed March 19, 2012, http://www.nytimes.com/schoolbook/2012/01/23/king-less-money-for-grants-more-for-poor-districts/.
- This analysis uses the “Need/Resource – Capacity Index” as a proxy for the ability of a district to financially meet its students’ educational needs using its local resources. The measure is the ratio of districts’ student poverty to the districts’ Combined Wealth Ratio (CWR). Student poverty is estimated using a three-year average of the kindergarten to grade 6 free- and reduced- price lunch percentages and the 2000 census poverty rate for each school district. The CWR is the ratio of district wealth per pupil to the State average wealth per pupil. Pupil counts have additional weights for students with disabilities and special education classification. Source: New York State Board of Regents, "Proposal on State Aid to School Districts for School Year 2012-13," January 2012, http://www.p12.nysed.gov/stateaidworkgroup/2012-13RSAP/RSAP1213final.pdf.
- Categorical aid is composed of 21 different categories of aid, the largest of which (accounting for 70 percent of categorical aid) are transportation aid, building aid, and BOCES aid. Reimbursements are based on actual district spending as well as district wealth.
- The property value data used by the State Education Department to determine school aid allocations are lagged. The aid allocation for the 2008-09 school year was based on 2005 data and the proposed aid allocation for the 2012-13 school year is based on 2008 data.
- One grant program rewards districts that are able improve students’ academic performance and the other rewards districts that implement cost reducing measures that do not affect student academics. Source: New York State Division of the Budget, Description of 2012-13 New York State Executive Budget Recommendations for Elementary and Secondary Education, January 17, 2012, http://publications.budget.ny.gov/eBudget1213/fy1213localities/schoolaid/1213schoolaid.pdf.
- Ibid.
- New York State Department of Education, "2012-15 School District Performance Improvement Competitive Grant Program," last updated January 13, 2012, http://www.p12.nysed.gov/funding/currentapps.html#2012-15perfimp.
- Cathy Woodruff, “Just 70 districts apply for Cuomo’s grants,” On Board Online, February 27, 2012, accessed March 15, 2012.