Increasing Without Evidence
NYS Economic Development Spending Update
This policy brief updates the Citizens Budget Commission’s (CBC’s) analysis of the cost of New York’s state and local economic development programs.1 The February 2015 report Bigger Not Better: New York’s Expanding Economic Development Programs examined economic development programs from 2010 to 2014 and urged greater reporting, scrutiny, and control of this growing and extensive portion of the budget. What’s happened since then?
- More money: Total state and local spending on economic development increased to $8.6 billion, but the rate of growth slowed.
- Changing mix: State spending is shifting toward discretionary grants, which grew $314 million, from as-of-right tax breaks, which decreased $279 million.
- Limited reforms: Improvements have been made to two state programs, but many continue to expand without evidence demonstrating return on the State’s investment.
- Little progress on transparency: Little has been done to standardize metrics, improve reporting, and create a unified economic development budget that provides a comprehensive picture of state and local spending.
The Cost of State and Local Economic Development Programs
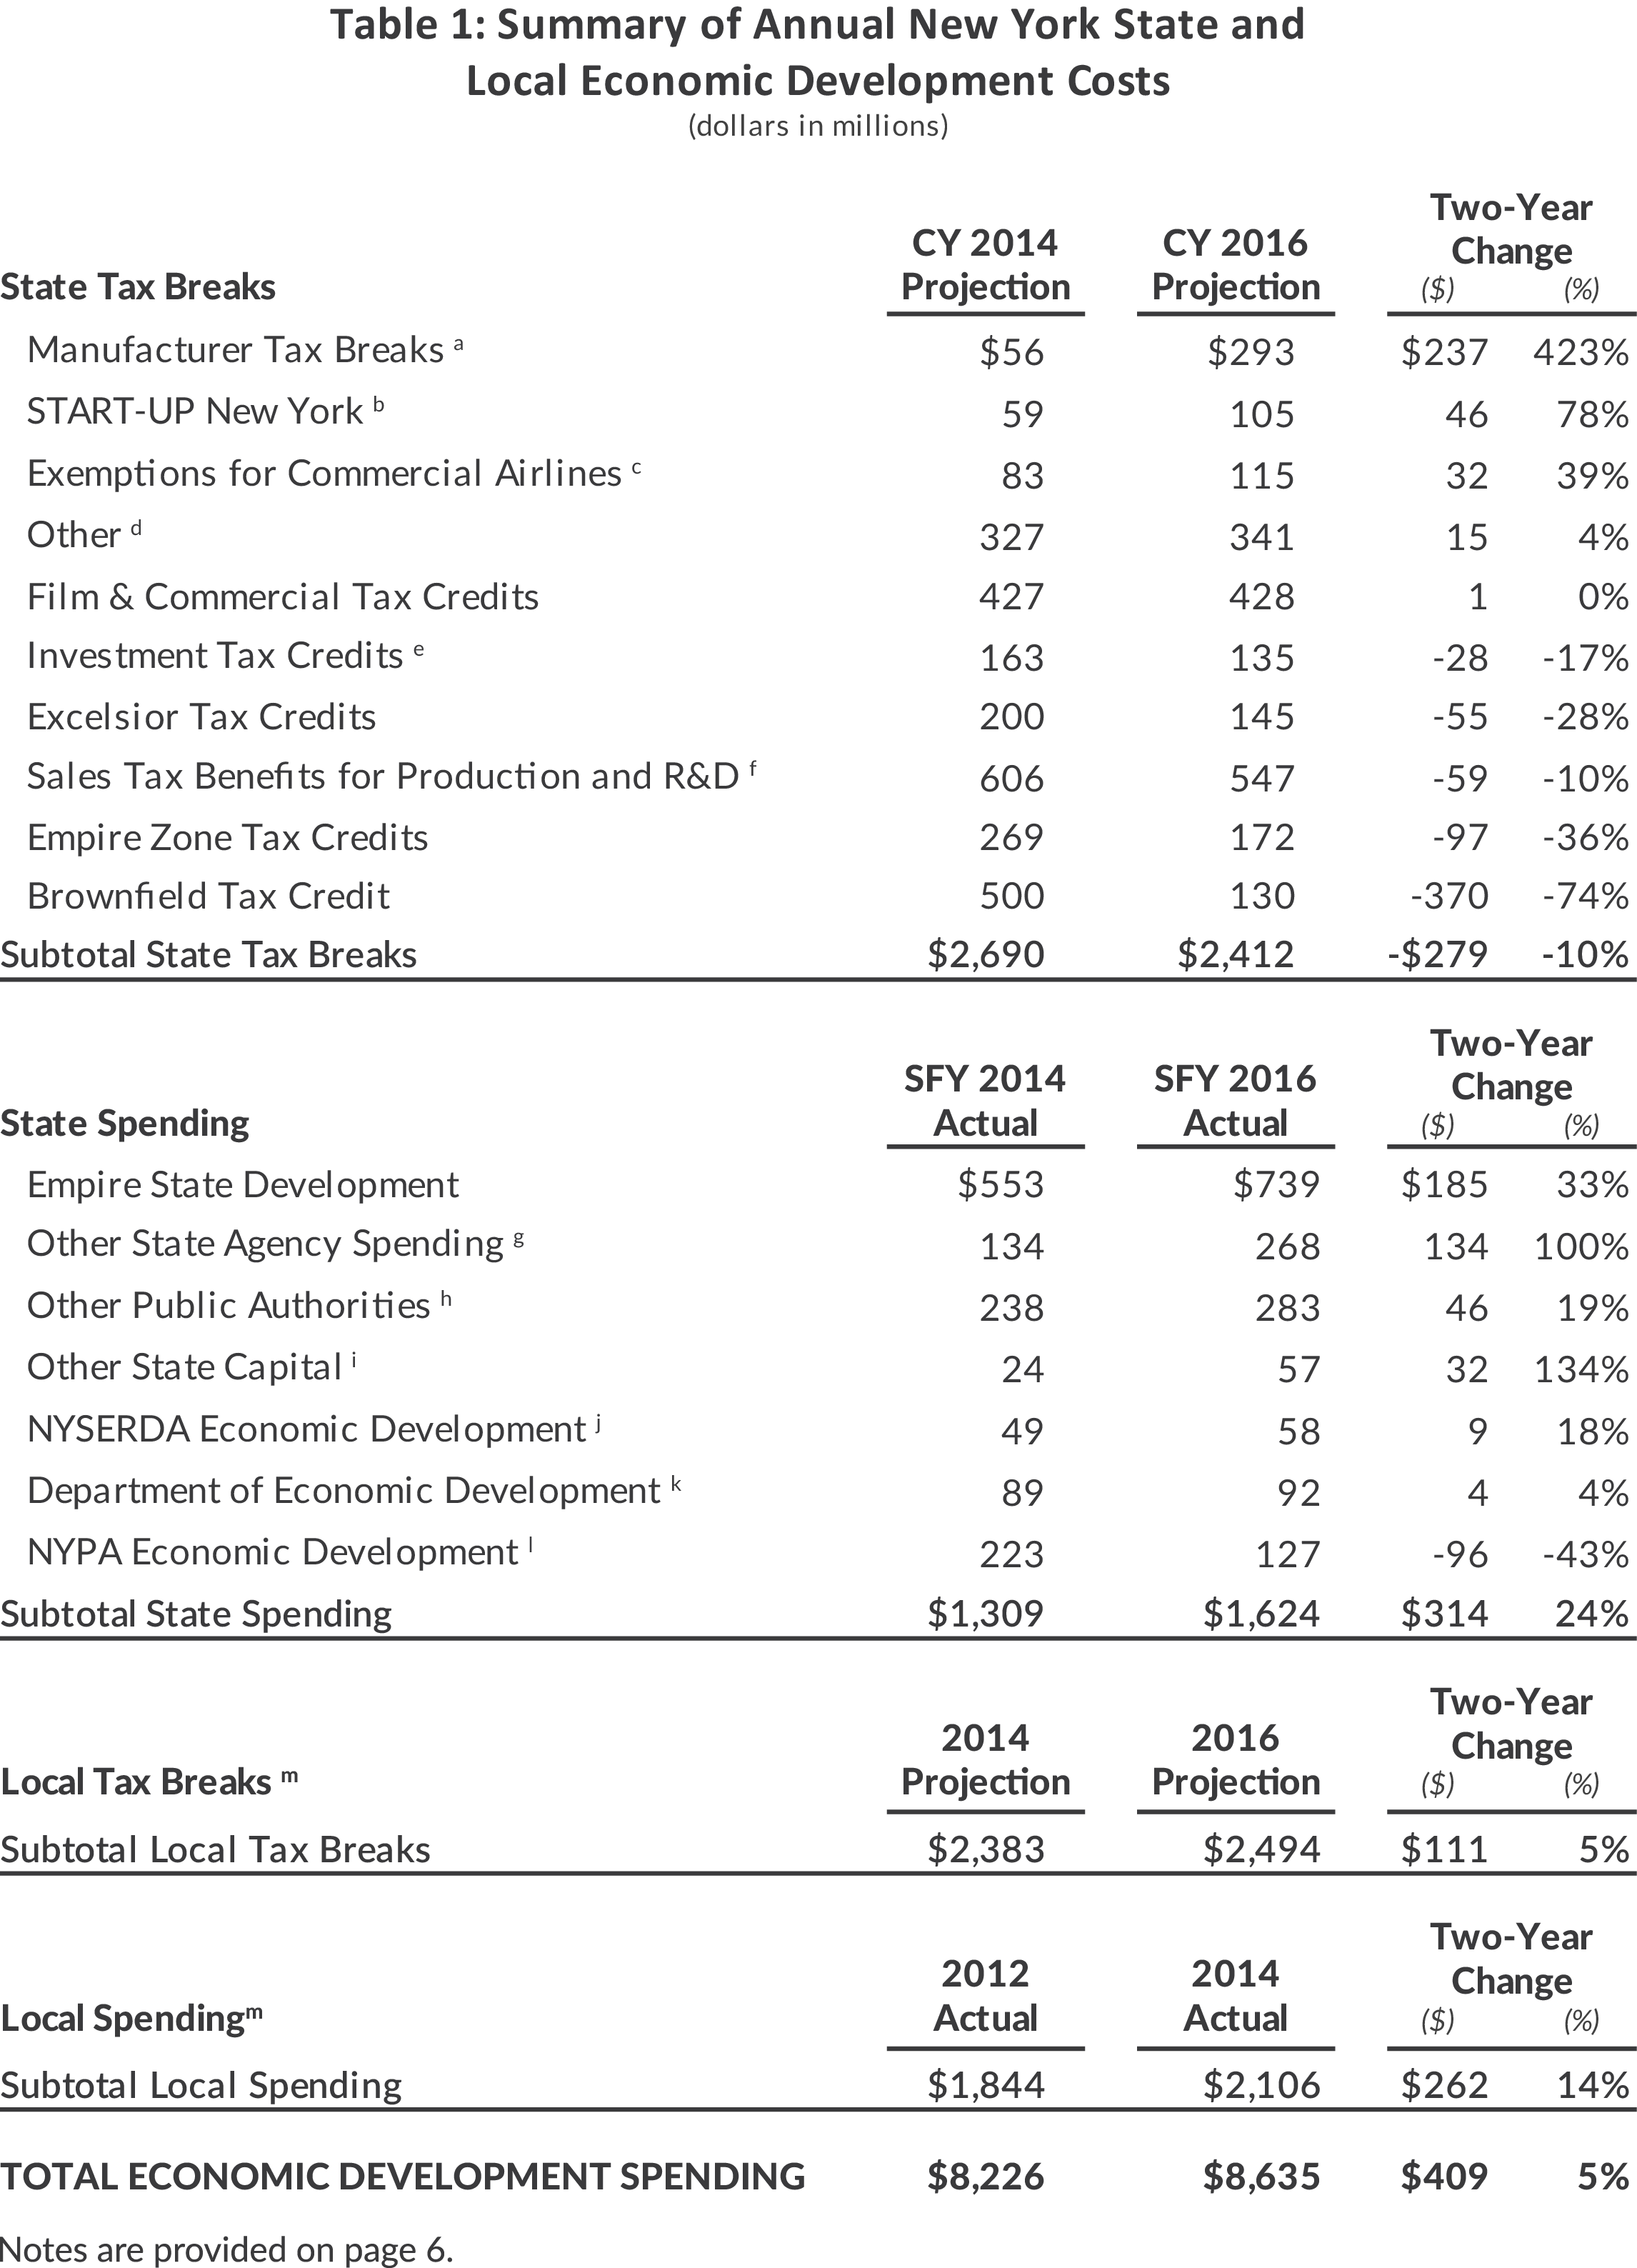
Between 2014 and 2016, the cost of state and local economic development programs grew from $8.2 billion to $8.6 billion, or 2.5 percent annually.2 (See Table 1.3) Spending growth slowed from the prior four-year average of 3.5 percent, but remains substantial.4
Local governments allocate the most: they provided $4.6 billion in 2016, an increase of $373 million over 2014. Local tax expenditures increased $111 million to $2.5 billion and local spending increased $262 million to $2.1 billion.
The State allocated $4 billion to economic development in 2016. The State’s overall spending remained virtually flat between 2014 and 2016, but State tax expenditures decreased from $2.7 billion to $2.4 billion, while State direct spending increased from $1.3 billion to $1.6 billion. This shift away from as-of-right tax expenditures and toward direct grants to businesses is not well justified. In addition, changes have expanded programs during the past two years without sufficient evidence of an adequate return on investment of taxpayer dollars.
For More Information
Download the Footnotes to Table 1Programmatic Changes Since 2014
Since 2014 two economic development programs have been reformed: the brownfield tax credit and the investment tax credit. Among the other programs, the costs of three—tax breaks for manufacturers, Empire State Development (ESD) grants, and other state spending—have grown considerably. For full program descriptions, see Bigger Not Better.
Programs Modestly Reformed
- Brownfield Tax Credit— The fiscal year 2016 budget limited eligible costs for the site preparation and redevelopment portions of this credit.5 In New York City eligible sites were further limited to those within designated Environmental Zones (areas of high poverty or high unemployment), sites with a cleanup cost greater than 75 percent of the property value if it were uncontaminated, and sites to be redeveloped into affordable housing. Between 2014 and 2016 the estimated cost dropped from $500 million to $130 million, and reforms may reduce the 2016 cost below the $130 million estimate.6
- Investment Tax Credit— Based on the recommendation of the Tax Reform and Fairness Commission, the financial services investment tax credit was eliminated in the fiscal year 2016 budget. Other recommended reforms, including limiting the credit to manufacturers, were not adopted.7
Programs with Considerable Growth in This Period
- Tax Breaks for Manufacturers— Manufacturing tax breaks were the fastest growing expenses, increasing $237 million to $293 million – a growth of 423 percent. The fiscal year 2015 budget eliminated the net income tax on corporate manufacturers, which had previously been 5.9 percent, at a cost of $193 million in 2016, and provided a new real property tax relief credit equal to 20 percent of property taxes paid by manufacturers who own or lease property, at a projected cost $100 million in 2016. 8 A Tax Foundation report found New York was among the states with the lowest effective tax rates for manufacturers in 2014, before the net income tax on manufacturers was eliminated.9 National employment data show that manufacturing grew in 2014, flattened in 2015, and started to fall in 2016. In New York, manufacturing employment fell in 2014, recovered somewhat in 2015 but fell again in 2016, which suggests the tax break has not effectively increased employment.10
- ESD Grants— ESD grants are the largest area of spending and increased by one-third since 2014.11 ESD’s capital disbursements rose from $553 million to $739 million, with much of it going to individual deals with companies or other recipients. Many of these are large projects for which money is appropriated in one year and then disbursed over a number of years. In 2016 appropriations were made for the SolarCity, Nano Utica, and Norsk Titanium projects and disbursements for these projects will follow. The largest capital disbursement in 2014 was $204 million related to the State University of New York Polytechnic Institute Colleges of Nanoscale Science and Engineering. The largest disbursement in 2016 was $323 million for the Buffalo Regional Innovation Cluster, part of the Buffalo Billion initiative.12
- Other State Agency Spending—This includes business development programs within the Department of Agriculture and Markets, community development spending within the Division of Homes and Community Renewal, and historic preservation programs within the Office of Parks, Recreation, and Historic Preservation. Total spending for these agencies increased from an estimated $134 million in 2014 to $268 million in 2016. The largest portion of the 2016 spending was in Homes and Community Renewal, which spent $201 million on community development in 2016.
A TALE OF TWO SUBSIDIES
The Muller Quaker factory in Batavia recently closed after having received $560,000 in tax incentives through the Excelsior Jobs Program. The company received benefits only after investing approximately $200 million and employing an average of 143 employees for two and a half years. The state had provided tax benefits to Muller Quaker based on its actual investments and wages, with a cost to the State per job per year of approximately $2,000. Muller Quaker was in line to receive Excelsior benefits for eight more years, but will not because its promises were not fulfilled. While the Muller Quaker Factory is not a success story, the state’s policy of pay-for-performance under the Excelsior Jobs Program limits the state’s exposure, appropriately countering the risks in economic development spending.
In contrast the State is paying $750 million to build a factory in Buffalo for SolarCity in exchange for a promise of 5,000 jobs at the end of 10 years. Based on the employment projections, benefits are likely to exceed $20,000 per job per year or 10 times the cost per job at the Muller Quaker factory. If the economics of SolarCity falter and the factory does not open or closes prematurely, New York State taxpayers are left holding the bag– an empty $750 million factory. If SolarCity was a participant in the Excelsior Jobs program, SolarCity would be required to make investments in its factory and employ staff, with New York State providing tax credits to offset some of these costs. Instead, New York State agreed to make an upfront investment based on promises that SolarCity will meet evolving employment targets. If SolarCity does not fulfill its job creation targets, there is a $41.6 million annual penalty that ESD can levy; however, imposing a fine puts the onus on the State to prove that requirements were not fulfilled by SolarCity and puts an economic development entity in the unenviable position of imposing significant economic harm on a New York business. This level of risk is very high.
Updates on Other Programs
- Film Production Tax Credit- If the State’s projection for 2016 is met, this tax expenditure will have remained flat since 2014 but nearly doubled since 2011 to $428 million. Recent academic analysis questions the efficacy of such programs.13 Nonetheless, a bill passed in the 2016 legislative session would create a similar program for music and video game production.14
- START-UP NY – Costs for START-UP NY increased more slowly than expected owing to a small number of participating companies. At the end of 2015, 441 sites and 159 companies were enrolled. The Division of the Budget projects the total value of tax expenditures for START-UP NY to be $105 million in 2016; however, take-up has been slower than expected and ESD estimated the total tax benefits earned by START-UP NY companies in 2015 at only $1.2 million.15 Despite an extensive marketing campaign, the program had unimpressive results, with 76 jobs created in 2014 and 332 in 2015.16 The largest expense has been the marketing campaign, estimated at $53 million, or about $130,000 per job created.17
- Excelsior Jobs Program– Excelsior spending decreased by $55 million since 2014 to $145 million in 2016; however, expansion of eligibility to additional industries, lowered job creation thresholds, and extension of the benefit period from 5 to 10 years have brought the program closer to the weaknesses of Empire Zone program it replaced. Most recently, the credit was expanded in the fiscal year 2016 budget to allow entertainment companies to qualify.18 A July 2016 audit by the Office of the State Comptroller (OSC) found several problems with the administration of the program, including lowering of annual job creation targets when companies did not meet original targets.19
- New York Power Authority (NYPA) Programs— NYPA programs decreased by 43 percent to $127 million in 2016. The value of the subsidy is highly dependent on changes in market energy prices and NYPA’s rates; from 2014 to 2016, market energy rates decreased while NYPA rates increased, so the value of the subsidy fell.20 Although market rates have continued to fall, if they do rebound, the cost of this subsidy may increase again if NYPA rate increases do not keep pace. Furthermore, NYPA’s reporting is lacking: it does not report foregone revenue from selling power at a discounted rate via ReCharge NY and the Expansion, Replacement, and Preservation Power programs, and it does not report on the results of economic development investments made with revenue from sales of unallocated power in Western New York and the North Country. An audit from the OSC found errors in NYPA’s public reporting on ReChargeNY.21
Assessment of Progress on CBC's Recommendations
CBC has consistently called for:
- coordination and consolidation of economic development programs;
- standardized metrics to measure economic need and project impacts; and
- development of a unified economic development budget, which would provide a complete picture of the costs and benefits of all forms of spending—including tax expenditures, direct spending, and power and other subsidies—by all state and local entities, including local development corporations.22
The cost of economic development in New York continues to grow overall and for most programs. At $8.6 billion in annual spending and tax expenditures, a significant investment of public funds is being made without the data collection and reporting necessary to determine how much, if any, is warranted.
At best, limited progress has been made in implementing recommended reforms. The most significant step forward has been the establishment of the Regional Economic Development Councils (REDCs), which have been a critical tool for coordinating economic development spending and pursuing strategic investments through a consolidated award process. REDCs have awarded $3.9 billion over five annual rounds of funding; however, there were significant weaknesses in performance reporting in the first years of the competition, both on regional metrics and project-level progress measures.23 Other large programs suffer from similar weaknesses. More robust reporting requirements are necessary so that project outcomes can be evaluated and ineffective programs modified or eliminated.
Virtually no progress has been made in creating a unified economic development budget. New business deals and incentives are announced one by one, with no single tally of their cost to taxpayers. Individual deals like those with SolarCity and Norsk Titanium are not subject to standardized parameters for eligibility or results. The substantial growth in state spending on ESD and other grants suggests a shift that underscores the need for standardized metrics, a “database of deals,” and the development of a comprehensive economic development budget to capture the full extent of the state’s financial commitments.24
Footnotes
- This update uses a different methodology than prior reports. State spending information was derived from state budget documents rather than from individual agency reports. New York State Energy Research and Development economic development spending no longer includes Regional Greenhouse Gas Initiative. 2016 State Agency Spending was obtained directly from the Division of the Budget and does not include Stem Cell Innovation Fund or Olympic Regional Development Authority. Other State Capital now also includes the Special Infrastructure Account and Regional Economic Development Program. New York Power Authority total now includes contributions to Western New York Economic Development Trust Fund. Other Public Authorities now includes Albany Convention Center Authority, Hudson River Park Trust, New York Convention Center Operating Corporation, Olympic Regional Development Authority, and New York State Thoroughbred Breeding and Development Fund in addition to New York State Agriculture & Horse Breeding Development Fund and Development Authority of North Country. The local impacts of state sales tax exemptions were not previously included. New York City Economic Development Corporation (NYCEDC) spending was previously calculated from NYCEDC financial statements and is now drawn from data from the Office of the New York State Comptroller.
- For 2014 and 2016, actual tax expenditures are not available, so projections are used. Tax expenditure projections are often higher than actual expenditures. In 2012, the most recent year for which actual tax expenditures are available, the actual total of economic development tax expenditures was $1.9 billion. Projections for 2012, made in that year, totaled $2.6 billion, nearly 40 percent higher than the actual cost. See: New York State Division of the Budget, Annual Report on New York State Tax Expenditures 2012-2013 Fiscal Year, www.budget.ny.gov/pubs/archive/fy1213archive/eBudget1213/fy1213ter/TaxExpenditure2012-13.pdf, and FY 2017 Annual Report on New York State Tax Expenditures, www.budget.ny.gov/pubs/executive/eBudget1617/fy1617ter/TaxExpenditure2016-17.pdf.
- Sources for Table 1: New York State Division of the Budget, FY 2017 Annual Report on New York State Tax Expenditures, www.budget.ny.gov/pubs/executive/eBudget1617/fy1617ter/TaxExpenditure2016-17.pdf, FY 2016 Annual Report on New York State Tax Expenditures, www.budget.ny.gov/pubs/archive/fy1516archive/eBudget1516/fy1516ter/TaxExpenditure2015-16.pdf, FY2015 Enacted Budget Financial Plan, p. 76, www.budget.ny.gov/pubs/archive/fy1415archive/enacted1415/FY2015EnactedBudget.pdf, FY2017 Enacted Budget Financial Plan, p. T-155, www.budget.ny.gov/budgetFP/FY2017FP.pdf, and FY2012 Enacted Budget Financial Plan, p. T-175, www.budget.ny.gov/pubs/archive/fy1112archive/enacted1112/2011-12EnactedBudget.pdf; New York State Energy Research and Development Authority, Financial Statements (March 31, 2011), and Financial Statements (March 31, 2016), www.nyserda.ny.gov/-/media/Files/Publications/Annual-Reports-and-Financial-Statements/2016-NYSERDA-financial-statements-march.pdf; Power Authority of the State of New York, 2013 Report to the Governor and Legislative Leaders on Power Programs for Economic Development (April 2014), www.nypa.gov/services/economicdev/2013GovernorsAnnualReportFinal.pdf, 2014 Report to the Governor and Legislative Leaders on Power Programs for Economic Development (April 2015), www.nypa.gov/services/economicdev/2014GovernorsAnnualReportFinal.pdf, 2015 Report to the Governor and Legislative Leaders on Power Programs for Economic Development (April 2016), Electric Supply Rates - Business Customers: Beginning 2012 (July 20, 2016), https://data.ny.gov/Energy-Environment/New-York-Power-Authority-NYPA-Electric-Supply-Rate/2x8p-pewm, 2014 Annual Report (March 2015), www.nypa.gov/NYPA-2014-AnnualReport.pdf, 2015 Annual Report (March 2016), www.nypa.gov/NYPA-2015-AnnualReport.pdf, and 2013 Annual Report: The Power to Serve (March 25, 2014), www.nypa.gov/AR13/ar13.pdf; Authorities Budget Office, State Public Authority Directory and Reports, 2015 Audit Reports and 2013 Audit Reports, www.abo.ny.gov/paw/paw_weblistingST.html, and Annual Report on Public Authorities in New York State (July 1, 2015), pp. 26, 50, www.abo.ny.gov/reports/annualreports/ABO2015AnnualReport.pdf; The City of New York Department of Finance Tax Policy Division, Annual Report on Tax Expenditures Fiscal Year 2016, www1.nyc.gov/assets/finance/downloads/pdf/reports/reports-tax-expenditure/ter_2016_final.pdf; Office of the New York State Comptroller, Annual Performance Report on New York State’s Industrial Development Agencies, Fiscal Years Ending 2014 (June 2016), p. 7, www.osc.state.ny.us/localgov/pubs/research/ida_reports/2016/idaperformance.pdf, Financial Data for Local Governments, “Local Development Corporations” (accessed July 2016), www.osc.state.ny.us/localgov/datanstat/findata/index_choice.htm, and Financial Data for Local Governments, "Local Government Finances" (accessed July 2016), www.osc.state.ny.us/localgov/datanstat/findata/index_choice.htm.
- Citizens Budget Commission, Bigger Not Better: New York’s Expanding Economic Development Programs (February 2015), p. 3, www.cbcny.org/sites/default/files/REPORT_NYSEconDev_02192015.pdf.
- New York State Department of Environmental Conservation, 2015 Enacted Budget Brownfield Cleanup Program Reforms (accessed August 4, 2016), www.dec.ny.gov/chemical/101350.html.
- New York State Department of Taxation and Finance, Brownfield Credit Report 2014, www.tax.ny.gov/pdf/stats/policy_special/brownfield_credit_reports/brownfield_credit_report_cy2014.pdf; and New York State Division of the Budget, FY 2017 Annual Report on New York State Tax Expenditures, www.budget.ny.gov/pubs/executive/eBudget1617/fy1617ter/TaxExpenditure2016-17.pdf.
- New York State Tax Reform and Fairness Commission, Final Report (November 2013), p. 24, www.governor.ny.gov/sites/governor.ny.gov/files/archive/assets/documents/greenislandandreportandappendicies.pdf
- New York State Division of the Budget, FY2015 Enacted Budget Financial Plan, p. 76, www.budget.ny.gov/pubs/archive/fy1415archive/enacted1415/FY2015EnactedBudget.pdf.
- Tax Foundation, “Location Matters: Effective Tax Rates on Manufacturers by State” (September 1, 2015), http://taxfoundation.org/blog/location-matters-effective-tax-rates-manufacturers-state.
- U.S. Bureau of Labor Statistics, Current Employment Statistics (accessed August 29, 2016), 2013-2016 monthly estimates, http://data.bls.gov/cgi-bin/dsrv?ce.
- New York State Division of the Budget, FY2017 Enacted Budget Financial Plan, p. T-155, www.budget.ny.gov/budgetFP/FY2017FP.pdf, and FY2015 Enacted Budget Financial Plan, p. T-174, https://www.budget.ny.gov/pubs/archive/fy1415archive/enacted1415/FY2015EnactedBudget.pdf.
- New York State Division of the Budget, New York State Enacted Budget Capital Program and Financing Plan For Fiscal Year 2015 (May 2014), p. 154-155, www.budget.ny.gov/pubs/archive/fy1415archive/enacted1415/FY2015EnactedCapitalPlan.pdf, and FY2017 Enacted Capital Program and Financing Plan, p. 162, www.budget.ny.gov/budgetFP/FY2017CPFP.pdf.
- Michael Thom, “Lights, Camera, but No Action? Tax and Economic Development Lessons from State Motion Picture Incentive Programs,” American Review of Public Administration (June 5, 2016), pp. 1-23, http://arp.sagepub.com/content/early/2016/06/03/0275074016651958.full.pdf.
- State of New York, Senate Bill S7485B (2016), www.nysenate.gov/legislation/bills/2015/s7485/amendment/b.
- New York State Division of the Budget, FY 2016 Annual Report on New York State Tax Expenditures, p. 158, www.budget.ny.gov/pubs/archive/fy1516archive/eBudget1516/fy1516ter/TaxExpenditure2015-16.pdf; and Empire State Development, START-UP NY Businesses Located in Tax-Free Areas (July 2016), http://esd.ny.gov/Reports/STARTUPNYReport-ParticipatingBusinesses2015.pdf.
- Empire State Development, The Business Incentives Report (July 1, 2016), p. 10, http://esd.ny.gov/Reports/2015_ESD_Business_Incentives_Report.pdf.
- Office of the New York State Comptroller, Marketing Service Performance Monitoring: Empire State Development (May 2015), www.osc.state.ny.us/audits/allaudits/093015/14s10.pdf.
- David Copeland and Rahul Jain, “Learning from Past Mistakes: Examining Changes to the Excelsior Jobs Program,” Citizens Budget Commission Blog (October 21, 2015), http://www.cbcny.org/cbc-blogs/blogs/learning-past-mistakes-examining-changes-excelsior-jobs-program.
- Office of the New York State Comptroller, Performance of the Excelsior Jobs Program (July 15, 2016), www.osc.state.ny.us/audits/allaudits/093016/15s15.pdf.
- See methodology in: Citizens Budget Commission, Overhauling the New York Power Authority’s Economic Development Programs (September 2009), www.cbcny.org/sites/default/files/report_nypa_09222009.pdf. See: Power Authority of the State of New York, 2013 Report to the Governor and Legislative Leaders on Power Programs for Economic Development (April 2014), www.nypa.gov/services/economicdev/2013GovernorsAnnualReportFinal.pdf, 2014 Report to the Governor and Legislative Leaders on Power Programs for Economic Development (April 2015), www.nypa.gov/services/economicdev/2014GovernorsAnnualReportFinal.pdf, 2015 Report to the Governor and Legislative Leaders on Power Programs for Economic Development (April 2016); Electric Supply Rates - Business Customers: Beginning 2012 (July 20, 2016), https://data.ny.gov/Energy-Environment/New-York-Power-Authority-NYPA-Electric-Supply-Rate/2x8p-pewm, 2014 Annual Report (March 2015), www.nypa.gov/NYPA-2014-AnnualReport.pdf, 2015 Annual Report (March 2016), www.nypa.gov/NYPA-2015-AnnualReport.pdf, and 2013 Annual Report: The Power to Serve (March 25, 2014), www.nypa.gov/AR13/ar13.pdf.
- Office of the New York State Comptroller, Selected Management and Operations Practices: New York Power Authority (August 2016), www.osc.state.ny.us/audits/allaudits/093016/15s20.pdf.
- Citizens Budget Commission, Avoiding Past Mistakes: Principles for Governing Regional Economic Development Councils (September 2011), http://www.cbcny.org/sites/default/files/REPORT_RegionalCouncils_09132011.pdf, and Bigger Not Better: New York’s Expanding Economic Development Programs (February 2015), www.cbcny.org/sites/default/files/REPORT_NYSEconDev_02192015.pdf.
- Citizens Budget Commission, An Assessment of Performance Reporting by Regional Economic Development Councils (November 30, 2015), www.cbcny.org/sites/default/files/REPORT_REDC_11302015.pdf.
- Observer Dispatch Editorial Board, “Creating ‘Database of Deals’ Would Be a Window for Public,” Observer Dispatch (August 10, 2016); and Testimony of Dave Friedfel, Director of State Studies, Citizens Budget Commission, before the New York State Assembly Standing Committee on Economic Development, Job Creation, Commerce and Industry (August 3, 2016), www.cbcny.org/sites/default/files/TESTIMONY_08032016.pdf.