Mapping the Mayor's Housing Plan
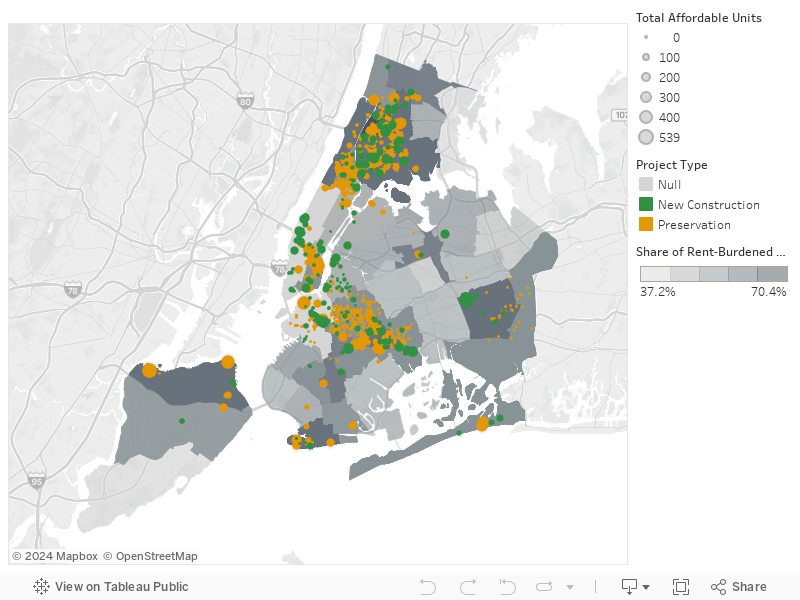
The Citizens Budget Commission has created the interactive map below to plot the location of each housing development created or preserved under New York City’s Housing New York plan to date.
In July Mayor Bill de Blasio announced that the City has produced or preserved 77,651 affordable housing units under the housing plan since he took office in January 2014.1 The New York City Department of Housing Preservation and Development tracks the number and location of affordable housing units financed.2
Some neighborhoods, particularly in Central Brooklyn, Harlem, and the South Bronx, have seen significant amounts of new construction and preservation activity. In contrast, there has been little to no activity in other neighborhoods, including some with significant shares of rent-burdened households (those that pay more than 30 percent of income on rent). These neighborhoods include:
- Sunset Park, Borough Park, and Sheepshead Bay in Brooklyn;
- Elmhurst, Corona, Flushing, Jackson Heights, Woodhaven, and Ozone Park in Queens;
- Washington Heights and Inwood in Manhattan;
- Soundview, Williamsbridge, Wakefield, and Baychester in the Bronx; and
- the Mid-Island and South Shore neighborhoods of Staten Island.
The map shades each neighborhood according to the share of rent-burdened households in that area.3 The size of each dot denotes the number of affordable units preserved or constructed in each housing development financed under the housing plan, and the dots are colored to indicate whether the development is new construction (green) or a preservation project (orange). Clicking on a dot allows you to see additional information on the number of units financed by affordability level.
Footnotes
- City of New York, Office of the Mayor, “Mayor de Blasio Announces Record Pace Building and Protecting Affordable Housing” (press release, July 13, 2017), http://www1.nyc.gov/site/housing/news/07-13-17.page.
- City of New York, Department of Housing Preservation and Development, “Housing New York Units by Building,” (April 27, 2017), https://data.cityofnewyork.us/Housing-Development/Housing-New-York-Units-by-Building/hg8x-zxpr. The Housing New York database provides building-level information on projects under the Housing New York plan. The database is current through the end of March 2017 and includes information on 2,141 buildings and 63,398 affordable units. Of those, 678 units are occupied by victims of domestic violence and are classified as confidential to protect the beneficiaries’ privacy. The projects included in the database have received assistance through a variety of affordable housing programs, including discretionary and as-of-right property tax abatements (including projects that provide affordable units through the 421-a program, now known as Affordable New York), grants, loans, low-cost financing through the New York City Housing Development Corporation, and other miscellaneous sources of city funding.
- The map displays the share of rent-burdened households based on calculations by New York University’s Furman Center for Real Estate and Urban Policy. Note the Furman Center’s definition of rent burden differs from measures presented in CBC’s 2015 report, Whose Burden is it Anyway?