The New York City Budget Since the Recession
Seven Rounds of Cuts and the Deepest Still to Come
The dramatic aid reductions proposed by Governor Andrew Cuomo in his Executive Budget on February 1 are likely to lead to cuts in spending by New York City agencies. These forthcoming cuts should be understood in the context of previous efforts to reduce municipal spending.
Mayor Michael Bloomberg sought to contain New York City’s spending before the national recession began in 2008, but the most important budget actions occurred after the recession caused declines in the City’s tax revenues. Since the fiscal year 2009 budget was adopted in June 2008, Mayor Bloomberg has implemented seven rounds of budget cuts.[1] Although the city’s economy is now stabilizing, an eighth round of cuts, likely the largest yet, is expected on February 17 when the Mayor releases his next financial plan. These cuts will be attributable largely to anticipated reductions in State aid due to the State of New York’s fiscal difficulties, as well as to losses in federal aid.
As a prelude to the next round of cuts, this posting analyzes the nature and impact of the previous budget balancing actions, known as Programs to Eliminate the Gap or PEGs. The analysis proceeds in two steps. First, the six PEGs adopted and implemented in fiscal years 2009 and 2010 are summarized. Then the PEG proposed in November 2010 is added to the previous PEGs for a cumulative summary. The posting ends with some observations about what the next PEG may have in store for New Yorkers.
The highlights of the analysis are:
- In the last two fiscal years the City’s PEGs proposed a total of $3.4 billion in budget balancing actions; of this total just under $2.0 billion were agency expenditure reductions and the rest were primarily revenue increases or shifts from local to federal or state funding.
- The agencies with the largest absolute expenditure cuts were the Department of Education, Sanitation Department, and Administration for Children’s Services.
- The measures proposed in November 2010, not all of which are being implemented, would raise the cumulative expenditure reductions to nearly $2.2 billion with a similar pattern of impacts.
- Anticipated State actions will require substantial new cuts in agency budgets unless ways are identified and approved to reduce spending for pension fund contributions and health insurance premiums for employees and retirees.
How $3.4 Billion in PEGs Equal Less than $2.0 Billion in Cuts
The actions proposed in the six PEGs spanning fiscal years 2009 and 2010 total nearly $3.4 billion. However, these measures yielded less than $2.0 billion in agency expenditure reductions for two reasons. (See Figure 1.) First, many of the PEG actions were designed to raise new revenue rather than cut spending. The City explicitly identified in its PEG documents $593 million in revenue raising measures. These included $84 million in anticipated revenues from the proposed but never implemented plastic bag tax, $63 million in additional revenues from stricter enforcement of “Block the Box” violations, $34 million from increasing parking and parking meter rates and $24 million from a Department of Finance initiative to increase tax audit revenue.
In addition to these explicit revenue measures, the PEG “expense” actions included other funding sources as offsets to expenses. For example, PEG expense items included savings from plans to “maximize” federal matching funds for certain programs and from shifting staff positions to federal, state or private funding sources. The Office of Management and Budget classifies these actions as expense reductions because they reduce the level of tax levy spending. However, they do not represent a reduction in the level of total resources available to an agency, and in that sense are not “cuts.” Adding these funding shifts and similar actions to the explicit revenue measures nearly doubles the revenue-related actions in the PEGs from $539 million to over $1 billion, or nearly one-third of the cumulative proposed savings in the last two fiscal years.
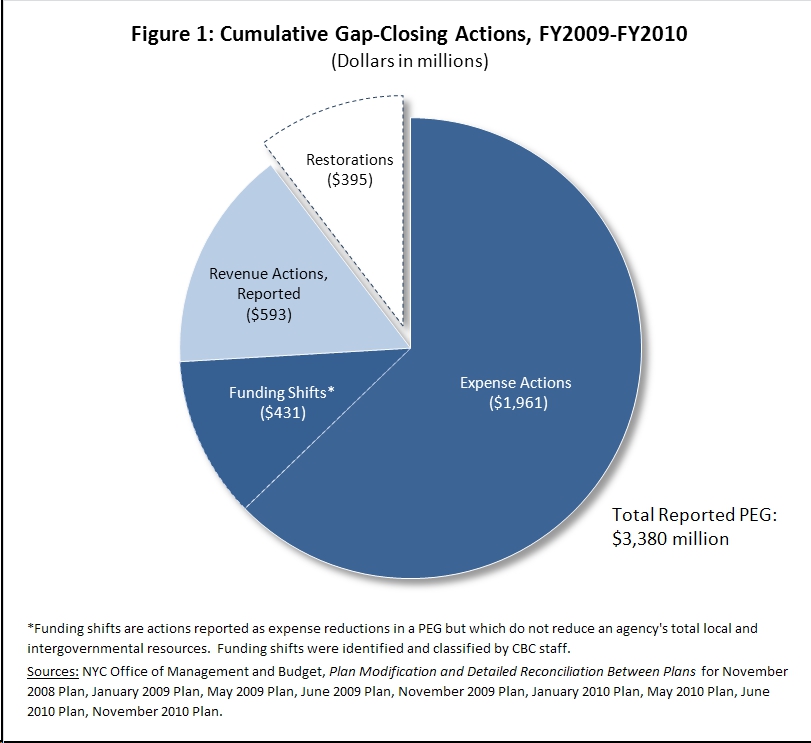
A second factor influencing the value of the PEGs is decisions not to implement some of the proposed actions. These “restorations,” often made through negotiations among the Mayor and City Council leaders, offset $395 million in proposed expenditure cuts. Where were the funds restored? The agency that benefited most is the Police Department. Of the Department’s proposed $253 million in expense reductions, $160 million were reversed, including about $100 million associated with eliminating 2,000 uniformed positions. Other restorations included $40.6 million in the Department of Corrections, $46.5 million for libraries, $19.5 million for cultural institutions, and $17 million for 16 fire companies slated for closure.
The $2 Billion in Cuts: Who Was Hit Hardest?
The magnitude of agency cuts can be judged in two ways – the absolute amounts and proportional shares. Both types of indicators are shown in Table 1.
The single largest cut, $926 million accounting for nearly half the total expense actions, was at the Department of Education, which has the largest agency budget. Most of these savings involved non-personnel items such as contracts for curriculum and staff development, but $204 million resulted from eliminating 475 administrative and support staff positions, including 344 through layoffs, and not filling 1,440 teacher positions through attrition.
The second largest cut, nearly $121 million, was in the Sanitation Department. As with education, the bulk of the cuts were in non-personnel items. More than half of the reduction came in the form of re-estimates for waste exportation and landfill closure contract expenses these waste export savings are largely due to the City’s budgeting for higher per-ton export costs based on anticipated long-term contracts that have yet to be negotiated, while getting better rates in the short-term. Still the department made over $25 million in cuts to programs aimed at waste prevention and recycling outreach and eliminated 240 positions, most of which were street cleaners, through attrition.
Another hard-hit agency was the Administration for Children’s Services, cut by nearly $103 million. The bulk of the savings – $66 million – came from cuts to direct services, including staff reductions of 969 positions. Another $16 million were cut from payments to foster homes and other contractors, with the balance coming from administrative items.
An alternative way to assess cuts is to ask if an agency had to absorb more than its “fair share” of the reductions. The shares are gauged in Table 1 in terms of the percentage reduction from the agency’s baseline budget (compared to the agency-wide average of 6.7 percent).
All three of the agencies with large absolute cuts also suffered disproportionately harsh cuts. Several smaller agencies also experienced disproportionate cuts. Agencies with double-digit percentage reductions included the departments of Aging, Homeless Services, Parks, and Housing Preservation and Development (HPD). At the Department for the Aging cuts equaled nearly one-fifth of the previously planned 2009 budget; while staff reductions were minimal, the agency’s contracts for services suffered heavily. The Department of Homeless Services was cut 12.5 percent; it eliminated over 300 positions, including 100 layoffs. At Parks, budget cuts totaling $40 million – 15% of planned expenditures – included the elimination of nearly 700 positions and reductions in seasonal employees. Forced to reduce its budget by 14 percent, HPD reduced its headcount by nearly 100 and reduced payments and subsidies to contracted organizations.
While overall most of the cuts have been for non-personnel items, the cumulative impact on staff levels citywide is worth noting. At the end of fiscal year 2010 the number of full-time employees was 274,061; this is 6,588 or 2.3 percent fewer than in June 2008.
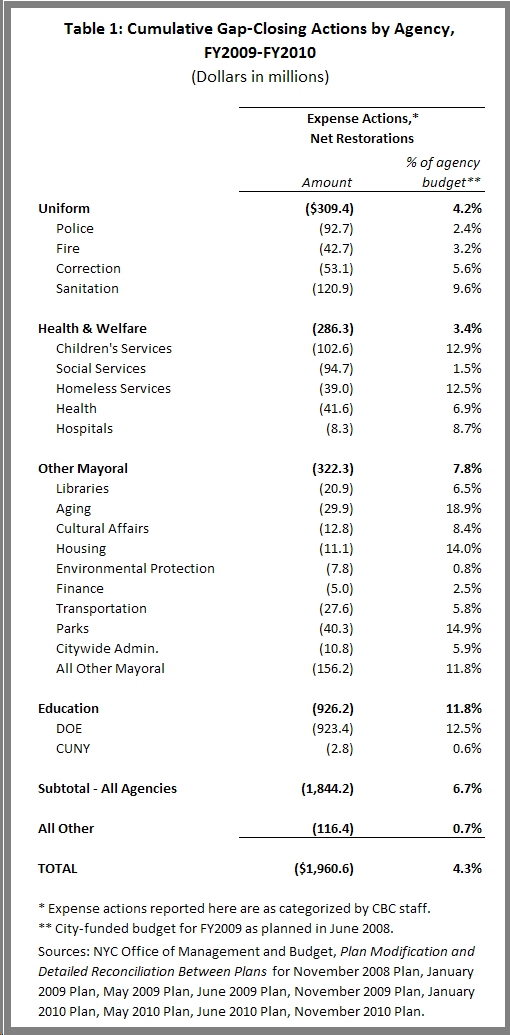
The “All Other” category in Table 1 warrants explanation and discussion. With a planned budget of almost $18 billion in fiscal year 2009, this category comprises fully 39 percent of the City’s total City-funded spending and includes debt service, pension fund contributions and other fringe benefits.[2] Despite its substantial share of total spending, this category has been cut by only $116 million or less than one percent. The limited reduction can be explained primarily by the fact that these items are not controlled directly in the budget process. Debt service is the result of previous actions to borrow for capital investments; short term savings are achieved almost exclusively from refunding debt to take advantage of lower interest rates. Fringe benefit savings accompany reductions in staffing levels in the agency budgets, but the limited role of staff cuts has meant that fringe benefit savings are also of relatively small scale. Larger savings in fringe benefits require new collective bargaining agreements with unions for health insurance benefits and/or changes in state legislation for pension benefits which are not part of the agency PEGs.
The Latest and the Next Rounds of Cuts
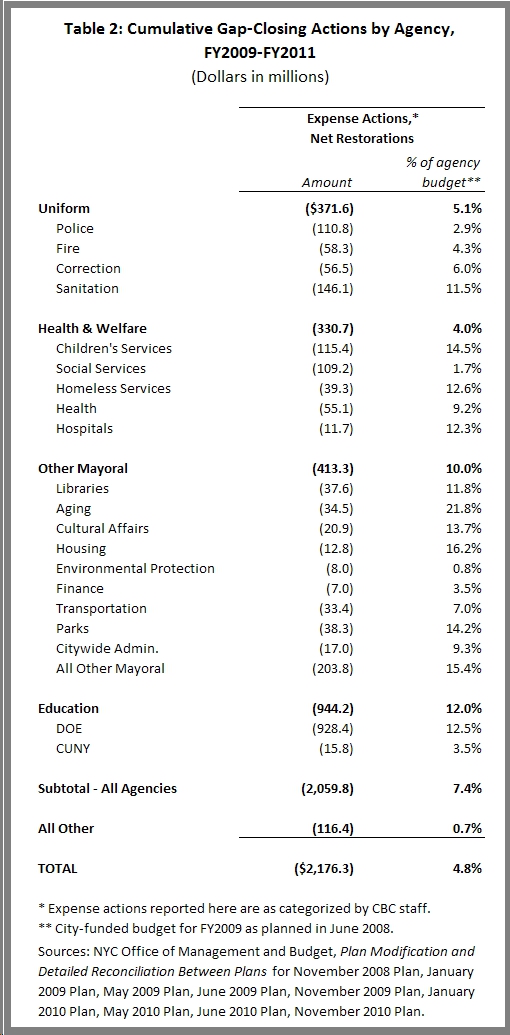
The Mayor’s proposed cuts to the current fiscal year budget released in the November 2010 Financial Plan were described in our last city budget blog. That analysis showed that the current year PEG relied heavily on new revenues and particularly on shifting staff and programs to temporary federal funds; 63 percent of the $585 million in savings in the fiscal year 2011 PEG came from revenue actions.
Table 2 adds the remaining $216 million in proposed fiscal year 2011 expense actions to the cumulative cuts from the two prior years. The data indicate that these cuts fall upon the same agencies that were hit particularly hard by the earlier cuts: the Children’s Services, Homeless Services and Sanitation departments were again obliged to lower their spending, and many of the same smaller agencies, like Libraries, Aging and Cultural Affairs, were asked to shoulder disproportionate shares of the cuts. However, not all the November actions have been implemented, and like previous PEGs the latest proposals have been subject to some restorations. On January 6 the Mayor and the City Council announced an agreement to restore about $35 million of the proposed cuts to the Fire Department, Administration for Children’s Services, Department for the Aging, Department of Youth and Community Development, and the City University.
On February 17 the Mayor is scheduled to release a new financial plan for the current and coming fiscal year. Although the local economy is faring better than the national economy and is showing notable improvements, the City still faces a $2.4 billion deficit in the next fiscal year and the outlook is made more dismal by the prospect of significant cuts in the State budget, including major categories of aid to New York City for education and other purposes. In response to these State budget cuts, it is widely anticipated that the City will have to cut billions from its spending plans.
How will the Mayor respond to these State aid losses? Based on previous rounds of cuts, the answer would be more cuts in the same areas – education, uniformed services and the smaller cultural and social service agencies.
But a preferable strategy is available. The “all other” category consisting largely of pension fund contributions and health insurance premiums should be reduced with new initiatives. Billions of dollars in savings are available from this largely untouched item in the budget, if the City’s political leaders are willing to make the effort. Unions must be willing to accept changes in collective bargaining over health benefits, and wide support must be garnered to push the State Legislature to authorize changes in future pension benefits. In his State of the City address on January 19, the Mayor announced a proposal for public employee pension reform, and details of the plan released last week offer promise for significant future savings. Perhaps February will be the beginning of a new strategy for dealing with hard times - one that spares education and other priority services from new and deeper cuts.
By Courtney Wolf
[1] There were two additional rounds of cuts made prior to the adoption of the fiscal year 2009 budget and the onset of the recession. These two gap-closing programs, totaling $1.9 billion, are not included in this analysis due to lack of comparable detail.
[2] For most agencies, expenditures for fringe benefits are allocated in the Miscellaneous budget. The biggest exception is the Department of Education (DOE), where fringe is allocated to the agency budget. Therefore any savings from fringe benefits associated with DOE headcount reductions are not included in the Miscellaneous budget (and thus not included in the “All Other” category), but instead are included in the agency’s PEG savings.