NYC Resident Feedback Survey: Community District Results
Reveal Wide "Satisfaction Gap" Between Districts
The Citizens Budget Commission (CBC) enlisted the National Research Center (NRC) to conduct a citywide resident survey in January 2017 to gauge satisfaction with municipal services and quality of life in New York City. The CBC survey was mailed to a random sample of 72,000 households, of which 9,800 adults, or 13 percent, responded.
Overall, the citywide results revealed most New Yorkers are satisfied with their neighborhoods, but less satisfied with the overall quality of life in the city: 63 percent of respondents citywide rate their neighborhoods as excellent or good places to live, while 51 percent rate the city positively. Ratings by borough hinted at the variation across the city, with Manhattan residents most satisfied overall and Bronx residents least satisfied overall.
The community district results, presented below, paint a picture of substantial variation in resident satisfaction with services and quality of life across neighborhoods in New York City.
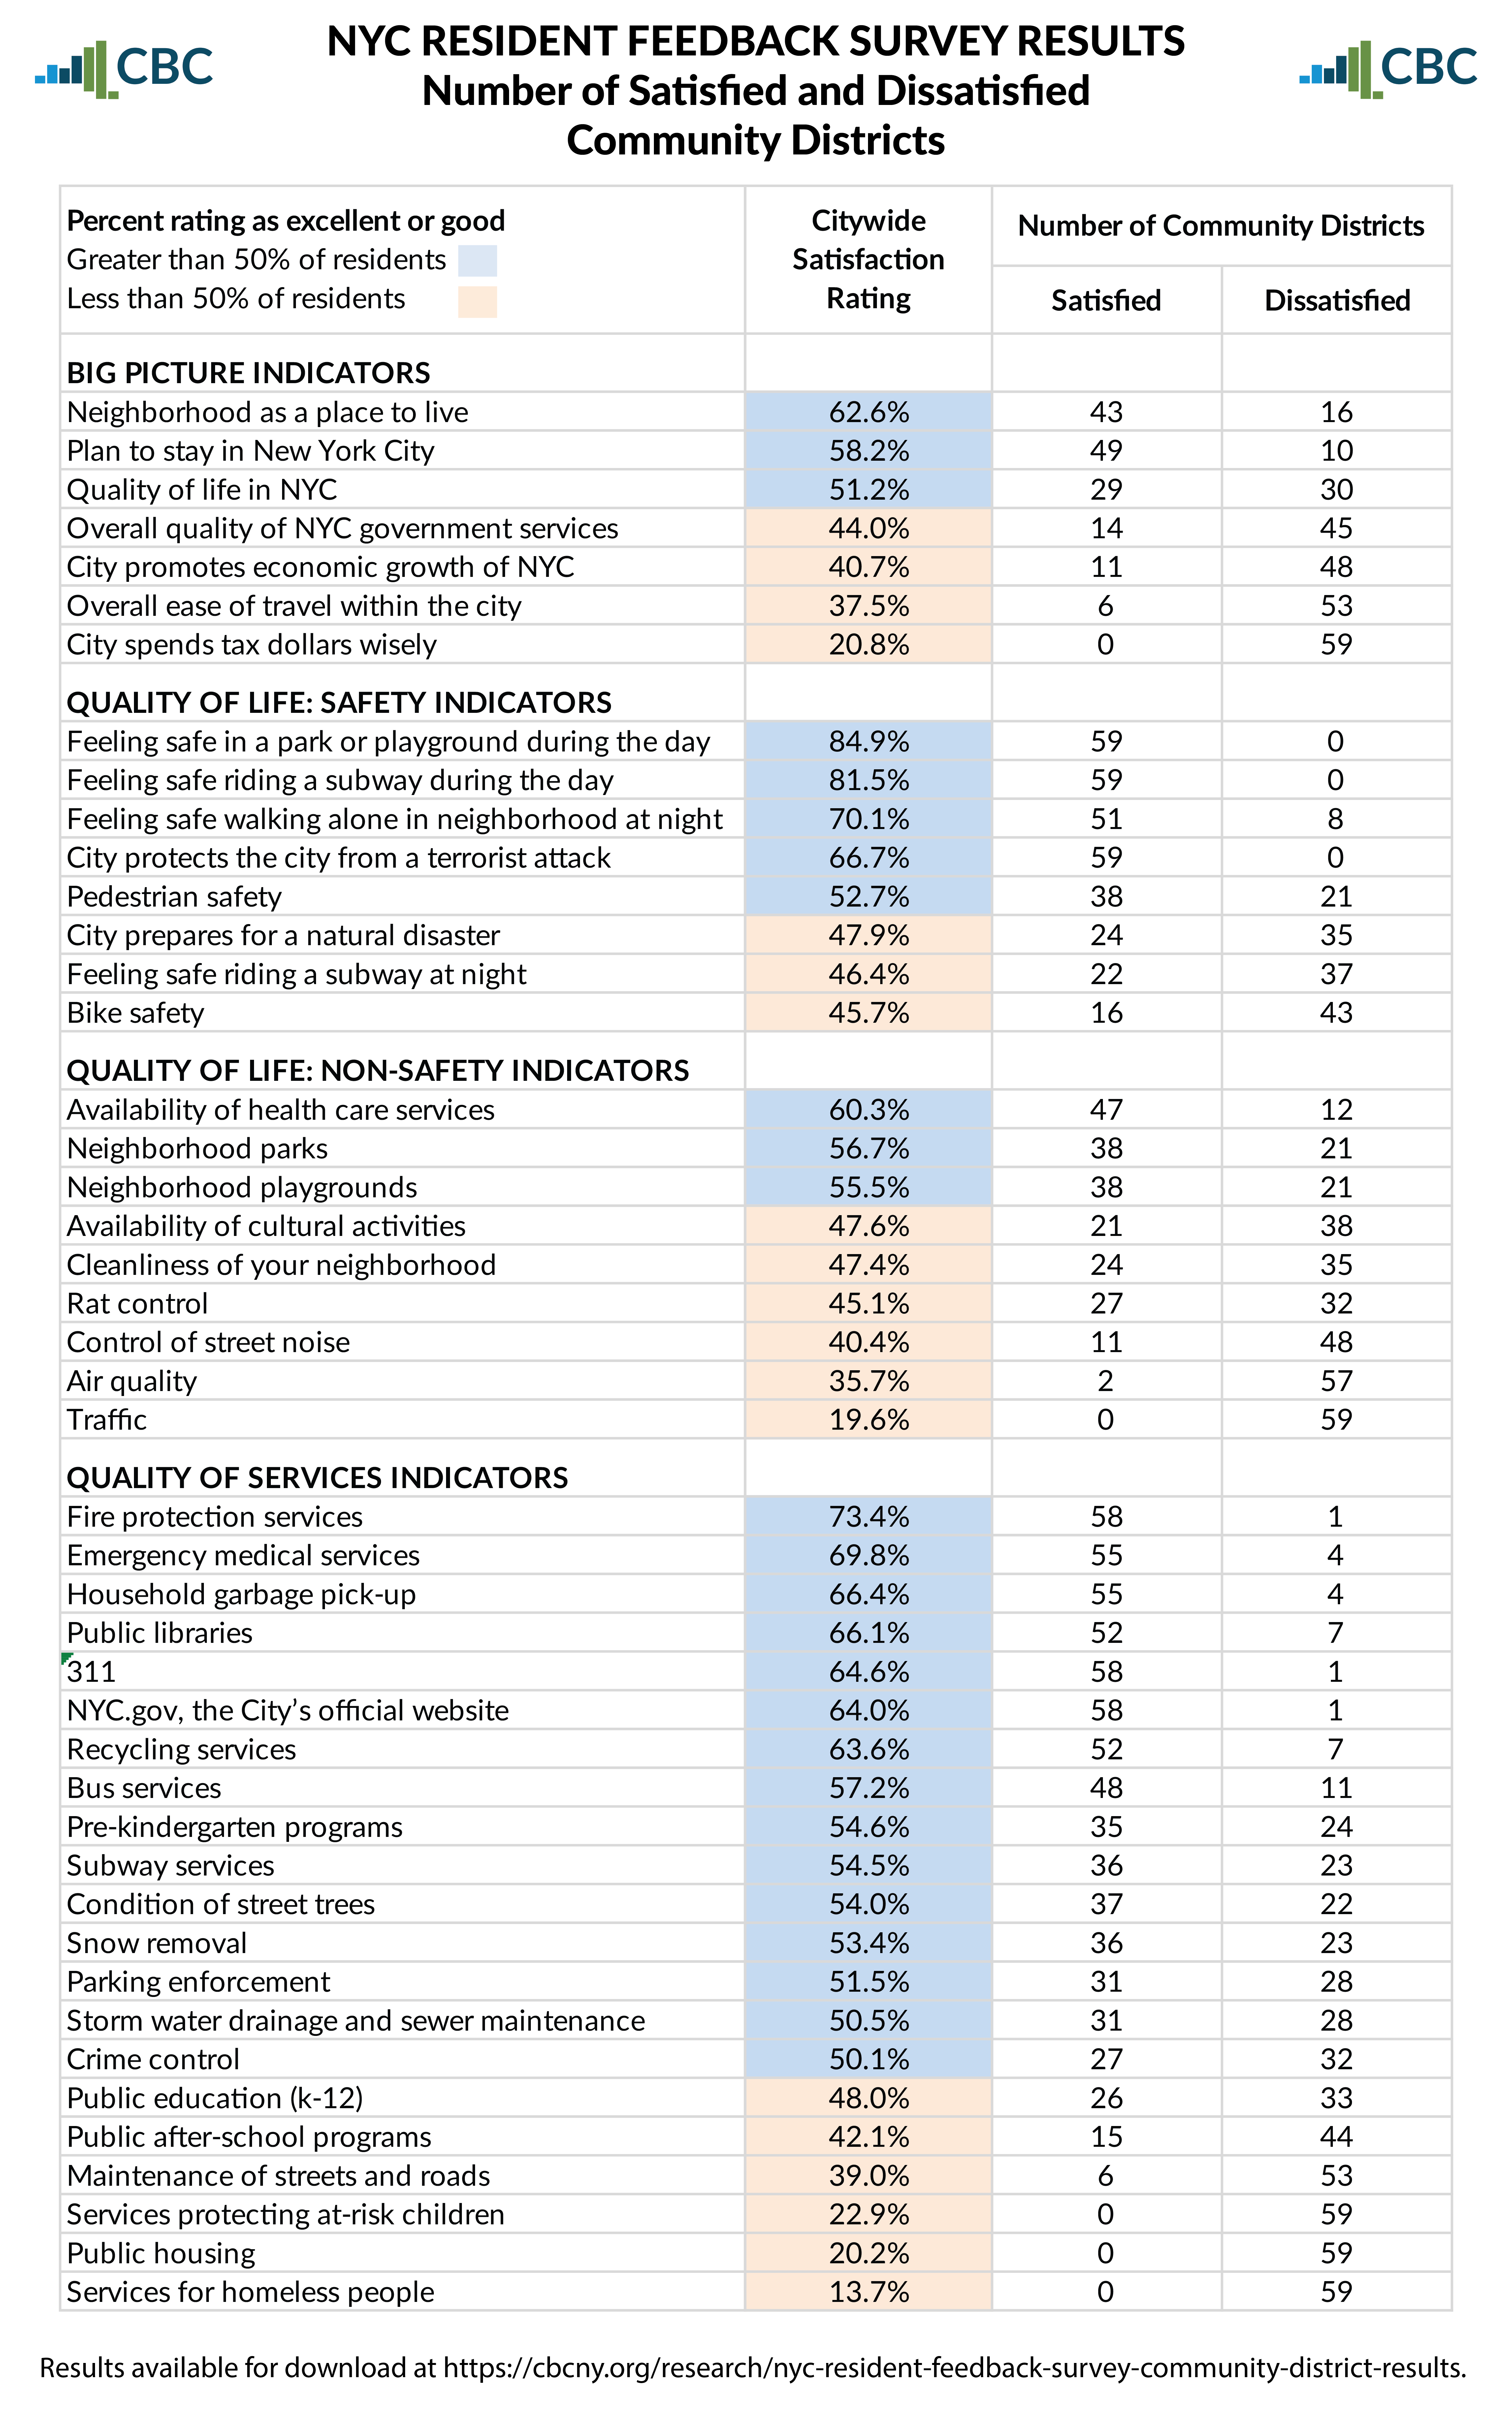
The number of satisfied and dissatisfied community districts is presented in the table below.
A majority of the city's 59 community districts are satisfied on 25 of the 45 indicators on the survey. On three indicators-- feeling safe in a park or playground during the day, feeling safe riding a subway during the day, and satisfaction with city efforts to protect the city from a terrorist attack-- a majority of residents were satisfied in all 59 community districts.
On 20 of the 45 indicators, a majority of community districts were dissatisfied. There were five indicators on which there was universal dissatisfation: city spends tax dollars wisely, traffic, services protecting at-risk children, public housing, and services for homeless people.
The results also reveal a substantial "satisfaction gap," the difference between the community districts with the highest and lowest ratings on each indicator.
The largest satisfaction gap, 73.4 percent, is in the availability of cultural activities in your neighborhood: 90.2 percent of residents are satisfied in Manhattan Community District 8 (Upper East Side) versus only 16.8 percent of residents in Brooklyn Community District 16 (Brownsville).
The satisfaction gap is also very wide on ratings for neighborhood as a place to live: 92.2 percent of residents in Manhattan Community District 7 (Upper West Side) are satisfied versus only 24.1 percent in Bronx Community District 1 (Melrose/Mott Haven), a gap of 68.1 percent. Other important indicators with similarly wide gaps include feeling safe walking alone in your neighborhood at night (gap of 63.6 percent), crime control (gap of 63.4 percent), and quality of life in New York City overall (gap of 50.3 percent).
For each indicator on the survey, the table below presents the satisfaction rating of the highest-rated community district and the lowest-rated community district, as well as the size of the satisfaction gap. (To see a map and descriptions of the neighborhoods in each community district, please refer to the Department of City Planning's website.)
Note the margin of error for community district results ranges from plus or minus 6.2% to 8.9% (for borough results it ranges from plus or minus 1.8% to 4.9% and for citywide results it is plus or minus 1.0%).

Results for each community district on each indicator are available for download below. If you would like to request the data in a machine-readable format, please contact Maria Doulis.
Download Bronx Community District Results
Bronx Community District ResultsDownload Brooklyn Community District Results
Brooklyn Community District ResultsDownload Manhattan Community District Results
Manhattan Community District ResultsDownload Queens Community District Results
Queens Community District ResultsDownload Staten Island Community District Results
Staten Island Community District ResultsSummary results from the NYC Resident Feedback Survey are available here.
For more information about the survey methodology, download the full report.
To view issues most commonly identified as requiring attention from city government, please click here.