NYS Infrastructure Policy
A Background Paper for the CBC Conference on The Most Important Fiscal and Economic Issues Facing New York State
Citizens Budget Commission engaged HR&A Advisors, Inc. to prepare a policy paper on New York State infrastructure to serve as the basis of discussion at a conference held in December 2018. To view all materials and listen to panel discussions from the conference, please visit the conference page on our website.
As the New York Works Task Force noted in its 2013 statewide capital plan, infrastructure underpins the State’s economy. New York State’s infrastructure network – highlighted by the nation’s most extensive subway system, major ports, the Erie Canal, and the New York State Thruway – has fueled the State’s position as a leader in the national and global economy. Modern and efficient infrastructure attracts jobs and residents and facilitates economic mobility.
Much of the State’s infrastructure is aging or facing obsolescence. In addition, infrastructure was often built for different population needs: parts of upstate New York have experienced significant population and economic decline while New York City continues to grow. Given these changes, an analysis of the State’s infrastructure must consider how to maintain an aging system as well as how infrastructure can best support the State’s needs today and tomorrow.
Infrastructure planning – including a transparent needs assessment, prioritization of resources to high-growth areas, and efficient project delivery – is crucial for several reasons. It supports the State’s long-term objectives of economic competitiveness and job attraction and retention. Infrastructure has a direct impact on the State’s ability to attract jobs and New Yorkers’ ability to be productive. According to the American Society of Civil Engineers (ASCE)’s 2015 report card for New York State, New York City drivers wasted 53 hours per year sitting in traffic.1 The ASCE also found that New York City airports are at or over capacity, and account for the majority of airport delays in the country.2 Infrastructure connects residents to jobs, supports the creation of new industries and innovation, and drives tourism and recreation. Infrastructure planning can also better prepare the state for future environmental challenges, building resiliency into our systems and structures.
Defining Infrastructure
The ASCE defines infrastructure as “the basic equipment and structures that are needed for a country, region, or organization to function properly.”3 To build on that definition, for the purpose of this policy paper, HR&A assessed New York State-owned and operated structures, including:
- Roads;
- Bridges;
- Transit;
- Aviation;
- Dams;
- Canals;
- Ports; and
- Telecommunications/Broadband.
This definition and the following analysis excludes social infrastructure such as schools and hospitals. HR&A analyzed publicly-available capital budgets, planning processes, and project delivery methods of the agencies and authorities that own and operate New York State’s infrastructure and conducted interviews with current and former officials within New York State government and other subject matter experts within infrastructure planning and delivery.
Current State of Infrastructure Investment
To understand the importance and magnitude of infrastructure spending in New York, HR&A assessed the proportion of infrastructure spending, and its major component entities, as compared to total capital spending within the State.
Current State Capital Spending
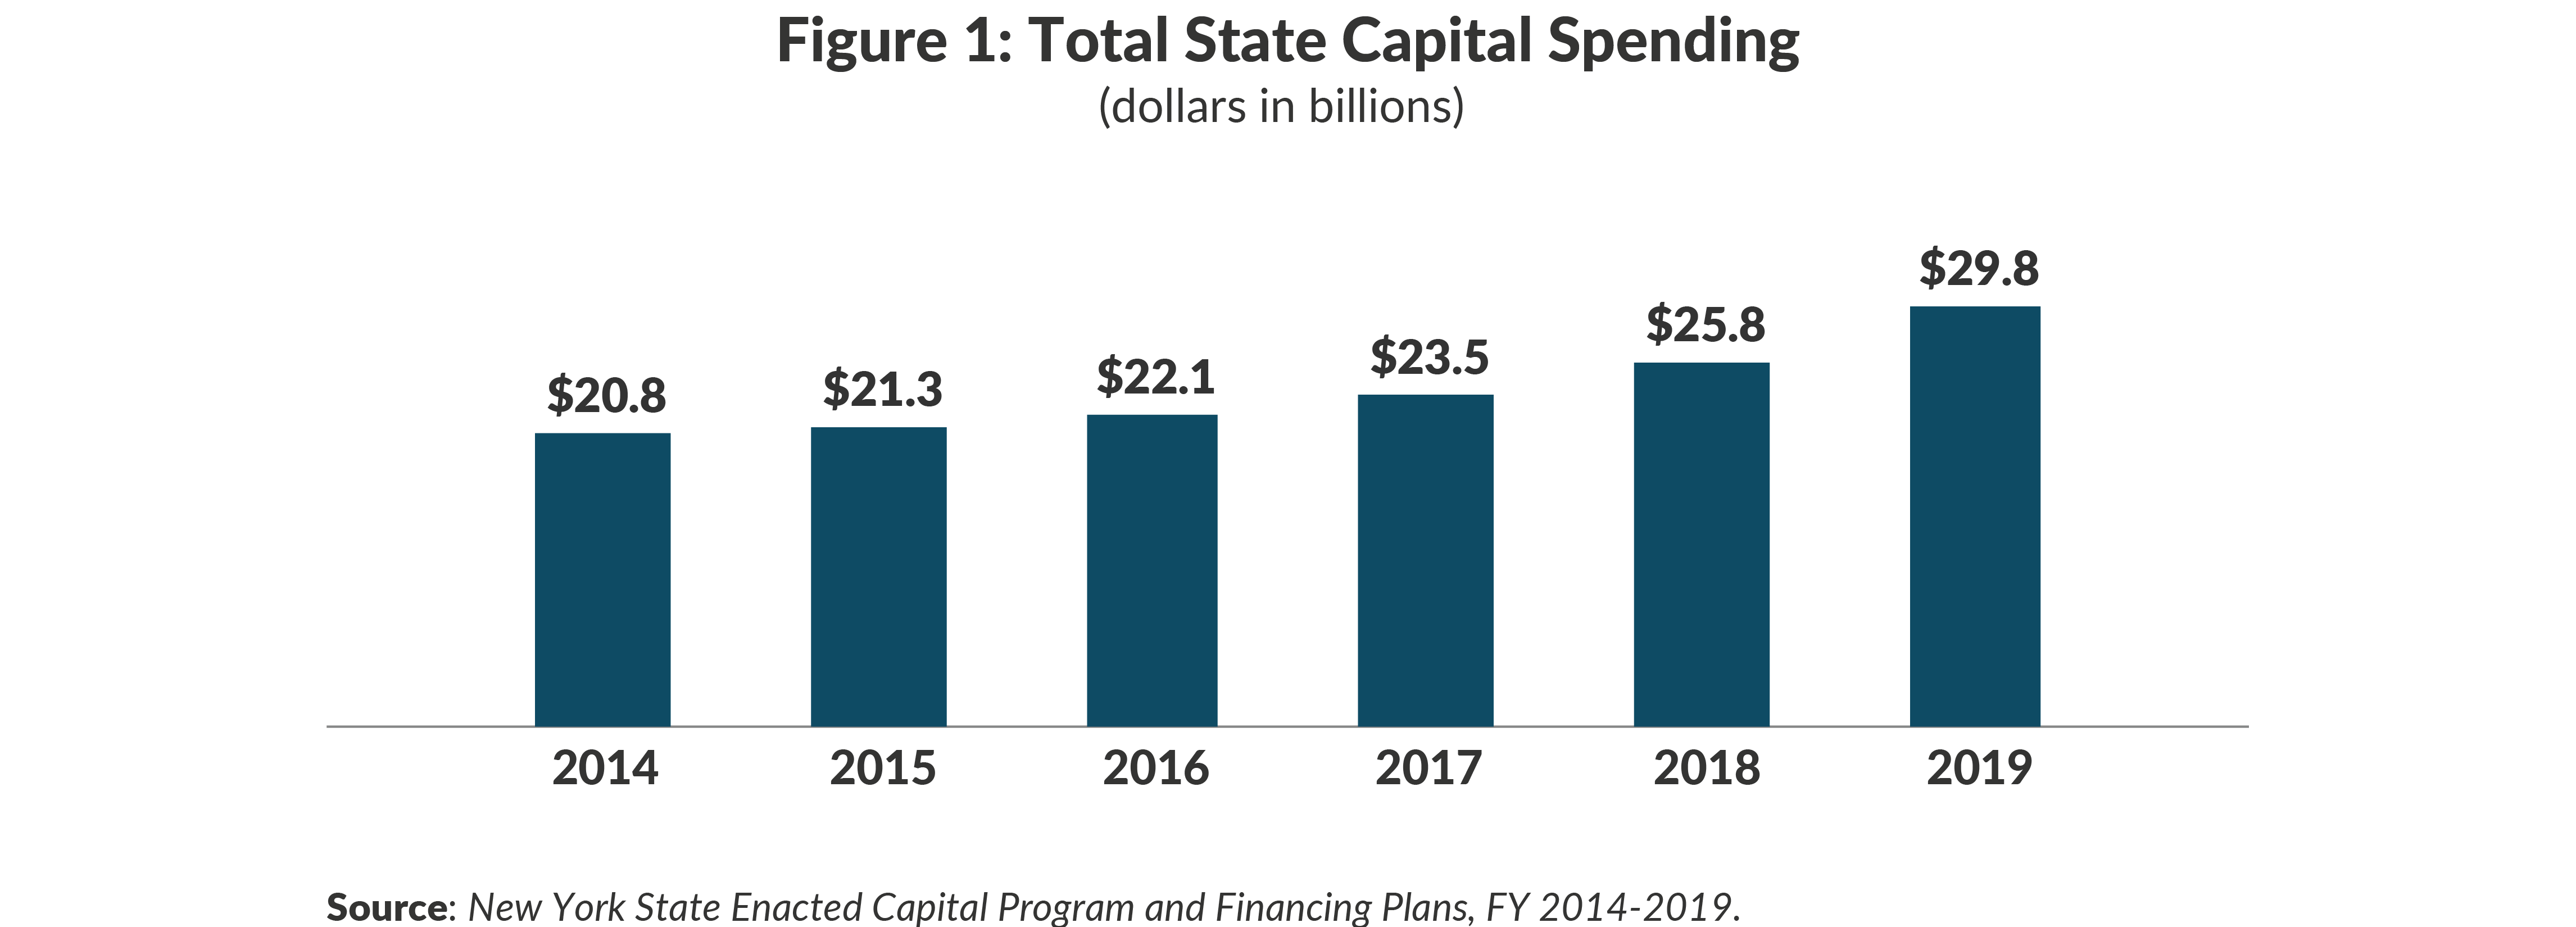
Total State capital spending in FY 2019 is projected to total $29.8 billion (Figure 1). This includes both agency and authority spending and represents the totality of spending across a variety of sectors, including education, parks and recreation, economic development, agriculture, health, and transportation. This figure has increased approximately 43% over the last five years, as State spending has surged post-Great Recession.
State Infrastructure Investment
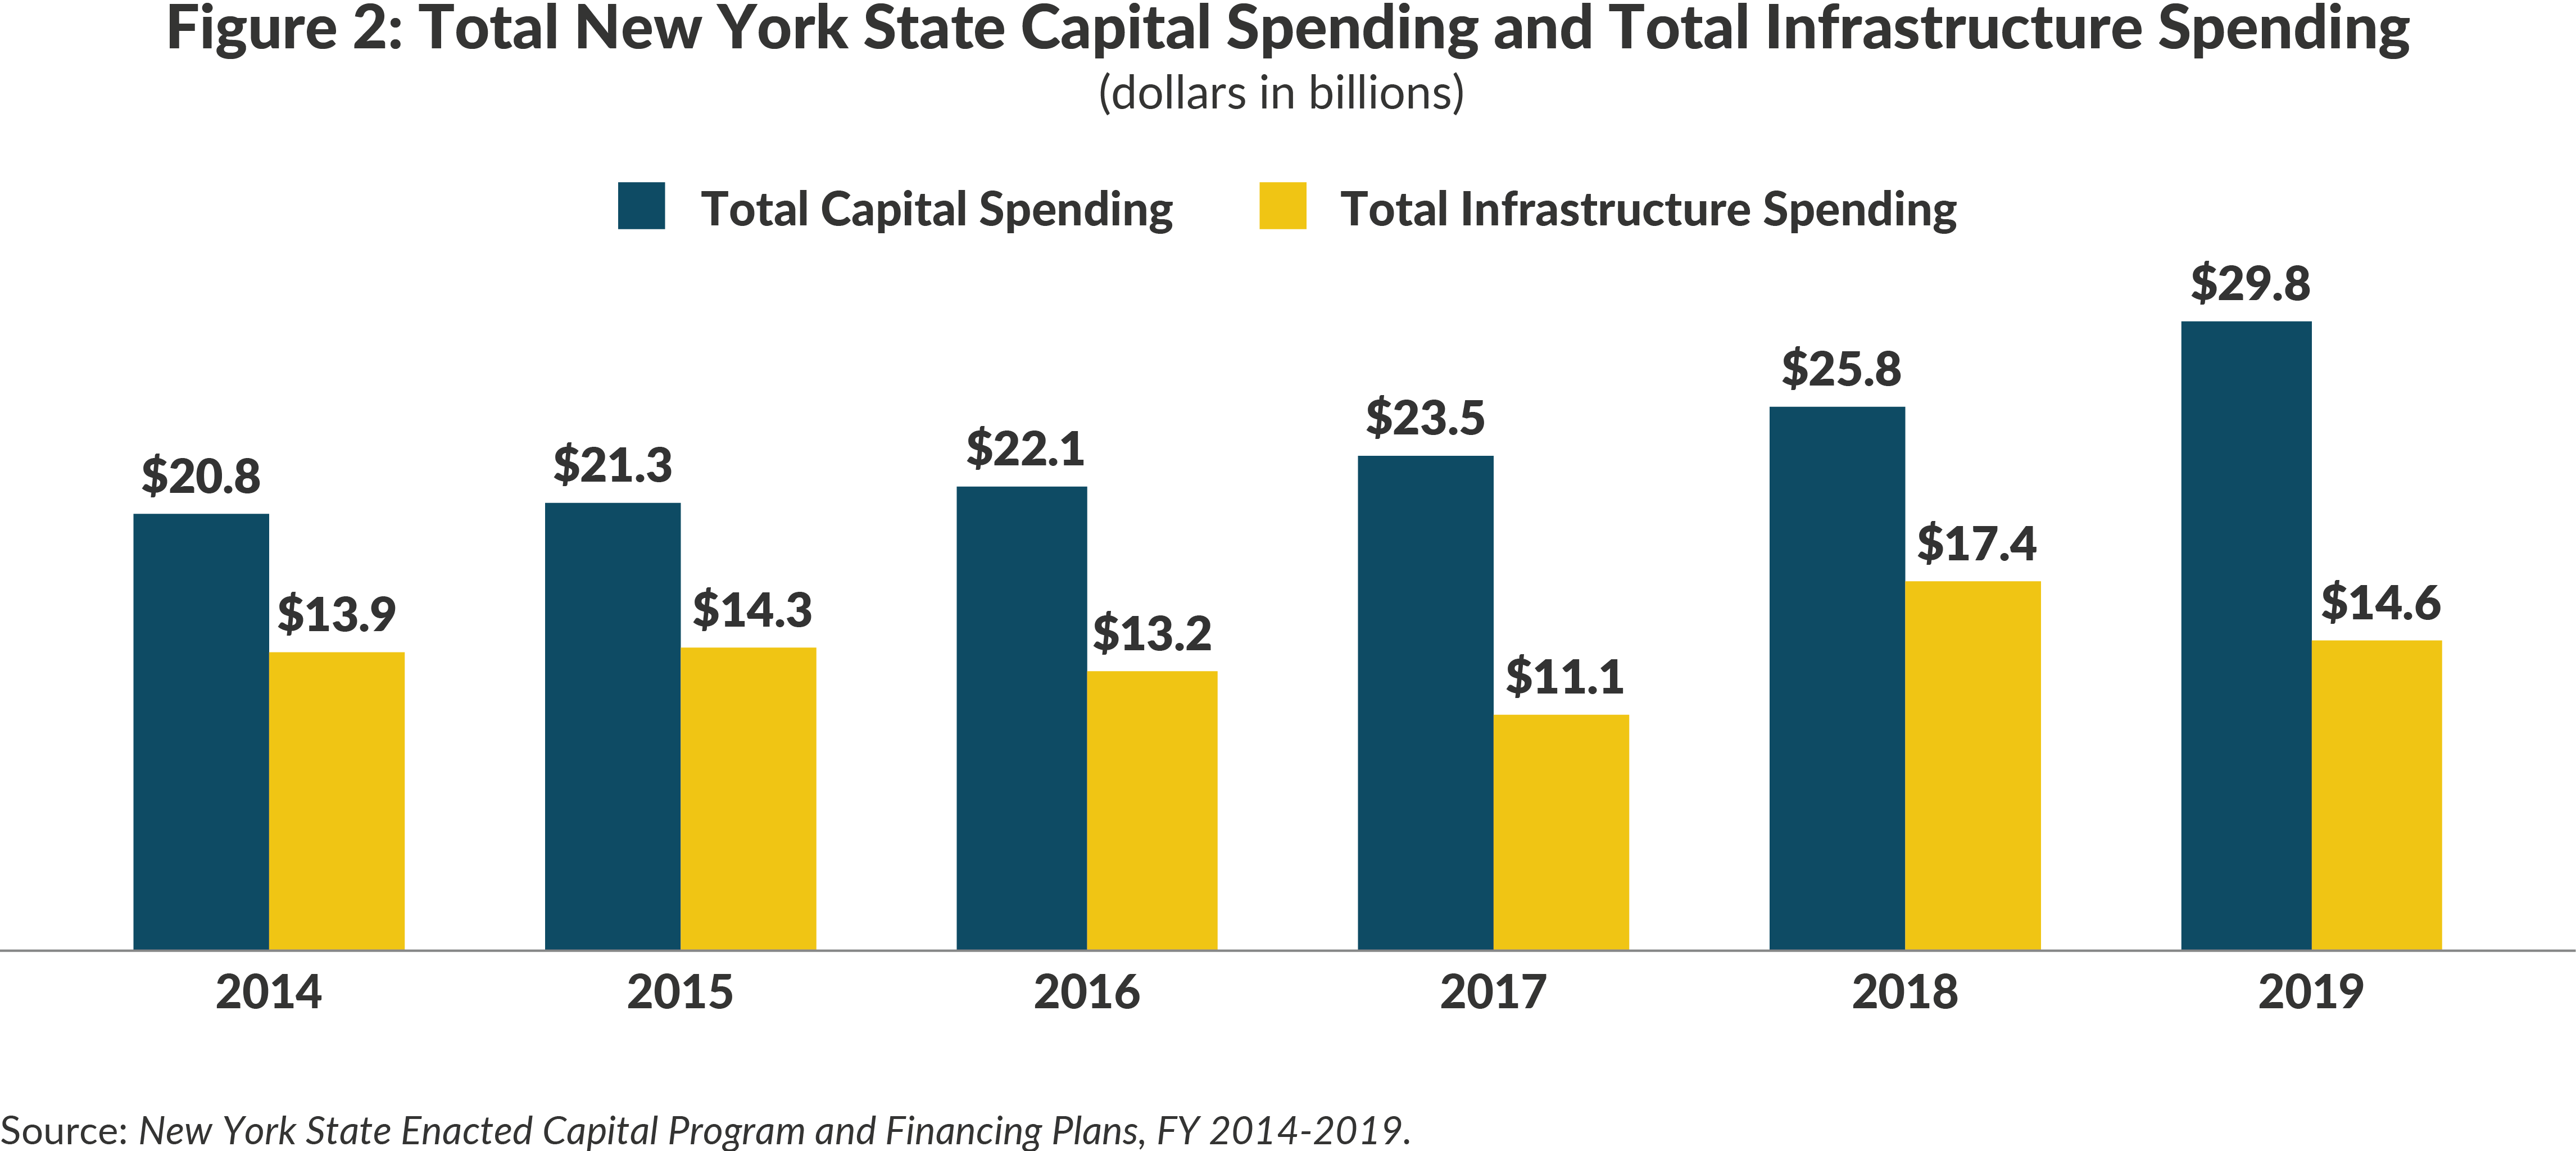
Although total capital investment has increased substantially over the last several years, the amount of investment in infrastructure has remained relatively constant. Total state capital infrastructure investment in FY 2019 totaled $14.6 billion (Figure 2). This figure includes the capital spending of the MTA, New York State Department of Transportation (“NYSDOT”), Port Authority, New York State Thruway Authority (“Thruway Authority”), Department of Environmental Conservation (“DEC”), New York State Energy Research and Development Corporation (“NYSERDA”), New York Power Authority (“NYPA”), and Long Island Power Authority (“LIPA”), as well as the Broadband Initiative of Empire State Development (“ESD”).4
Today, infrastructure spending accounts for 50% of the State’s capital spending. However, infrastructure has fallen as a percentage of total capital spending over the past six years.5 In 2014, infrastructure spending accounted for 67% of total capital spending (across both agencies and authorities). This trend is not unique to New York but points to an environment of strained funding for infrastructure at a time when state assets are most in need of significant investment.6
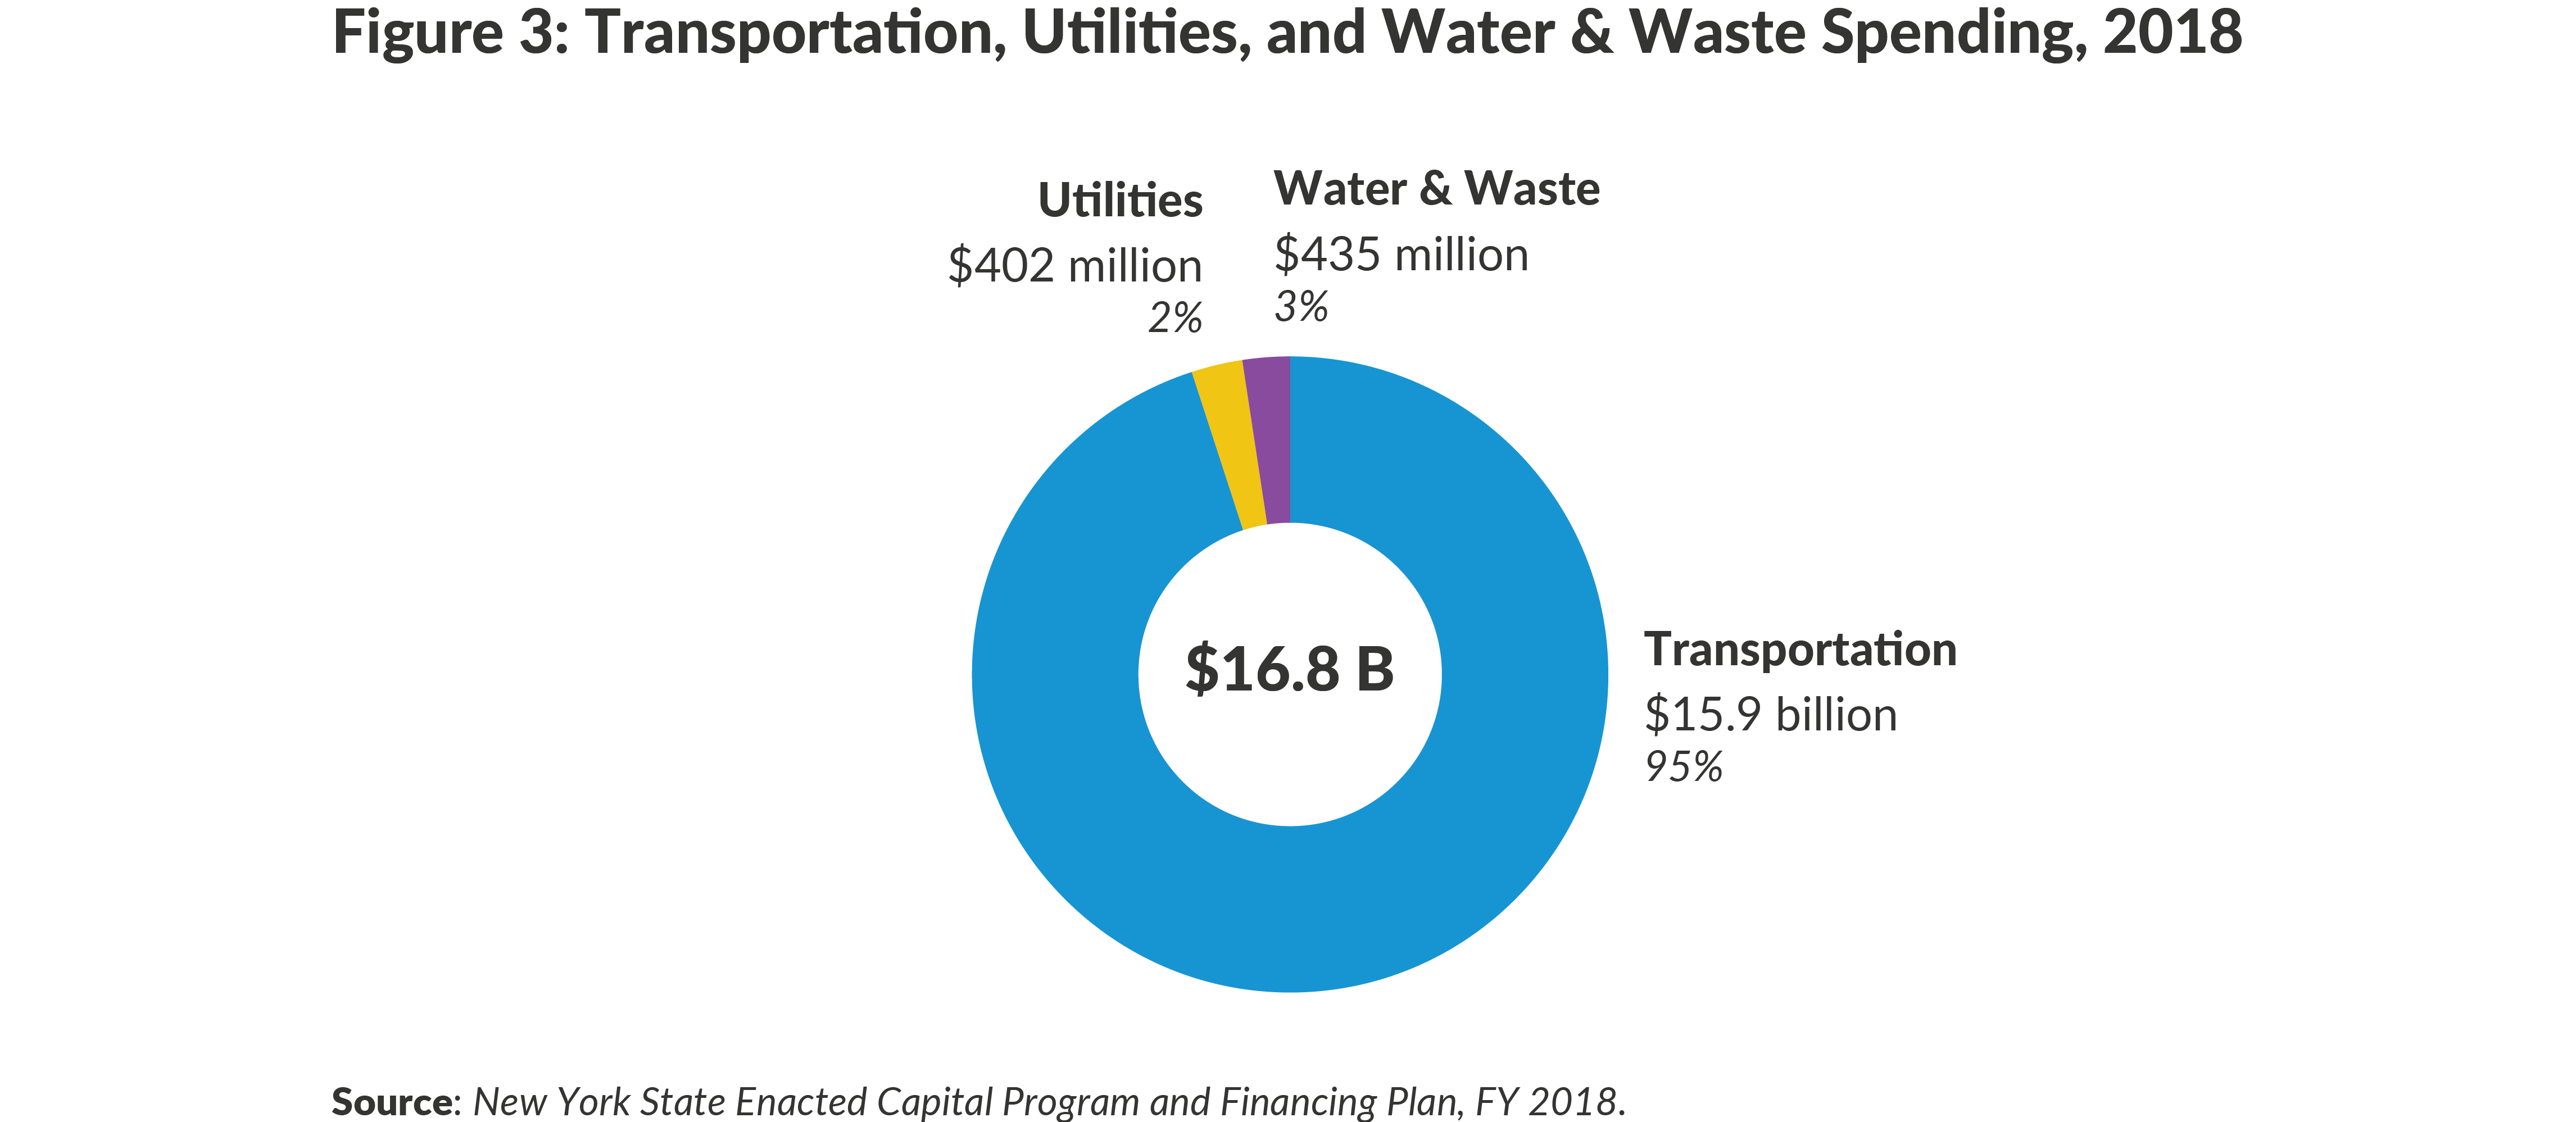
In 2018, New York State spent $16.8 billion on transportation, utilities, and water and waste management (Figure 3), accounting for the major infrastructure sectors within the State.7 Within the transportation sector, the MTA, Port Authority, Thruway Authority and NYSDOT account for $15.9 billion, or over 90% of the total infrastructure spending in the State.8
These “Big Four” entities will be the focus of the analysis within this policy paper, as they account for most of the infrastructure spending in the State and play a critical role in the day-to-day functioning of New York State.
Although transportation accounts for most of the infrastructure investment within New York, there are other important components of infrastructure investment in the State that support its economy, including broadband infrastructure, state-owned energy infrastructure, and water infrastructure. While robust data is not publicly available for these assets to allow for the same level of analysis as transportation agencies, brief descriptions can be found below and many of the recommendations of this report are applicable across all state infrastructure spending.
Telecommunications Infrastructure
Governor Cuomo’s Broadband Initiative is housed in ESD, the State’s economic development corporation, whose mission is to support the growth of New York’s economy. In 2016, the Broadband Initiative established a $500 million New NY Broadband Fund to expand broadband access throughout the state. ESD’s Broadband Program Office awards projects to bidders to deliver broadband access to unserved and underserved areas of New York State. The broadband initiative is currently in its third and final round, which focuses on rural upstate areas that are also eligible for federal telecommunications funding through the Federal Communications Commission’s Connect America Funds program, meaning both State and Federal money can be leveraged to complete broadband access.
Energy Infrastructure
The New York Power Authority (NYPA) is the largest power organization in the United States. It operates 17 generating facilities and 1,400 miles of energy transmission lines. According to their 2018-2021 projected budget, NYPA’s largest capital outlay is for programs improving energy efficiency throughout the State (43% of its capital budget).
Long Island Power Authority (LIPA) is a municipal subdivision of the State of New York. LIPA owns the electric transmission and distribution system serving Long Island and the Rockaway Peninsula, including assets, facilities, equipment, and contracts. LIPA’s capital budget is funded by federal FEMA grants and revenues from its rates and services. LIPA launched a $2.8 billion three-year infrastructure investment plan in 2017, which includes $730 million to storm harden circuits by 2019. Looking at its 2017-2018 budgets, a quarter of LIPA’s capital budget has gone towards storm hardening or ensuring the infrastructure can withstand extreme weather.
New York State Energy Research and Development Authority (NYSERDA) is a public benefit corporation whose mission is to “advance innovative energy solutions in ways that improve New York’s economy and environment” by exploring and promoting renewable energy sources. NYSERDA is responsible for several clean energy initiatives including the Combined Heat and Power Program. NYSERDA is funded by State ratepayers through the System Benefits Charge on participating utility bills.
Drinking Water and Wastewater Infrastructure
Water is the “invisible infrastructure.” While not as visible as transportation, well-functioning water and sewage systems are integral to economic growth. The New York Department of Environmental Conservation regulates and provides funding for the State’s water and wastewater infrastructure. These systems are almost exclusively owned by local municipalities, with State grants supporting modernization of these systems. The $2.5 billion Clean Water Infrastructure Act is funded through the Department of Environmental Conversation.
Condition of Major Assets
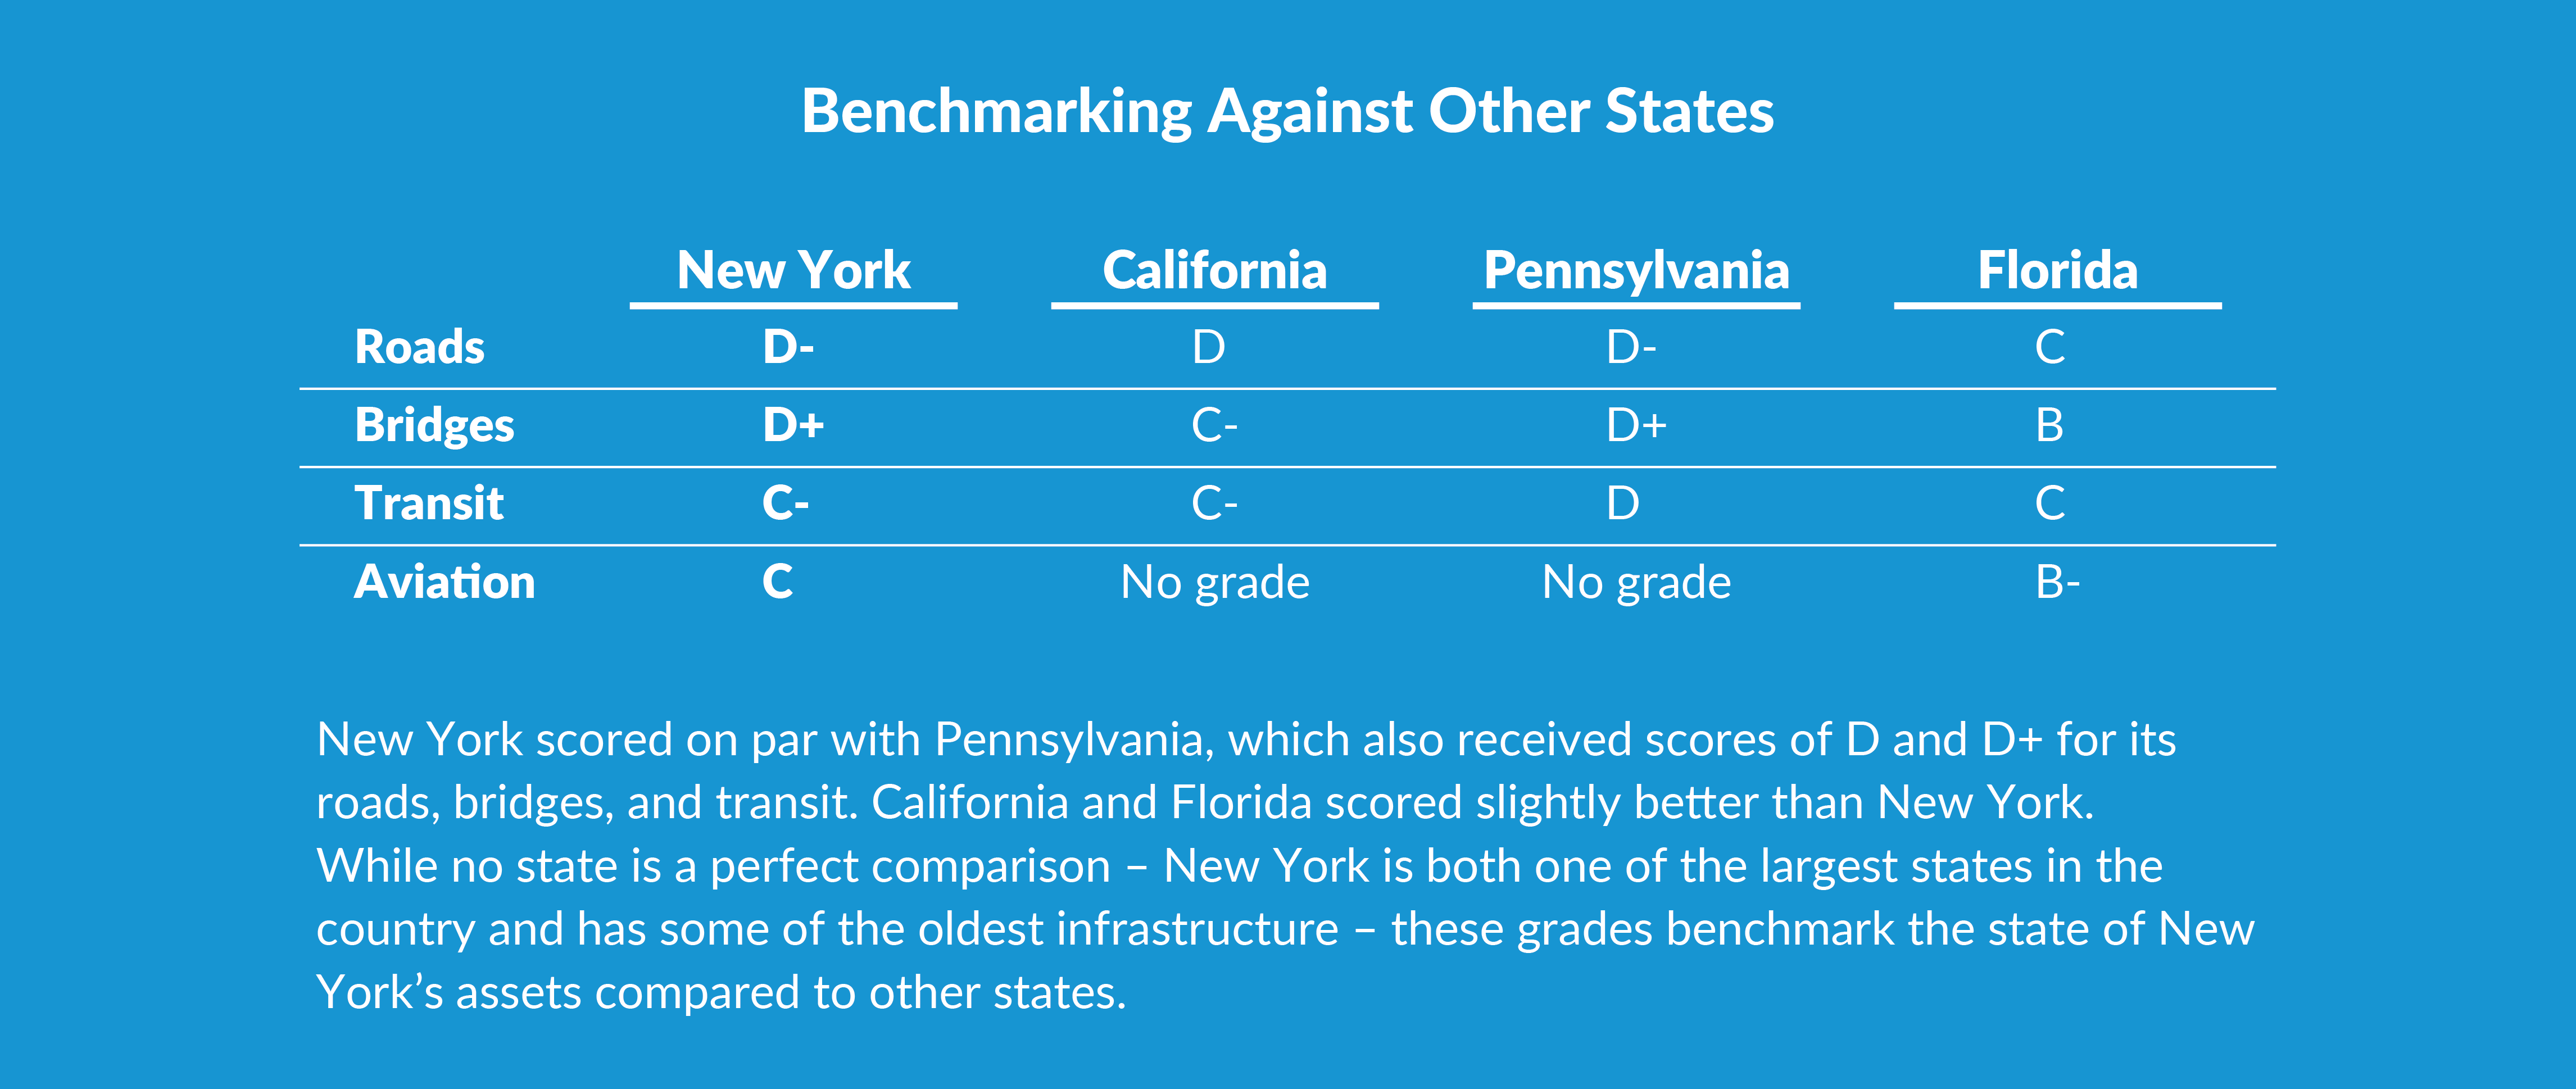
New York State’s infrastructure barely received a passing grade from the American Society of Civil Engineers in 2015. The State’s infrastructure received an overall grade of C- – only slightly better than the national average of D+.
Roads
Partially due to the availability of funding and annual assessments, the Thruway Authority often focuses on milling and other surface repairs rather than complete reconstruction. Thruway assets are one piece of a larger road network within the State. One third of the State’s roads are in fair or poor condition, and rough roads and congestion cost the state $6.3 billion annually. ASCE graded New York State’s roads D+.
Bridges
A 2018 report from the New York State Comptroller found that while the State’s bridges have improved since 2013, New York has more structurally deficient bridges than the country’s average – 8.5% in New York versus the national average of 5.3%. ASCE graded the State’s bridges D+.
Transit
The MTA’s mean distance between failure (MDBF), has decreased since 2011, indicating that fewer miles are traveled between rail and bus breakdowns. According to the 2015-2034 needs assessment, many subway cars are over 40 years old, and the dominant signaling system is over 60 years old. ASCE estimated that the MTA would require over $68 billion in investment over the next 20 years to update and maintain the system and graded the State’s transit C-.
Aviation
While the Port Authority does not have a publicly available needs assessment, ASCE estimated that $4.7 billion in investment was needed in the three NYC area airports, 75% of which for SOGR. The NYC area airports are a major contributor to national air delays. ASCE graded New York State’s aviation C.
Infrastructure Priorities and Capital Planning
Prior Statewide Planning Efforts
New York State lacks a comprehensive and coordinated capital planning process for infrastructure investment.
In May 2012, Governor Cuomo and the State legislature created the New York Works Task Force, an independent entity made up of leaders from government, labor, environmental, and planning organizations. The Task Force evaluated the state of capital planning, spending, and financing, and made recommendations for connecting capital investing with the State’s economic growth goals. In 2013, the Task Force released a 10-year statewide capital plan which identified the major capital projects of the over 50 state agencies and authorities responsible for infrastructure (including social infrastructure). The Task Force recommended an iterative seven-part process to evaluate and prioritize capital projects based on both need and economic benefit and recommended that capital planning be linked with the strategic plans of each of the 10 regions in the State.
The Task Force also recommended a series of criteria to prioritize infrastructure investment. These criteria included the ability to generate economic growth, environmental benefits, overall return on investment and lifecycle cost assessment. While certain criteria may be included in existing needs assessments or project prioritization, no formal adoption of the recommended criteria has occurred for the State’s infrastructure agencies and authorities.
While the New York Works Task Force was a clear step in the direction of a more systematic capital planning process, its statewide capital plan was more of an assessment of existing plans, projects, and priorities than a plan that conducted its own needs assessment or set priorities. The plan recommended a process agencies and authorities should use for capital planning, but those recommendations have not been implemented, nor has there been enough follow-through on its ultimate objective of cross-entity coordination. As a result, each agency or authority within supporting infrastructure investment has remained siloed in their approach towards capital planning.
Capital Planning Processes at the Big Four
Capital planning processes are not uniformly based on rigorous analysis or assessment of need, leading to plans that lack foresight and limit the ability of agencies to conduct sufficient long-term planning.
Capital planning across the State should more explicitly assess lifecycle costs and more clearly align with statewide goals of economic growth and supporting more resilient communities. State agencies and authorities often have inconsistent timelines and processes for developing capital plans, limiting the ability to coordinate across entities.
MTA
Each of the MTA’s six operating agencies (NYC Transit, Long Island Railroad, Metro-North Railroad, MTA Bus Company, Bridges and Tunnels, and Police and Security) conduct their own 20-year needs assessment of assets, with the goal of bringing all assets to a state of good repair. The 20-year needs assessment informs the development of the 5-year capital plan, which prioritizes projects based on need. The capital plan must be approved by the MTA board and then by the Capital Program Review Board.9 The MTA’s capital program dashboard displays their current capital projects, including descriptions and budgets.
The most recent 20-year capital needs assessment was conducted in 2013 for 2015-2034. The cost of investment needed was estimated to be $106 billion (in 2013 dollars), and it was noted that the actual need was higher because of SOGR backlog. That is a decrease from $128B in 2010-2029 needs assessment. Installing communications-based train control (CBTC) was listed as a priority project and had the largest cost, an estimated $15.6 billion over 20 years to continue (though not complete) installing the new signaling system. Replacing subway cars was the next-largest single cost, at an estimated $8.4 billion over 20 years.
Port Authority
The Port Authority’s 10-year capital plan is developed, in part, by an internal survey of the authority’s capital assets conducted by engineers and planners. That said, there is a lack of transparency in the selection of projects from this internal assessment in the capital plan and ultimately the projects included are based on priorities of Port Authority leadership and other political actors.
As CBC found in its 2017 report Three Ways to Improve the Port Authority’s Capital Plan, there is no publicly available needs assessment to identify assets that need to be brought to a state of good repair, and there are also no criteria to prioritize projects. Additionally, the process of aiming to achieve parity between New York and New Jersey projects has been described as “horse trading,”10 and seemingly ignores the fact that New Jersey and New York residents benefit from investment in both states.11 There is no way to track whether and how underinvestment is occurring to fully maintain and responsibly expand the Port Authority’s assets. The Port Authority’s capital plan is revisited every two years to assess changes in revenue projections and project prioritization.
Thruway Authority
The Thruway Authority uses a rolling 5-year capital program that is updated annually. The Thruway Authority’s Department of Engineering includes offices of Asset & Innovation Management and Capital Program & Contracts Management, which are responsible for inspecting assets, designing projects, and developing the capital plan. Thruway inspects and rates its roads every year and conducts a bi-annual assessment of its bridges, using a highly technical and rigorous inspection and ranking system to determine the condition of its assets. The assessment then informs Thruway’s rolling 5-year capital program, which is updated with each year’s budget and annual report. Projects are prioritized by need, though funding availability, safety, and traffic volume are also considered. A dashboard of the condition of roads and bridges is available on Thruway’s website and is updated annually. As the Office of the State Comptroller found in 2016, Thruway does not have a true long-term capital planning process.12 The rolling five-year plan allows for flexibility and course correction, but should be complimented by a longer-term needs assessment, similar to the one conducted by the MTA.
Department of Transportation
The Department of Transportation conducted a 2010-2030 needs assessment in 2007 for all transportation in the State, including assets not under DOT control. It makes the case for the importance of a functioning transportation system (safety, job creation and economic competitiveness, tourism and recreation, energy efficiency), and acknowledges that reversing current trends will take time, as current State and Federal funds are insufficient to meet the needs of our aging infrastructure. The plan advocates a framework of economic competitiveness, cost-effective strategies, energy efficiency, and creating a network that provides choice for moving people/goods. The estimated cost of projects for the 20-year period (excluding Port Authority and some MTA) was $172.2 billion (in 2007 dollars). Major projects identified included the Tappan Zee Bridge and the Kosciuszko Bridge, which are complete or nearing completion. A needs assessment was performed in 2012 but has not been published for public review and consumption.
In contrast to the authorities that support State infrastructure, the Department of Transportation’s capital planning process is even less transparent. As CBC has described in their report Bumpy Road: Transportation Capital Planning in New York State, the DOT’s 2016-2020 capital plan was outlined as part of an agreement negotiated by the Governor’s Office and leaders of the State Assembly and Senate, and was released after the 2016 and 2017 budgets were enacted. The capital program does not clearly indicate criteria for project inclusion nor does it reflect the Department’s needs assessment. This lack of transparency prevents a full accounting of the Department’s planning efforts.
Current State Infrastructure Priorities
Although the New York Works Task Force articulated a series of proposed criteria for prioritizing infrastructure investment, many of the State’s current priorities are responses to crises or developed ad hoc. The following priority projects were identified based on announced or enacted spending in the State capital budget and statements from the Governor’s office.
Gov. Mario M. Cuomo Bridge (Tappan Zee Bridge/New NY Bridge)
The Tappan Zee Bridge, a vital New York City region crossing, was intended to last about 50 years. After outliving its intended useful life by over eight years, the Thruway Authority began building a replacement bridge, now called the Gov. Mario M. Cuomo Bridge (previously referred to as the New NY Bridge or the New Tappan Zee Bridge). The construction of the Gov. Mario M. Cuomo Bridge and the deconstruction of the Tappan Zee Bridge is projected to cost $4 billion. New York State budgeted $1.1billion to support the project.13 The remaining amount was financed through Thruway bonds and a $1.6 billion Federal Transportation Infrastructure Finance and Innovation Act (TIFIA) loan.14
Airport modernization and expansion
New York airports have been plagued with problems for over a decade. The New York Times describes JFK Airport as “a string of disjointed terminals. One of every four flights delayed. Aggravatingly long security lines. Brutal slogs through traffic just to reach the airport.15” Meanwhile, LaGuardia Airport “has the dubious distinction of being the only major East Coast airport without a rail link,” according to Port Authority Executive Director Rick Cotton.16 The Governor’s Airport Advisory Panel has made several recommendations for modernizing and increasing the capacity of New York airports, including:
- JFK terminal modernization: $13 billion to create two new international terminals
- JFK Master Plan: $1.5 billion through the DOT to improve the roadways leading to JFK and increase access to mass transit
- LaGuardia renovations: $8 billion renovation, including AirTrain access
- Stewart Airport expansion: $30 million for a permanent Customs and Border Protection Facility to increase the Hudson Valley airport’s ability to process international flights
- MacArthur Airport expansion: The Islip, Long Island airport received a $14.28 million Federal Aviation Administration grant to expand its runway.
- Upstate Airport Revitalization: In 2016, the Department of Transportation launched the Upstate Airport Economic Development and Revitalization Competition to encourage investment in upstate airports. Grants awarded through this initiative have included $22 million to modernize Albany International Airport, and $14.2 million to expand Ithaca Tompkins Regional Airport.
Expansion and modernization of the MTA
- Fast Forward: In late May 2018, the MTA released the Fast Forward Plan, a plan to deliver capital improvements on an accelerated timeline. The plan is estimated to cost $40 billion and projects and programs within the Plan overlap significantly with the latest MTA Capital Plan. The Plan lacks a clear funding approach.
- In response to a train derailment and record-low performance levels, Governor Cuomo declared a state of emergency for New York City’s subway system in June 2017. The State has pledged $418 million for Phase 1 of the MTA Subway Action Plan (New York City is providing the other half of the overall $836 million program).
Trans-Hudson capacity
Several projects are underway to increase capacity across the Hudson River, including:
- Gateway Program: The Gateway Program is the expansion and renovation of a section of the Northeast Corridor that connects Newark and New York’s Penn Station. The aging tunnels were severely damaged by Superstorm Sandy. The project is being managed by Gateway Program Development Corporation with support from PANYNJ and is expected to cost $30 billion.17
- Penn Station/ Empire Station Complex: In 2016, Governor Cuomo announced plans to renovate the aging Penn Station and turn the Farley Post Office Building into a train hall to increase LIRR and Amtrak capacity. The Farley Building will also contain retail and office space. The combined plans, called the Empire Station Complex, is underway and will provide 700,000 square feet of retail and office space, and as well as a more comfortable and pleasant commuting experience for passengers who use Penn Station. The project is expected to cost $1.6 billion and is funded by New York State ($550 million), Amtrak, which owns Penn Station ($420 million), and developers Related Companies and Vornado ($630 million towards the project in exchange for a 99-year-lease on the building).18 19
- Port Authority Bus Terminal: The Port Authority Bus Terminal is over capacity and the number of passengers traveling through the facility is expected to increase by 35% by 2040. The Port Authority’s capital plan includes $3.5 billion in funding for planning a new facility, including an environmental review, public outreach, design, permitting, and construction. The capital plan also includes $328 million for an interim renovation program.
Long Island Rail Road Main Line Corridor Third Track
The Third Track project adds a third track to the Long Island Rail Road’s main line corridor, increasing capacity and providing more reliable service during disruptions. The project is expected to cost $2.6 billion.
Broadband Initiative
The SFY 2016 capital plan established a $500 million NY Broadband Fund. Managed by Empire State Development, the broadband initiative seeks to implement broadband throughout the State by 2018.
Clean Water Infrastructure
In April 2017, Governor Cuomo signed the Clean Water Infrastructure Act, which invest $2.5 billion in drinking water, wastewater, and water protection infrastructure across New York State. Funding from the Clean Water Infrastructure Act is primarily allocated through the Environmental Facilities Corporation. The act includes:
- $1 billion for the New York State Water Infrastructure Improvement Act of 2017 to assist municipalities with water quality improvement projects
- $150 million in grants for intermunicipal water quality infrastructure projects
Best Practices in Planning: Integrated Approaches
California: Five Year Infrastructure Plan
Since 1999, the California Infrastructure Planning Act has mandated that the Governor submit to the legislature a 5-year infrastructure plan, updated annually on a rolling basis, along with the annual budget. This plan, which includes transportation, water management, school and jail construction, as well as parkland funding, is a blueprint for overall state-directed infrastructure funding. The plan is produced by the Office of the Governor and submitted every year to the state legislature. The 2018 plan proposes $61.3 billion in infrastructure investments over the next five years, over 93% of which is devoted to transportation. The plan outlines statewide priorities such as integrating climate change and resiliency into planning, quantifies unmet deferred maintenance by department/entity, and provides an annual update on debt management.
New York City: PlaNYC/OneNYC
PlaNYC, New York City’s strategic plan to address population growth, climate change, and quality of life, incorporated both city-owned and non-city owned assets into its analysis and reinforced the importance of regional coordination. PlaNYC was first published in 2007 and has been succeeded by OneNYC. The 20-year plan is updated every four years by the Mayor’s Office of Sustainability, established to create, update, monitor and report on delivery against the plan. The Mayor’s Office of Recovery and Resiliency shares responsibility for plan implementation.
Infrastructure Funding and Financing
There is a need for infrastructure investing strategies and funding sources that will last not just through the next ten to twenty years, but beyond. Current capital investment is not sufficient to meet current ongoing projects or future needs. The MTA’s Fast Forward Plan (estimated cost: $40 billion), the Gateway Program (estimated program cost: $30 billion), and the replacement or rebuilding of the Port Authority Bus Terminal (estimated funding gap: $6.5 billion) are some of the many projects or programs identified that lack secured funding. Funding currently identified New York State infrastructure needs will likely cost at least $100 billion over available funding levels.
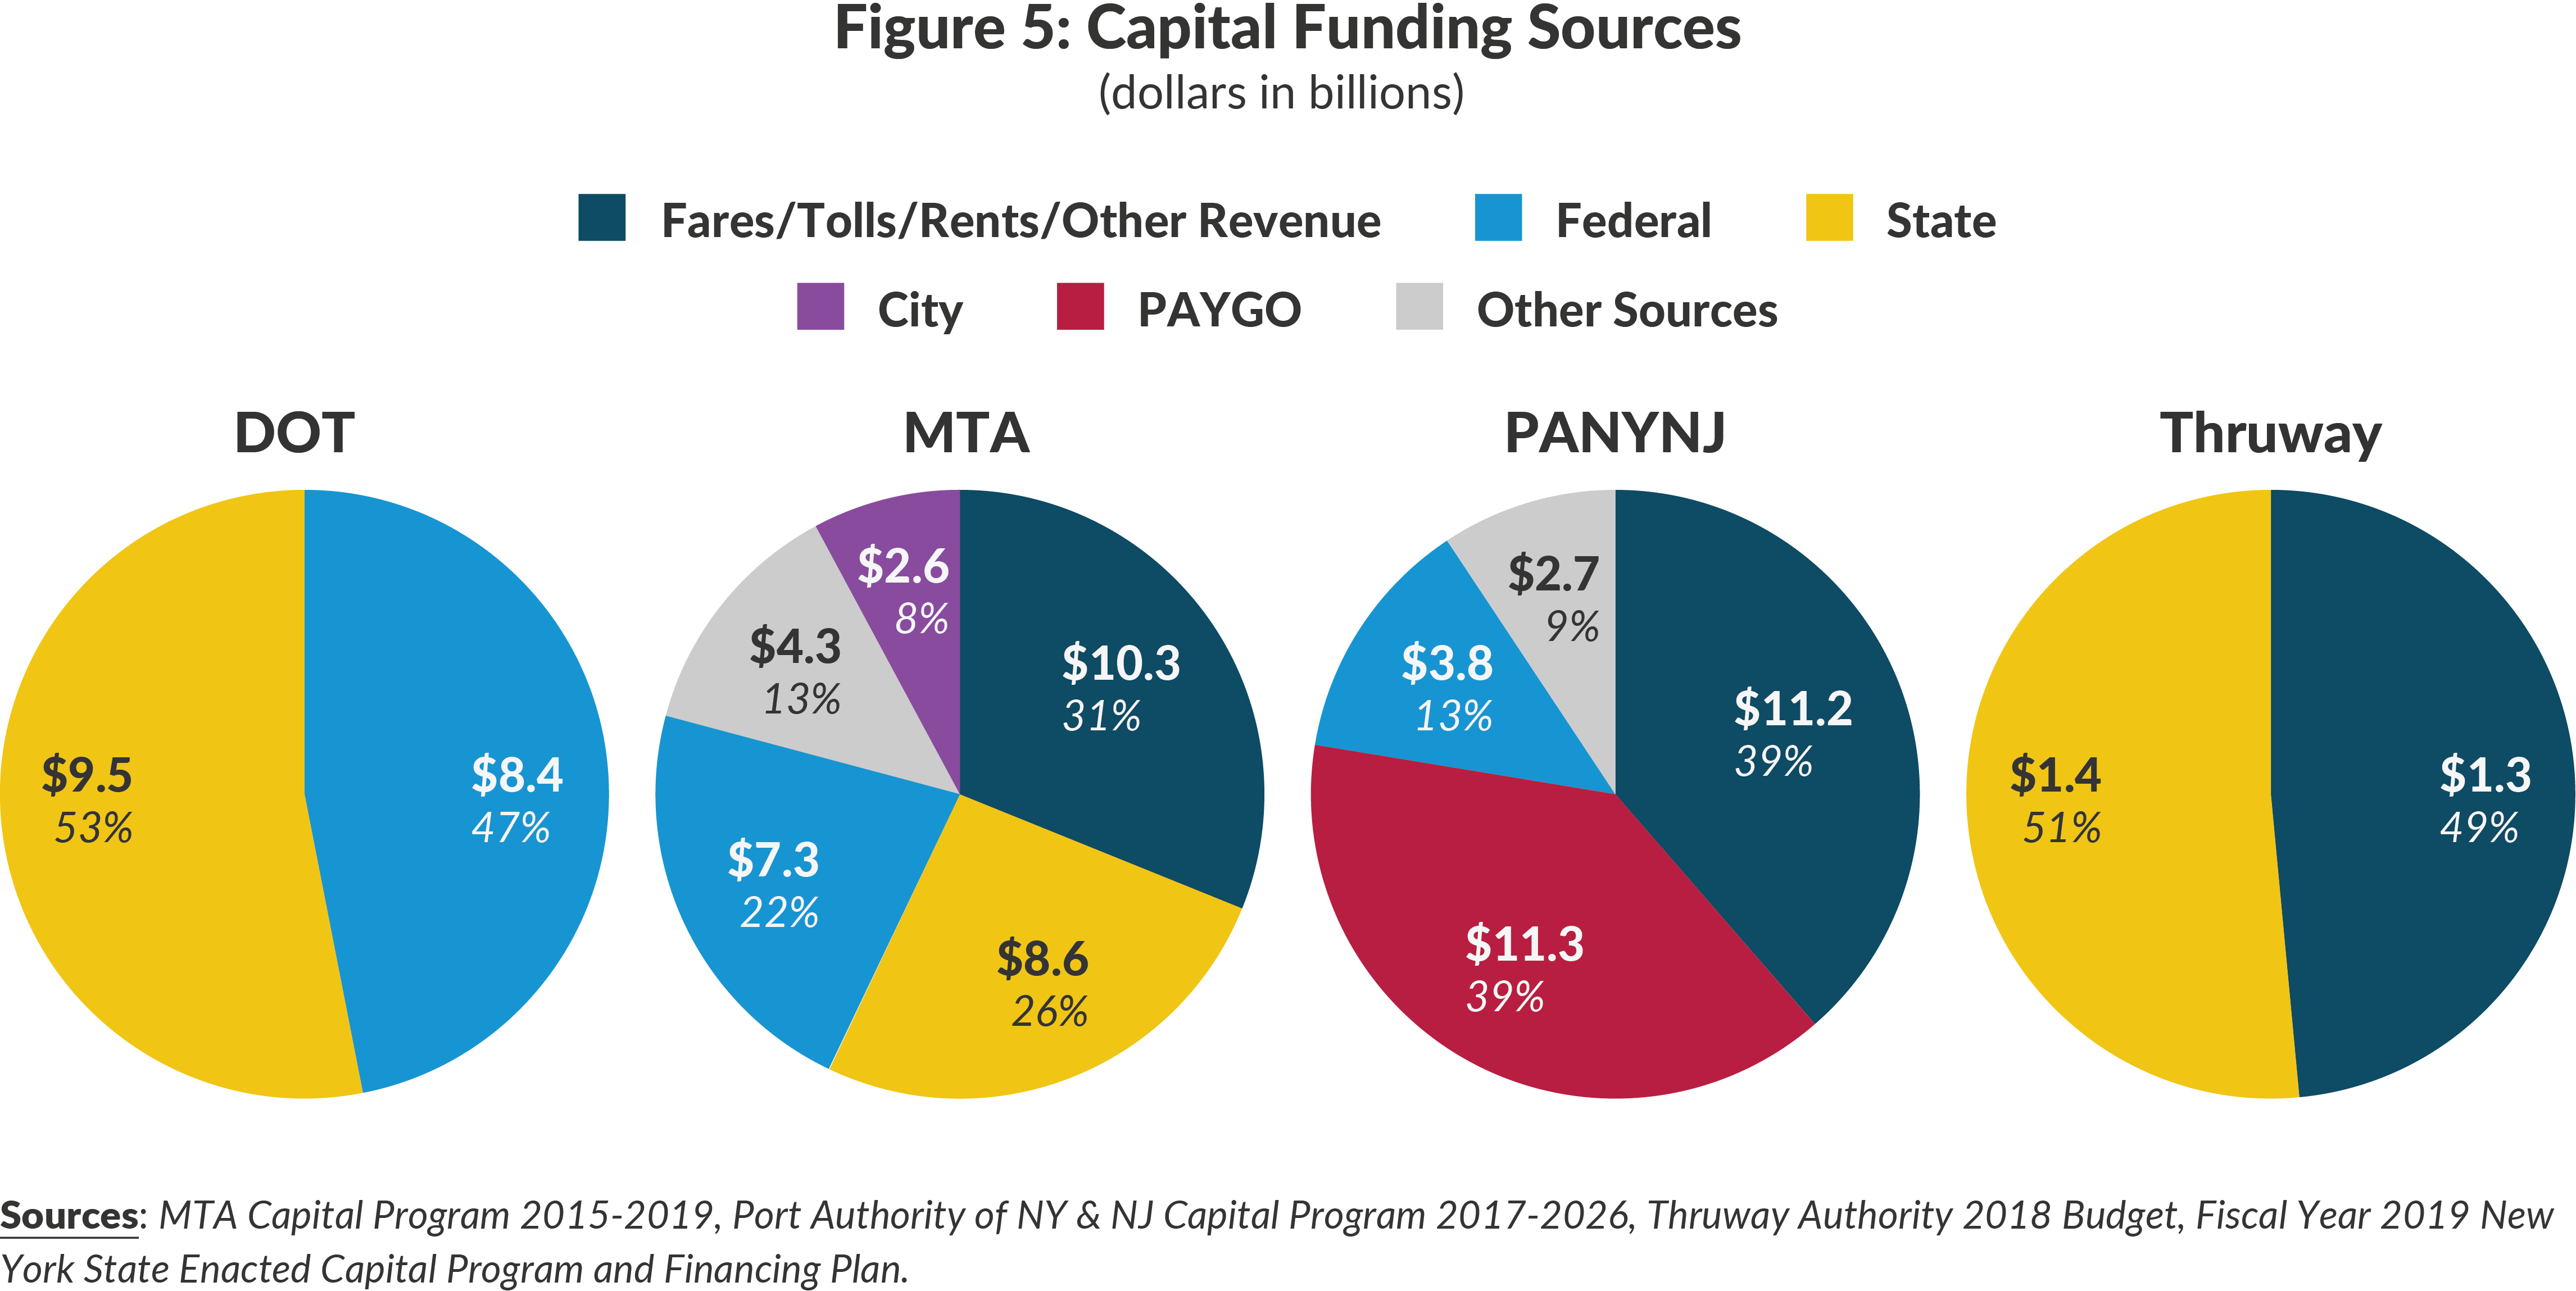
Funding for New York State infrastructure is derived from a variety of sources but most of the Big Four’s funding comes from a combination of Federal grants, direct state capital support, and user fees including tolls, fares, and rent. With a changing funding landscape for certain federal programs and potential variability in user fees, the current funding picture points to a need to explore new funding sources in the future. Additionally, State and authority debt is growing, limiting the ability to finance critical projects.
Federal Sources
Federal funding comes in the form of grants, including grants from the Federal Transit Administration’s (FTA) New Starts program, Federal Highway Administration, and more recently from the American Recovery and Reinvestment Act. Additional funding is also available from the Federal Emergency Management Administration for storm recovery and resilience.
Several high-profile projects within the MTA and Port Authority are funded through federal grants supported by the FTA’s New Starts program. This program has been proposed to be eliminated by the current presidential administration. Overall, federal grants support approximately 20% of these authorities’ capital budget. However, federal funding can vary widely: it made up 31% of the MTA’s 2005-2009 capital plan ($6.5 billion), 48% of the authority’s 2010-2014 capital plan ($6.6 billion), and currently makes up just 21% of the 2015-2019 plan ($7.3 billion). While these numbers are not declining on an absolute basis, they provide a decreasing proportion of our State’s capital funding needs for transportation. This relative decline in federal funding, and uncertainty with future viability and funding levels for programs like New Starts, could have significant implications of the ability of infrastructure entities to keep their assets maintained and to expand their networks.
The Department of Transportation utilizes federal funding for a much greater portion of its capital investment, with 47% of its capital funding in SFY 2019 coming from federal programs through the Federal Highway Administration.
State Sources
State funding for infrastructure investment comes from direct state support, and through tax revenues including the gas tax.
Gas Tax
While New York has one of the highest gas taxes in the US at $0.45 per gallon, the money raised by the gas tax does not necessarily go towards infrastructure, and the revenue available from this source has plateaued. A 2014 report by the State Comptroller found that in FY 2012-2013, 40% of money collected by the tax went to State operations expenses. 37% went to debt services (State capital program bonds and CHIPS bonds), and only 22% went to capital construction.
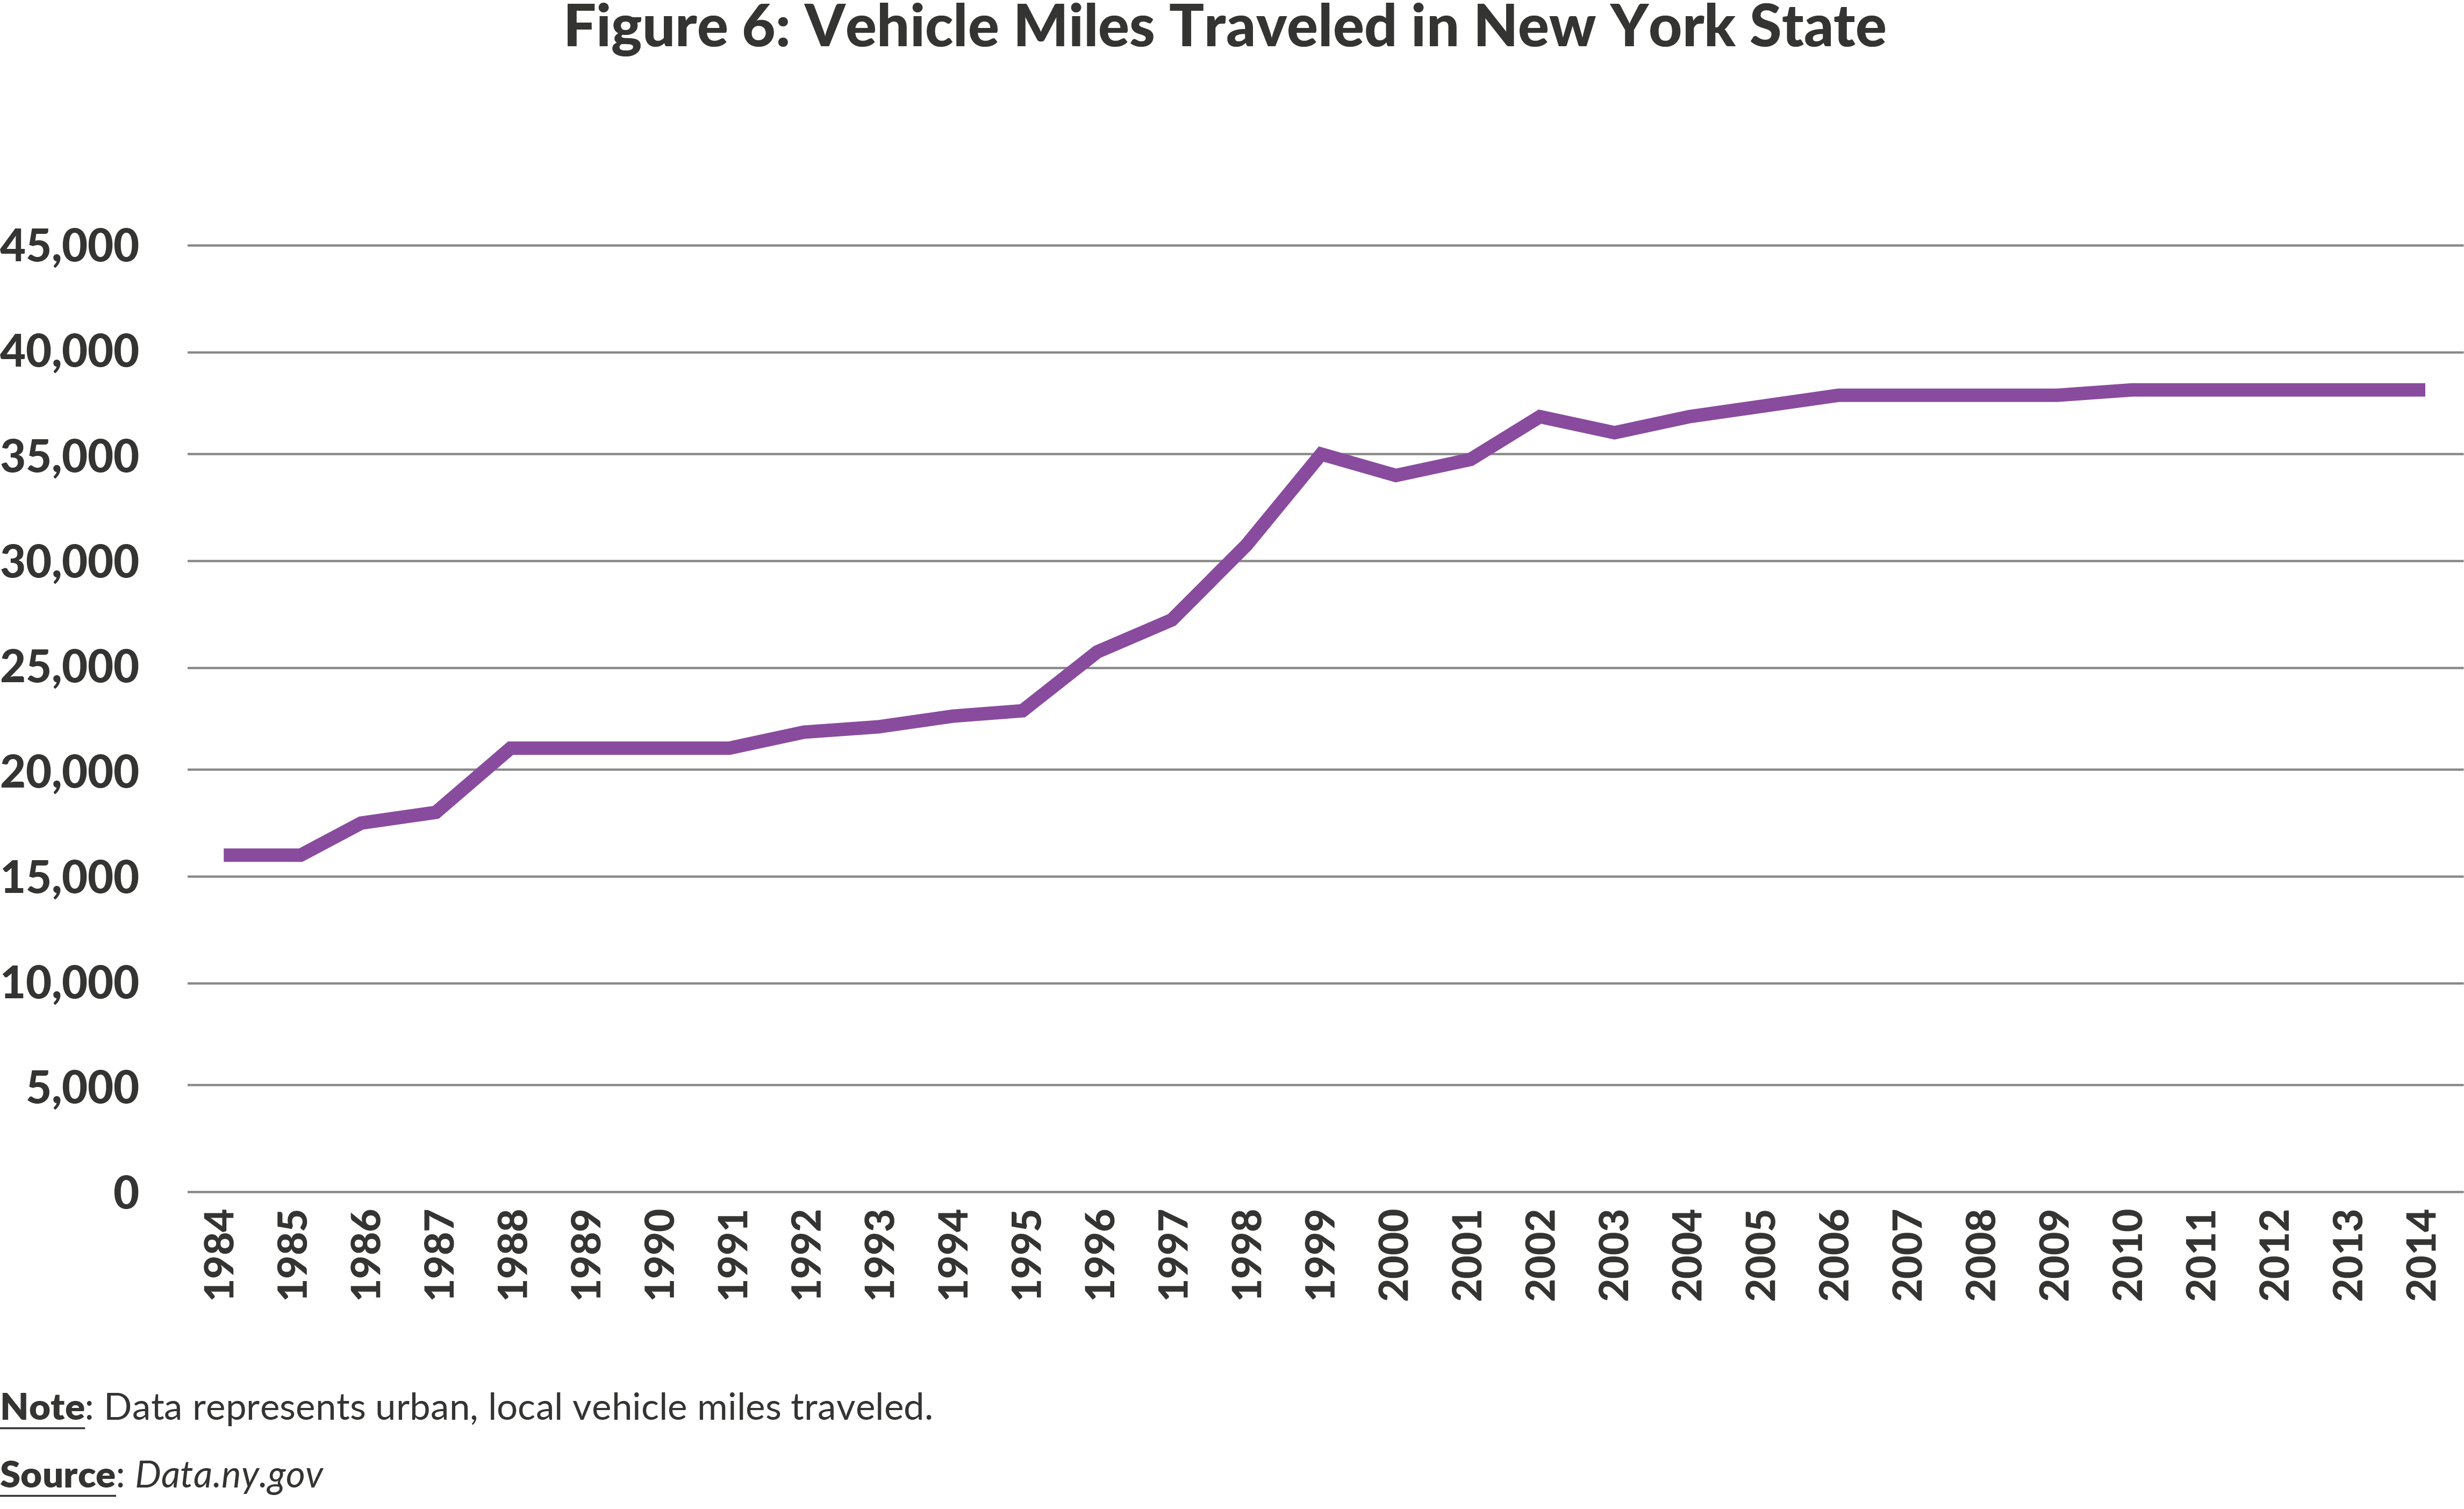
Additionally, automobile fuel efficiency has increased over the last 35 years and continues to increase (Figure 6),20 meaning that revenue collected by the gas tax may be a less reliable source of funds in the future. According to the United States State Energy Data system, gas consumption in the US has not increased over the last 50 years.21 Several states, including Oregon and Maine, have begun to explore alternate methods of funding transportation infrastructure through vehicle miles travelled taxes.
Best Practices in Alternative Funding Sources
Oregon: Vehicle Miles Traveled (VMT) Tax
In 2015, Oregon introduced a voluntary VMT tax pilot program called OReGO. In 2001, the Oregon Legislature created the Road User Fee Task Force to investigate alternative methods for funding roads and bridges. The Task Force’s members appointed by the Governor, Senate President, House Speaker, and Chair of the Transportation Commission, and serve 4-year terms. The Task Force directed VMT pilot in 2006 and 2012.
OReGO volunteers pay a road usage tax 1.7 cent per mile and receive a credit at the pump for the fuel tax they pay. (Oregon’s current gas tax is 34 cent per gallon.) Participating drivers use a device installed in the car to monitor their mileage and can check their mileage online.
London: Congestion pricing
In London, drivers pay £11.50 ($15.15) to enter the CBD between 7am and 6pm. According to Transport for London, congestion pricing generated £1.2 billion ($1.58 billion) in gross revenue from its implementation in 2003 through 2013. In London and other cities where congestion pricing has been implemented, benefits include decrease in traffic and CO2 emissions, as well as an increase in revenue that can be put towards public transit infrastructure.
User Fees
State authorities are largely self-funded through their revenues (e.g., tolls, fares, rents). Almost a third (31%) of the MTA’s 5-year $33 billion capital plan is funded through bonds backed by tolls, fares, and dedicated taxes and subsidies. 44% of the Port Authority’s $10-year $32 billion capital plan is funded by rents and bonds paid by tolls and fares. 48% of the Thruway Authority’s capital plan is funded by tolls.
Debt
State Debt Capacity
According to the State Comptroller’s 2018 Financial Condition Report, New York has the second highest outstanding debt in the country after California. Over the next five years, the State projects issuing $31.7 billion in debt, while only retiring $20.4 billion in debt. New York State’s debt capacity is decreasing while debt servicing is continuing to grow, accounting for a larger proportion of the State’s budget. This could lead to a long-term reduction in the flexibility of the State to finance infrastructure projects.
Authority Debt Capacity
Over the last decade, the Port Authority’s outstanding debt has doubled, indicating potential limitations to the current approach to financing long-term investments. According to the New York State Comptroller, the amount of outstanding debt at the MTA is projected to increase by more than 20% by 2022 (from 2017 levels). At the same time, credit rating agencies such as Standard and Poor’s are downgrading the MTA’s credit rating, leading to higher costs for borrowing in the future.22
Project Delivery
Current State of Project Delivery
Traditionally, projects in New York State are delivered through the design-bid-build process: the state issues an RFP to have a project designed; plans are submitted by potential architects or engineers and the state picks the favored option; contractors bid to build the project as submitted by the private architect or engineer and the state picks the contractor who submits the best value or lowest cost proposal. This approach can lead to a disconnect between the designer and engineer and asset owner, resulting in significant change orders, a slower project timeline, and additional community impacts. Other challenges with traditional project delivery are outlined below.
Project Delivery Issues
Time and Budget Overruns
New York megaprojects consistently exceed cost estimates and schedules. For example, Phase II of the MTA’s Second Avenue Subway project is continually delayed and costs $807 million per track mile in construction costs, making it the “world’s most expensive subway extension.”23 MTA-wide adoption of communications-based train control (CBTC), a more reliable signaling system, was calculated to take 50 years in a 2014 RPA report (despite the fact that cities like London and Paris have already begun implementing it).24 The Port Authority’s Bayonne Bridge reconstruction, another design-bid project, ran $350 million, or 25% over its budget. These consistent time and budget overruns lead to a loss of public trust.
While an attempt to review capital projects across State authorities and agencies was attempted in 2017 through the Dormitory Authority of the State of New York (“DASNY”), New York State Design and Construction Corporation, the entity that was created, has not been fully implemented.
Lengthy Environmental Review Process
The environmental review process in the US averages seven years, compared to 18-24 months in European cities. The extensive review process slows down capital projects.25
Regulatory Burdens
New York has several regulatory laws that contribute to higher project costs. The Scaffold Law imposes absolute liability on a property owner in the event of a work-related accident. While based on a rational objective, New York is the only state in the country to have such a law, which causes contractors to inflate their costs and disincentivizes building in the State because of the high cost of accidents. Wicks Law, which requires public projects over a certain cost to bid out certain disciplines separately rather than allowing a general contractor to hire subcontractors, can increase project budgets and timelines, as it requires agencies and authorities to oversee multiple contracts. Wicks Law has been slowly phased out for many public contracts but is still required in certain cases.
Certain federal requirements, including Buy America clauses on federally funded transportation projects, can significantly increase costs and cause negative schedule implications. Large mega-projects including Second Avenue Subway and Fulton Center, to name a few, have spent significant time and effort attempting to comply with Buy America clauses for equipment that is not made in America. In order to comply, projects are forced to bear increased costs and often schedule delays to source materials locally.
Labor Costs/Work Rules
As CBC and the RPA have noted in previous reports, outdated and fractured work rules can increase cost of delivering projects. For example, within the MTA, work rules differ between Metro-North and the Long Island Railroad, leading to inefficiencies and delays. Coordination between City, State and Federal agencies (including Amtrak) have additional impacts on project delivery and often have budget implications. The RPA’s report found that the MTA’s East Side Access (ESA) construction costs are nearly twice that of the comparable London Crossrail project, and attributes the difference to the limited productive work hours available to the ESA project.26
Procurement/Contracting
Piecemeal, complicated procurement also hinders project delivery. In their report on the cost of MTA megaprojects, the RPA found that separate phases of a project are often awarded to different contractors, resulting in slow, fragmented project delivery.
Alternative Delivery Approaches
Design-Build
Design-build is a project delivery method where the designer and contractor work together as a single entity. Design-build is authorized to be used by the Thruway Authority, DOT, NYS Parks Department, DEC, and Bridge Authority. It is also authorized for use for specific projects, including NYCHA capital projects, the replacement of the Rikers Island Jail Complex, and the Reconstruction of the Brooklyn-Queens Expressway. Only a limited amount of MTA projects, such as station renovations, are authorized for design-build.27
Design-build can be more advantageous for certain projects due to the flexibility it offers contractors to construct a project using non-traditional or more innovative methods. This can result in less disruption to communities, better project phasing, and potential cost savings compared to a more traditional design-bid-build project delivery approach. Design-build also allows contractors to be relieved of certain public-sector construction means and methods that may not be as cost-effective as approaches the contracting community can utilize in private sector projects. As CBC noted in the editorial Don’t Block Design-Build, New York’s limited experience with design-build has been positive, as both small and large design build projects have been delivered under budget and on time. For example, the replacement of the Kosciuszko Bridge was completed on budget and within a month of the original contract completion date. The design-build process is credited with the efficiency of the Tappan Zee Bridge reconstruction, which is currently reported to be on time and on budget.
However, design-build may not be appropriate for every project and should be evaluated on a case-by-case basis. For certain infrastructure projects, a traditional project delivery approach can provide more control over construction techniques or interim project processes that are desired by certain agencies or authorities. For a highly complex project, the ability to retain additional control throughout the project may be a higher priority than the potential cost or schedule benefits of design-build.
Design-Build-Finance-Maintain (DBFM) and Design-Build-Finance-Operate-Maintain (DBFOM)
Several Port Authority projects are being managed through more complex public-private partnerships:
- The Goethals Bridge Replacement is being managed by NYNJ Link Developer, LLC through design-build-finance-maintain (DBFM). This means that in addition to designing, building, and financing the bridge, NYNJ Link will provide management or maintenance services.
- The LaGuardia Airport Terminal B redevelopment is being managed by LaGuardia Gateway Partners (LGP) through design-build-finance-operate-maintain, which means that LGP will collect fees from the terminal for a specified amount of time in exchange for assuming the total risk of the project.
The main benefit of DBFM/ DBFOM is that it transfers more risk associated with the cost, schedule and quality of construction of projects from the public to the private sector. According to the US Department of Transportation, other public benefits of DBFM/ DBFOM include accelerated project delivery and better operating efficiency.
Best Value Procurement (BVP)
In Best Value Procurement (BVP), qualitative criteria are used to select a contractor, rather prioritizing the lowest responsible bidder. Criteria can include factors such as schedule, innovation, management of traffic, and environmental remediation. BVP can be used alongside either design-bid or traditional design-bid-build procurement, meaning that even agencies and authorities not authorized for design-bid can use BVP.
An Iowa State University report examined the use of BVP by the New York State, Oregon, and Michigan Departments of Transportation. It found that benefits are that BVP requires the agency issuing the proposals to craft accurate and relevant procurement criteria, and it requires contractors to develop detailed project management plans early in the process. Challenges to BVP include increased time for creating criteria and evaluating proposals, so BVP may not be appropriate to use for every project. But when used for the right project, the Iowa State report found that BVP reduces risk, allows for a more flexible process, and provides projects that are of a higher quality.
Integrated Project Delivery (IPD)
Integrated project delivery is “an approach that integrates people, systems, business structures, and practices into a process that collaboratively harnesses the talents and insights of all participants.”28
Penn State University conducted a statistical study of 204 capital projects around the country, including projects in New York, New Jersey, Massachusetts, California, Pennsylvania, Florida, and Texas.29 The 2016 study found that more important than the project delivery method was having a project delivery strategy that aligns the project team – including owners, designers, and builders – early on. In particular, the study found that early involvement of the core project team, a selection process based on relevant qualifications rather than price, and transparency in cost and risk were the hallmarks of projects that successfully met cost, schedule, and quality goals. IPD requires more flexibility and communication from project components than traditional delivery methods.
Best Practices in Project Delivery
British Columbia: Assessment of project delivery methods
Partnerships British Columbia is a private entity wholly owned by the British Columbia provincial government. Its role is to conduct a business case for public infrastructure projects that are estimated to cost over $100 million, determining the best procurement method so that private sector investment can be used when appropriate. Partnerships BC evaluates various project delivery methods for projects under their review, providing a roadmap and rationale for the recommended approach. Partnerships BC was modeled after a similar entity in the United Kingdom – Partnerships UK, which has now merged to become an entity responsible for not only project delivery advisory but also oversight of mega-projects.
California, Washington, Oregon, and British Columbia: West Coast Infrastructure Exchange (WCX)
Established in 2014 by the governors and treasurers of Washington, Oregon, and California, and the premier of British Columbia, the mission of WCX is to provide public agencies on the West Coast with impartial training and education about public-private partnerships and assist public agencies in exploring and analyzing procurement and project delivery options. The WCX’s mission of sharing best practices, supporting education and recommending project delivery approach on a project-by-project basis is a work-in-progress.
Recommendations
1. Establish an Office of Infrastructure to lead statewide infrastructure planning.
Capital planning is a critical component of a functioning infrastructure system. A formalized approach to statewide capital infrastructure planning is not only helpful, it is critical to ensure alignment and coordination across the many entities responsible for New York State infrastructure spending. While several authorities and regions today have strategic plans and formal capital planning processes, there is no statewide coordination of these plans. Long-term, cross-agency planning must be institutionalized, and one way to achieve this is through an Office of Infrastructure. This Office would reside in the executive department, as it needs to have a clear line of authority from the Governor, yet be independent of existing infrastructure agencies. It should be led by a professional executive who has experience with the intricacies of NYS infrastructure, and supported by a lean staff, as its intention is not to be overly bureaucratic. The office would serve as a public face for the State’s infrastructure planning and vision.
An Office of Infrastructure should be established to lead overall state infrastructure planning and help set priorities statewide that individual authorities, agencies, and regions could use as guidelines for investment. Previous attempts at statewide coordination, including the New York Works Task Force (for planning) and DASNY’s New York State Design and Construction Corporation (for project management) neither was fully implemented. An infrastructure office would provide a clearinghouse for long-term planning – longer than five-year increments – which would allow agencies and authorities to budget more strategically.
There are precedents for this type of entity at this scale. California’s Governor’s Office is mandated to develop a five-year infrastructure plan to the Legislature with the annual budget each year. The 2018 California plan outlines anticipated spending and statewide priorities for the next 5 years, such as integrating climate change and resiliency into planning, and identifies major capital projects, including the $55 billion plan to build a high-speed rail line across the State. Large-scale planning efforts are not unique in New York State either; OneNYC, New York City’s cross-sector strategic plan, integrates resiliency and population growth into planning for New York City’s future. OneNYC is a 20-year plan that is updated every four years and produced by a special office of the Mayor that was established to create, update, monitor and report on delivery against the plan.
2. The Office of Infrastructure should articulate set of criteria to prioritize infrastructure investment, aligned with statewide policy objectives and needs.
The Office of Infrastructure should synthesize statewide public policy objectives into a set of criteria that can be used to guide investment. In 2013, The NY Works Task Force proposed the following criteria for prioritizing and evaluating infrastructure projects:
- Does the project produce positive spillover benefits and/or network effects for the larger economic system or network of which it is a part?
- Does the project improve environmental and financial sustainability?
- Does the project maximize the return on investment, including both social and financial returns?
- Does the project reduce the total cost of ownership over the life of the asset?
In addition to New York Works’ thoughtful criteria, we recommend the following criteria be used to inform investment priorities:
Tying investment in infrastructure to positive spillover benefits.
Rather than bringing all assets to a state of good repair, assets should be prioritized that are tied to economic growth goals. This would mean that assets directly linked to economic activity should be prioritized over a sense of a regional equitable allocation of resources. The MTA is a priority because its functioning is crucial for the economic competitiveness of the City, the region, and the State. The Gateway Program is similarly crucial.
Ensuring long-term resiliency.
Infrastructure planning can better prepare the state for future environmental challenges including rising sea levels and coastal storms like Hurricane Sandy. Building resiliency and into our systems and structures should be a core value when identifying new investments.
Promoting equity.
Infrastructure – particularly transportation – has the ability to increase equity by connecting residents to jobs, allowing for economic and social mobility. Investing in infrastructure will ensure continued economic mobility, tying together currently disparate regions of the state.
Incorporating lifecycle costs.
Related to a key criterion of the New York Works Task Force, overall lifecycle costs should be incorporated into project planning, especially if there are opportunities for the private sector to cover aspects of long-term costs including operations and maintenance costs.
3. Within the Office of Infrastructure, project prioritization and investment must balance often competing goals: maintaining a State of Good Repair of existing assets vs delivering transformative projects that expand capacity, and investing in technology that can support future needs of the state like autonomous vehicle infrastructure.
A. The Office should develop and conduct analytic assessments and prioritize appropriate investment in SOGR projects for existing assets vs new transformative projects that expand capacity.
Similar to criteria for overall investment priorities, the Office of Infrastructure should look at overall need and balance that with the potential benefits (economic impacts, resiliency benefits, demographic shifts). Without a clear needs assessment and identification of SOGR needs from each agency or authority, it is not possible to determine how much (more) funding should be going to SOGR. Identifying these needs across all major infrastructure classes should be a key priority.
Industry-appropriate metrics, including intensity of asset use, should be used to determine if a sufficient investment in SOGR is being made. For trains and buses, the mean distance between failures (MDBF), a metric that measures the distance between breakdowns or failures, tracked over time would indicate whether those systems are being kept in a state of good repair. For example, the New York City Transit’s MDBF has decreased from 145,697 miles in 2014 to 122,090 in September 2018. Additionally, the subway has not met its target of 150,000 miles since 2011. These metrics indicate that the system is not in good repair. New York State roads are evaluated on a scale of 1 to 10, with 1 being the poorest and 10 being the highest condition. Analyzing the grades roads receive over time would demonstrate whether sufficient investment is being made.
To accurately determine the value of SOGR projects, a benefits/cost analysis should be performed to determine the potential economic cost of not bringing assets to a state of good repair. This could more fairly and accurately weight SOGR projects. For example, the cost of not performing the necessary repairs in the Gateway Program would be equal to the revenue lost from commuters being unable to cross the Hudson River. While these assessments may be performed for some megaprojects, they are not always publicly shared. Publicly available analyses should be performed for both megaprojects and SOGR that include lifecycle costs and show the public the rationale for choosing some projects over others.
B. The Office should identify emerging needs, such as driverless cars and the need for emergency preparedness, to shape future investment.
The Office should lead the State in identifying infrastructure that utilizes leading technology and has the potential to transform the State and ensure its role as a global leader in infrastructure. Potential examples include:
Infrastructure to support electric vehicles and autonomous vehicles
Increased use of autonomous vehicles will have impacts on how city residents use public transit, where people choose to live and work, and how cities plan for parking needs. Forward-thinking policymakers should consider how infrastructure will need to be adapted to facilitate the safe introduction of driverless vehicles.
Additionally, the state should continue to support infrastructure that facilitates electric vehicles. For example, LIPA recently proposed to spend $20.5 million over the next four years on electric vehicle infrastructure, including public, workplace, and residential charging stations. Continuing to invest in charging stations and other infrastructure statewide will support electric vehicle ownership.
Energy microgrids
Continue to incentivize the creation of microgrids, or standalone energy systems, that can provide power in the event of a power outage. Competitions like NYSERDA’S NY Prize incentivize collaboration and creativity in addressing energy challenges of the future.
Coastal resiliency
New York can protect vulnerable assets and grow our economy by investing in coastal resiliency infrastructure. For example, the Netherlands’ Room for the River program is a long-term strategic plan to manage higher water levels by giving the river areas to flood safely. New York City’s Lower Manhattan Coastal Resiliency Strategic Plan also serves as a model for integrating resiliency planning with other public policy goals including, housing, and employment centers, and open spaces.
4. The Office of Infrastructure should be a clearinghouse for project transparency and reporting, providing a single access point for capital infrastructure projects statewide.
The Office of Infrastructure should maintain publicly available dashboards that track project metrics such as cost and schedule across all agencies and authorities. These dashboards exist for some agencies, including the MTA and the DOT, but formalizing and expanded their use across infrastructure agencies will ensure consistency and accountability. Locating all this information in a single place will provide the public with a clearer understanding of investment across regions and assets classes.
5. The Office of Infrastructure should create a Center of Excellence for State infrastructure investment with several objectives:
A. Address systemic cost drivers.
Outdated policies and piecemeal procurement have been shown to drive costs of New York State projects much higher than other states or countries. One of the first tasks of the infrastructure office should be to investigate and tackle these cost drivers through policy reform.
B. Assess and recommend the most appropriate project delivery method on a project-by-project basis.
The magnitude of cost overruns on projects can be decreased through streamlining the procurement process and, in certain cases, expanding the use of alternative delivery mechanisms, such as design-build and public-private partnerships. Procurement methods including design-build that shift certain delivery risks from the public to private sector have resulted in major capital projects being delivered on time and on-budget, while best-value procurement has resulted in selection criteria that require both agencies and contractors to anticipate and plan for future challenges. New York State’s infrastructure delivery entities should utilize these delivery approaches more frequently to improve the cost-effectiveness and timeliness of project delivery throughout the State.
As evidenced by successful projects such as the Gov. Mario M. Cuomo Bridge and the Kosciuszko Bridge, design-build can achieve better results for overall budget and schedule timelines. The Cuomo and Kosciuszko bridge projects are expected to be delivered on-time and within a few months of the expected completion date. Expanding the range of project delivery options will ensure that the right methods can be used to delivery projects.
An example of such an entity is Partnerships British Columbia, a private company owned by the Finance Ministry of British Columbia that assesses project delivery options for major infrastructure projects and recommends the most cost-effective method. Partnerships BC is based on Partnerships UK, a public-private partnership formed by the Treasury to support public projects by facilitating procurement, project delivery and investment from the private sector. Partnerships BC was established in 2002 by the Province of British Columbia with the mission to provide expertise and consistency in the procurement of complex capital public projects to deliver measurable benefits to taxpayers. Its Board of Directors is made up of leaders from the public and private sectors. The sole shareholder is the Minister of Finance. They conduct a business case for public infrastructure projects that are estimated to cost over a certain amount, determining the best procurement method so that private sector investment can be leveraged when appropriate. Since its creation, Partnerships BC has advised 52 projects in healthcare, transportation, energy, and utilities. Projects that Partnerships BC has advised include new rapid transit lines, bridge replacements, and highway repairs. For each project, Partnerships BC analyzes and compares different project delivery methods before recommending the most cost-effective option.
C. Encourage and facilitate knowledge sharing across entities.
At present, coordination occurs when necessary for specific projects. In order to meet New York’s future infrastructure needs, the Office of Infrastructure should ensure that their goals are aligned across agencies and authorities through technical expert knowledge-sharing, procurement best practices, and project delivery strategies. The Port Authority has utilized public-private partnerships for several decades to manage certain assets, including terminals at JFK Airport, and could share best practices with other infrastructure entities across New York. This office would convene regular working groups to share knowledge across agencies and sectors and report on best practices in planning, budgeting, and project delivery.
For example, the West Coast Infrastructure Exchange (WCX) is a collaboration between California, Oregon, Washington State, and British Columbia that standardizes transparency, contracts, and risk allocation. By sharing information, project finance and delivery methods can be scaled and replicated.
6. In order to appropriately fund the State’s infrastructure needs, New York will require more funding from its existing funding sources and should pursue alternate funding sources, such as congestion pricing and value capture.
Federal infrastructure spending is at 30-year low,30 and other State funding sources, such as the gas tax, have plateaued and are not likely to increase. The following are examples of best practices from the US and internationally of addressing infrastructure funding considering decreased gas tax revenue and other funding challenges:
Congestion Pricing
Congestion pricing places a surcharge for drivers entering heavily trafficked areas during certain times of day. For example, in London, drivers pay £11.50 ($15.15) to enter the CBD between 7am and 6pm. According to Transport for London, congestion pricing generated £1.2 billion ($1.58 billion) in gross revenue from its implementation in 2003 through 2013. In London and other cities where congestion pricing has been implemented, benefits include decrease in traffic and CO2 emissions, as well as an increase in revenue that can be put towards public transit infrastructure.
The FixNYC advisory committee convened by Governor Cuomo in October 2017 estimated the revenue generation from several congestion pricing models. They estimated that a for-hire vehicle (FHV) charge could generate between $155 and $605 million in gross revenue annually, depending on the fee amounts, geographic reach, and days/time enacted. A charge on cars and trucks below 60th St is estimated to generate between $810 million and $1.1 billion, depending on the times of day and days of the week it is enacted.
However, congestion pricing in New York City has proven difficult to enact legislatively. A plan to fully implement congestion pricing in Manhattan has not been adopted by the State Legislature. Instead, a small compromise was the inclusion of a $2.75 surcharge for FHVs south of 96th St in Manhattan in the SFY 2019 budget. New York City should monitor the success of the FHV congestion pricing program and expand it to all cars in trucks in the near term.
Vehicle Miles Traveled Tax
New York should consider implementing a pilot vehicle-mile-traveled (VMT) program as an alternative to the gas tax. In 2015, Oregon introduced a voluntary VMT tax program called OReGO. In 2001, the Oregon Legislature created the Road User Fee Task Force to investigate alternative methods for funding roads and bridges. The Task Force’s members appointed by the Governor, Senate President, House Speaker, and Chair of the Transportation Commission, and serve 4-year terms. The Task Force directed a VMT pilot in 2006 and 2012.
OReGO volunteers pay a road usage tax 1.7 centers per mile and receive a credit at the pump for the fuel tax they pay. (Oregon’s current gas tax is 34 centers per gallon.) Participating drivers use a device installed in the car to monitor their mileage and can check their mileage online. Because it is currently a volunteer program capped at 5,000 drivers, OReGO does not have a significant revenue impact. (In its 2017 report, a net revenue of under $1,000 was reported). Administrative and operational costs are high because of the new nature of the program, though OReGO has strategies for reducing those costs should the program become mandatory.
Value Capture
Value capture is form of public financing that recovers some of the value public infrastructure generates for the private sector. Value capture can be utilized to leverage the increase in property value around investments that expand the transportation network. For example, London’s Crossrail project included a value capture plan known as a Community Infrastructure Levy (CIL), which used a metropolitan-region-wide tax assessment to raise funds for the new rail line. According to the RPA, nearly “one-third of Crossrail’s $19 billion budget is funded by special tax assessments on commercial properties across the region…districts surrounding the station.”31 Value capture was also successfully used in New York City’s Hudson Yards project, which included rezoning the area near the project and allowed the City to recover some of the value of the land through property taxes.
Dedicated Taxes to Support Infrastructure Investment
Small, dedicated taxes can go a long way towards supporting infrastructure. In 2016, Los Angeles voters passed Measure M, a 0.5 percent sales tax to fund transportation. Measure M is expected to raise $120 billion over 40 years for public transit in Los Angeles County. That November, Seattle voters passed the Sound Transit 3 (ST3) ballot measure, which increases sales tax, motor vehicle excise tax, and property tax to expand public transit. ST3 is expected to raise $54 billion. The MTA levies a 0.375 percent sales tax in New York City and the seven counties outside New York City. This tax could be increased or expanded to other parts of the state to serve as a steady source of infrastructure funding.
Cost Benefit Assessment of User Fees
It is not clear whether user fees on State assets are leveraged at the right level from a cost-benefit perspective. While increasing fares or tolls or adding them to assets that have previously been free is never a politically popular move, more analysis is needed to determine whether the current level of user fees are supporting the continued maintenance of assets as well as supporting future goals.
Alternative Financing Mechanism - Resiliency Finance Corporation
Another proposed method is a Resiliency Finance Corporation, a public entity authorized to issue bonds, whose proceeds would be used to fund resiliency projects. A progressive Infrastructure Resiliency Charge (IRC) equal to a percentage of insurance premiums in NY would be charged to policyholders. A 2% IRC could raise $950 million annually, while only costing $24 per year on a car insurance bill of $1,224 per year. In total, the Resiliency Finance Corporation could raise $21B over 20 years.
Footnotes
- American Society of Civil Engineers, 2015 Report Card for New York’s Infrastructure, (2015), 5.
- Ibid., 9.
- Ibid., 2.
- While the Broadband Initiative is housed in Empire State Development (ESD), ESD is not an infrastructure agency and is not included here.
- The decrease in infrastructure as a percentage of total capital spending is also due to the fact that items such as State and Municipal Facilities Program bills have been increasingly classified in the budget as capital spending.
- Center on Budget and Policy Priorities, It’s Time for States to Invest in Infrastructure, (2017), 11.
- This figure does not include non-infrastructure DEC spending, such as wildlife and recreation.
- Authority spending includes State funding.
- The Capital Program Review Board consists of four voting members, appointed by the Governor, State Senate, State Assembly, and NYC Mayor, and two non-voting members, appointed by the minority parties in the Senate and Assembly. Each voting member has veto power over the capital program.
- New York Times, In Port Authority 10-Year Plan, $3.5 Billion Is Seen as Pittance, (2017).
- Citizens Budget Commission, Three Ways to Improve the Port Authority’s Capital Plan, (2017).
- Office of the New York State Comptroller, Thruway Authority Needs Plan to Meet Future Goals, (2016).
- Of the State’s $2 billion commitment, $1.1 billion went directly to the bridge; the rest was to defer toll increases system wide.
- Citizens Budget Commission, Bridging the Financial Gap: Funding the Governor Mario M. Cuomo Bridge, (2017).
- NY Times, Cuomo’s $14 Billion Solution to the Mess That Is J.F.K. Airport, (2018).
- Governor Andrew M. Cuomo Pressroom, Governor Cuomo Signs Legislation Advancing LaGuardia AirTrain Project, (2018).
- CityLab, The Gateway Project Doesn’t Need Trump’s Approval, (2018).
- Governor Andrew M. Cuomo Pressroom, Governor Cuomo Announces Major Construction to Begin on New Grand Moynihan Train Hall, (2017).
- NY Times, Manhattan’s Farley Post Office Will Soon Be a Grand Train Hall, (2017).
- US Department of Energy, Alternative Fuels Data Center.
- Empire Center, NY’s Leaky Gas Taxes, (2018).
- Office of the New York State Comptroller, Financial Outlook for the Metropolitan Transportation Authority, (2018).
- Regional Plan Association, Building Rail Transit Projects Better for Less: A Report on the Costs of Delivering MTA Megaprojects, (2018), 2.
- Regional Plan Association, Moving Forward: Accelerating the Transition to Communications-Based Train Control for New York City’s Subways, (2014).
- Regional Plan Association, Building Rail Transit Projects Better for Less: A Report on the Costs of Delivering MTA Megaprojects, (2018), 4.
- Ibid., 52.
- Design Build Institute of America, NYC’s MTA Leverages Design-Build to Modernize Subway System, (2017).
- Construction Dive, The Strengths and Challenges of Integrated Project Delivery, (2018).
- Pennsylvania State University, Maximizing Success in Integrated Projects: An Owner’s Guide, (2017).
-
Ibid.
-
Regional Plan Association, Building Rail Transit Projects Better for Less: A Report on the Costs of Delivering MTA Megaprojects, (2018), 54.