PEG for Productivity
NYC's Fiscal Year 2023 Program to Eliminate the Gap
Mayor Eric Adams vowed to eliminate waste and inefficiency in City government. The pledge is welcome and refreshing, and action is necessary. Eliminating waste and inefficiency reduces costs without cutting services, improves the City’s fiscal sustainability, and importantly can improve service quality and management.
The Mayor took a first step with the Preliminary Fiscal Year 2023 Budget’s Program to Eliminate the Gap (PEG). However, management reforms that increase efficiency were only approximately 6 percent of the gap-closing program for fiscal year 2022 to fiscal year 2026. More than 60 percent of the PEG’s savings came from re-estimates of planned spending and shifts to non-City funding sources. Eliminating vacant positions—a positive step toward bringing headcount closer to fiscally sustainable levels—comprised approximately 24 percent of savings.
Perhaps this was reasonable since the budget was released little more than six weeks after the Administration took office. But to increase the City’s fiscal stability and the quality of priority services, identifying and implementing efficiencies to reduce recurring costs without reducing services should be a high priority, day-to-day, and when formulating and implementing the budget.
The Mayor’s Office of Management and Budget (OMB) should initiate a productivity PEG to generate options to save 3 percent of City-funded agency spending—growing from $1.5 billion in fiscal year 2023 to $1.6 billion by fiscal year 2026. The analytic work should start immediately, and the total or selected productivity improvements should be part of the Executive Budget due in late April.
The Preliminary Budget PEG Generated Savings but Did Little to Increase Efficiency
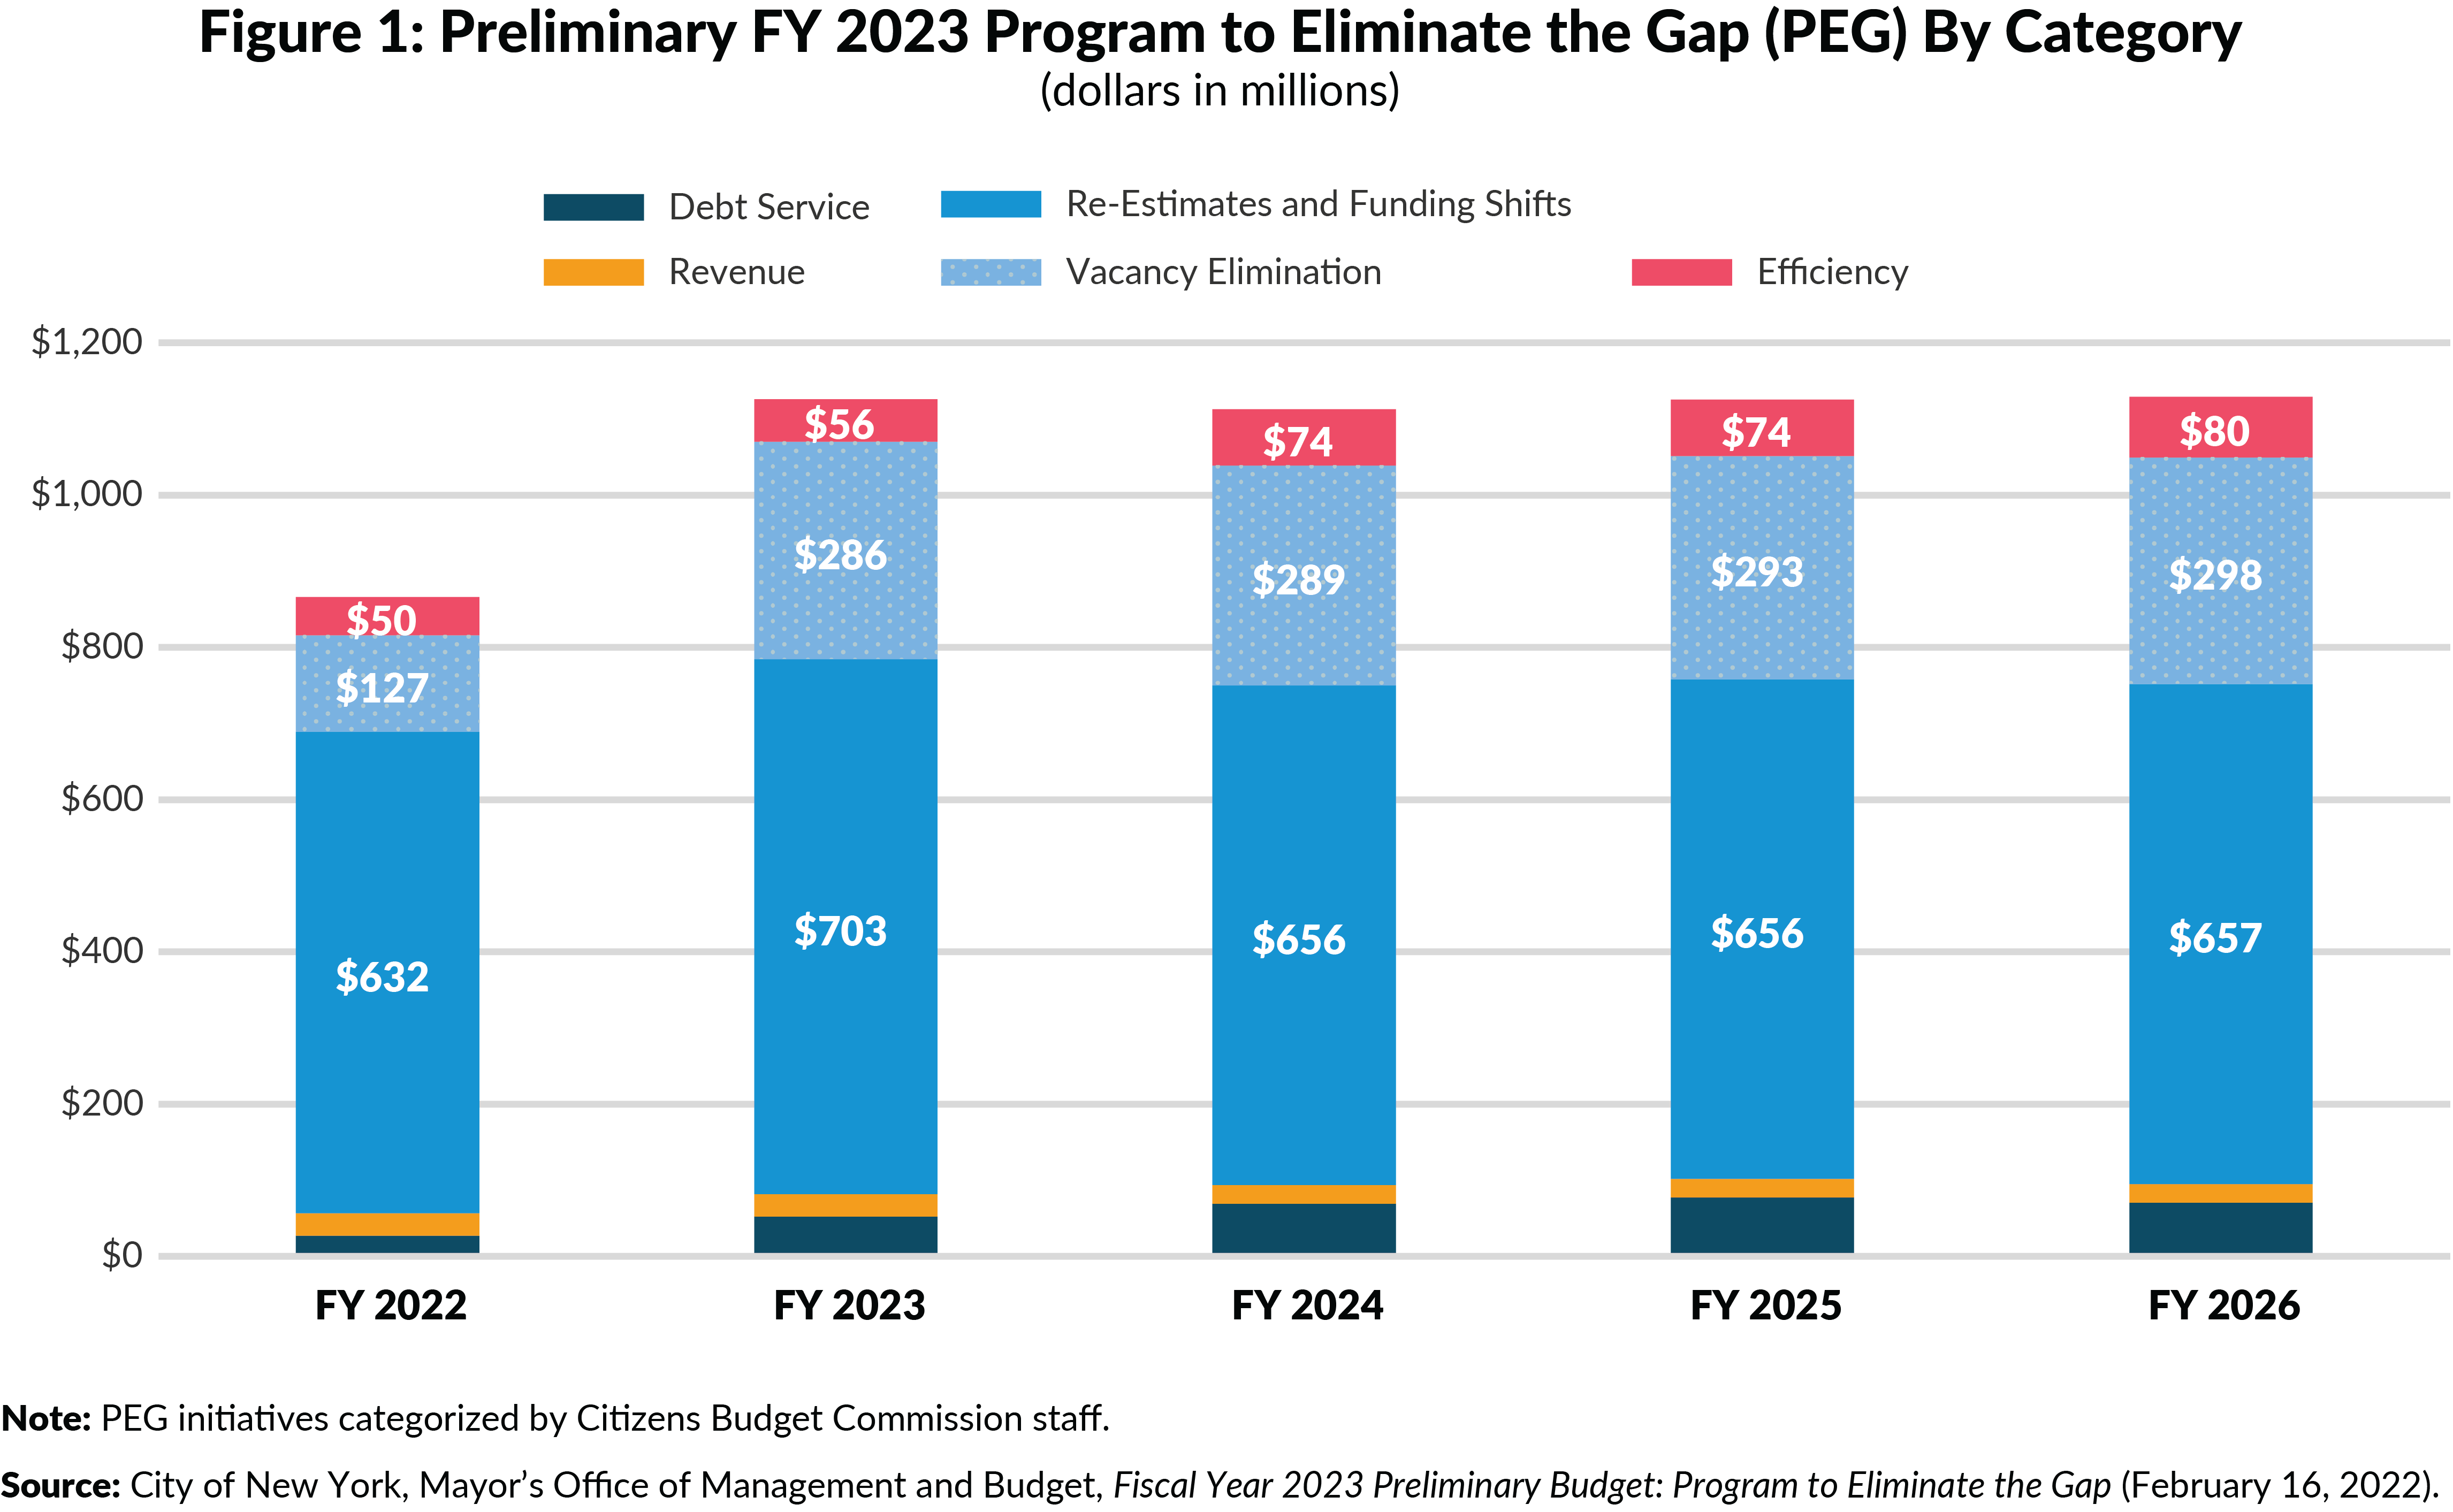
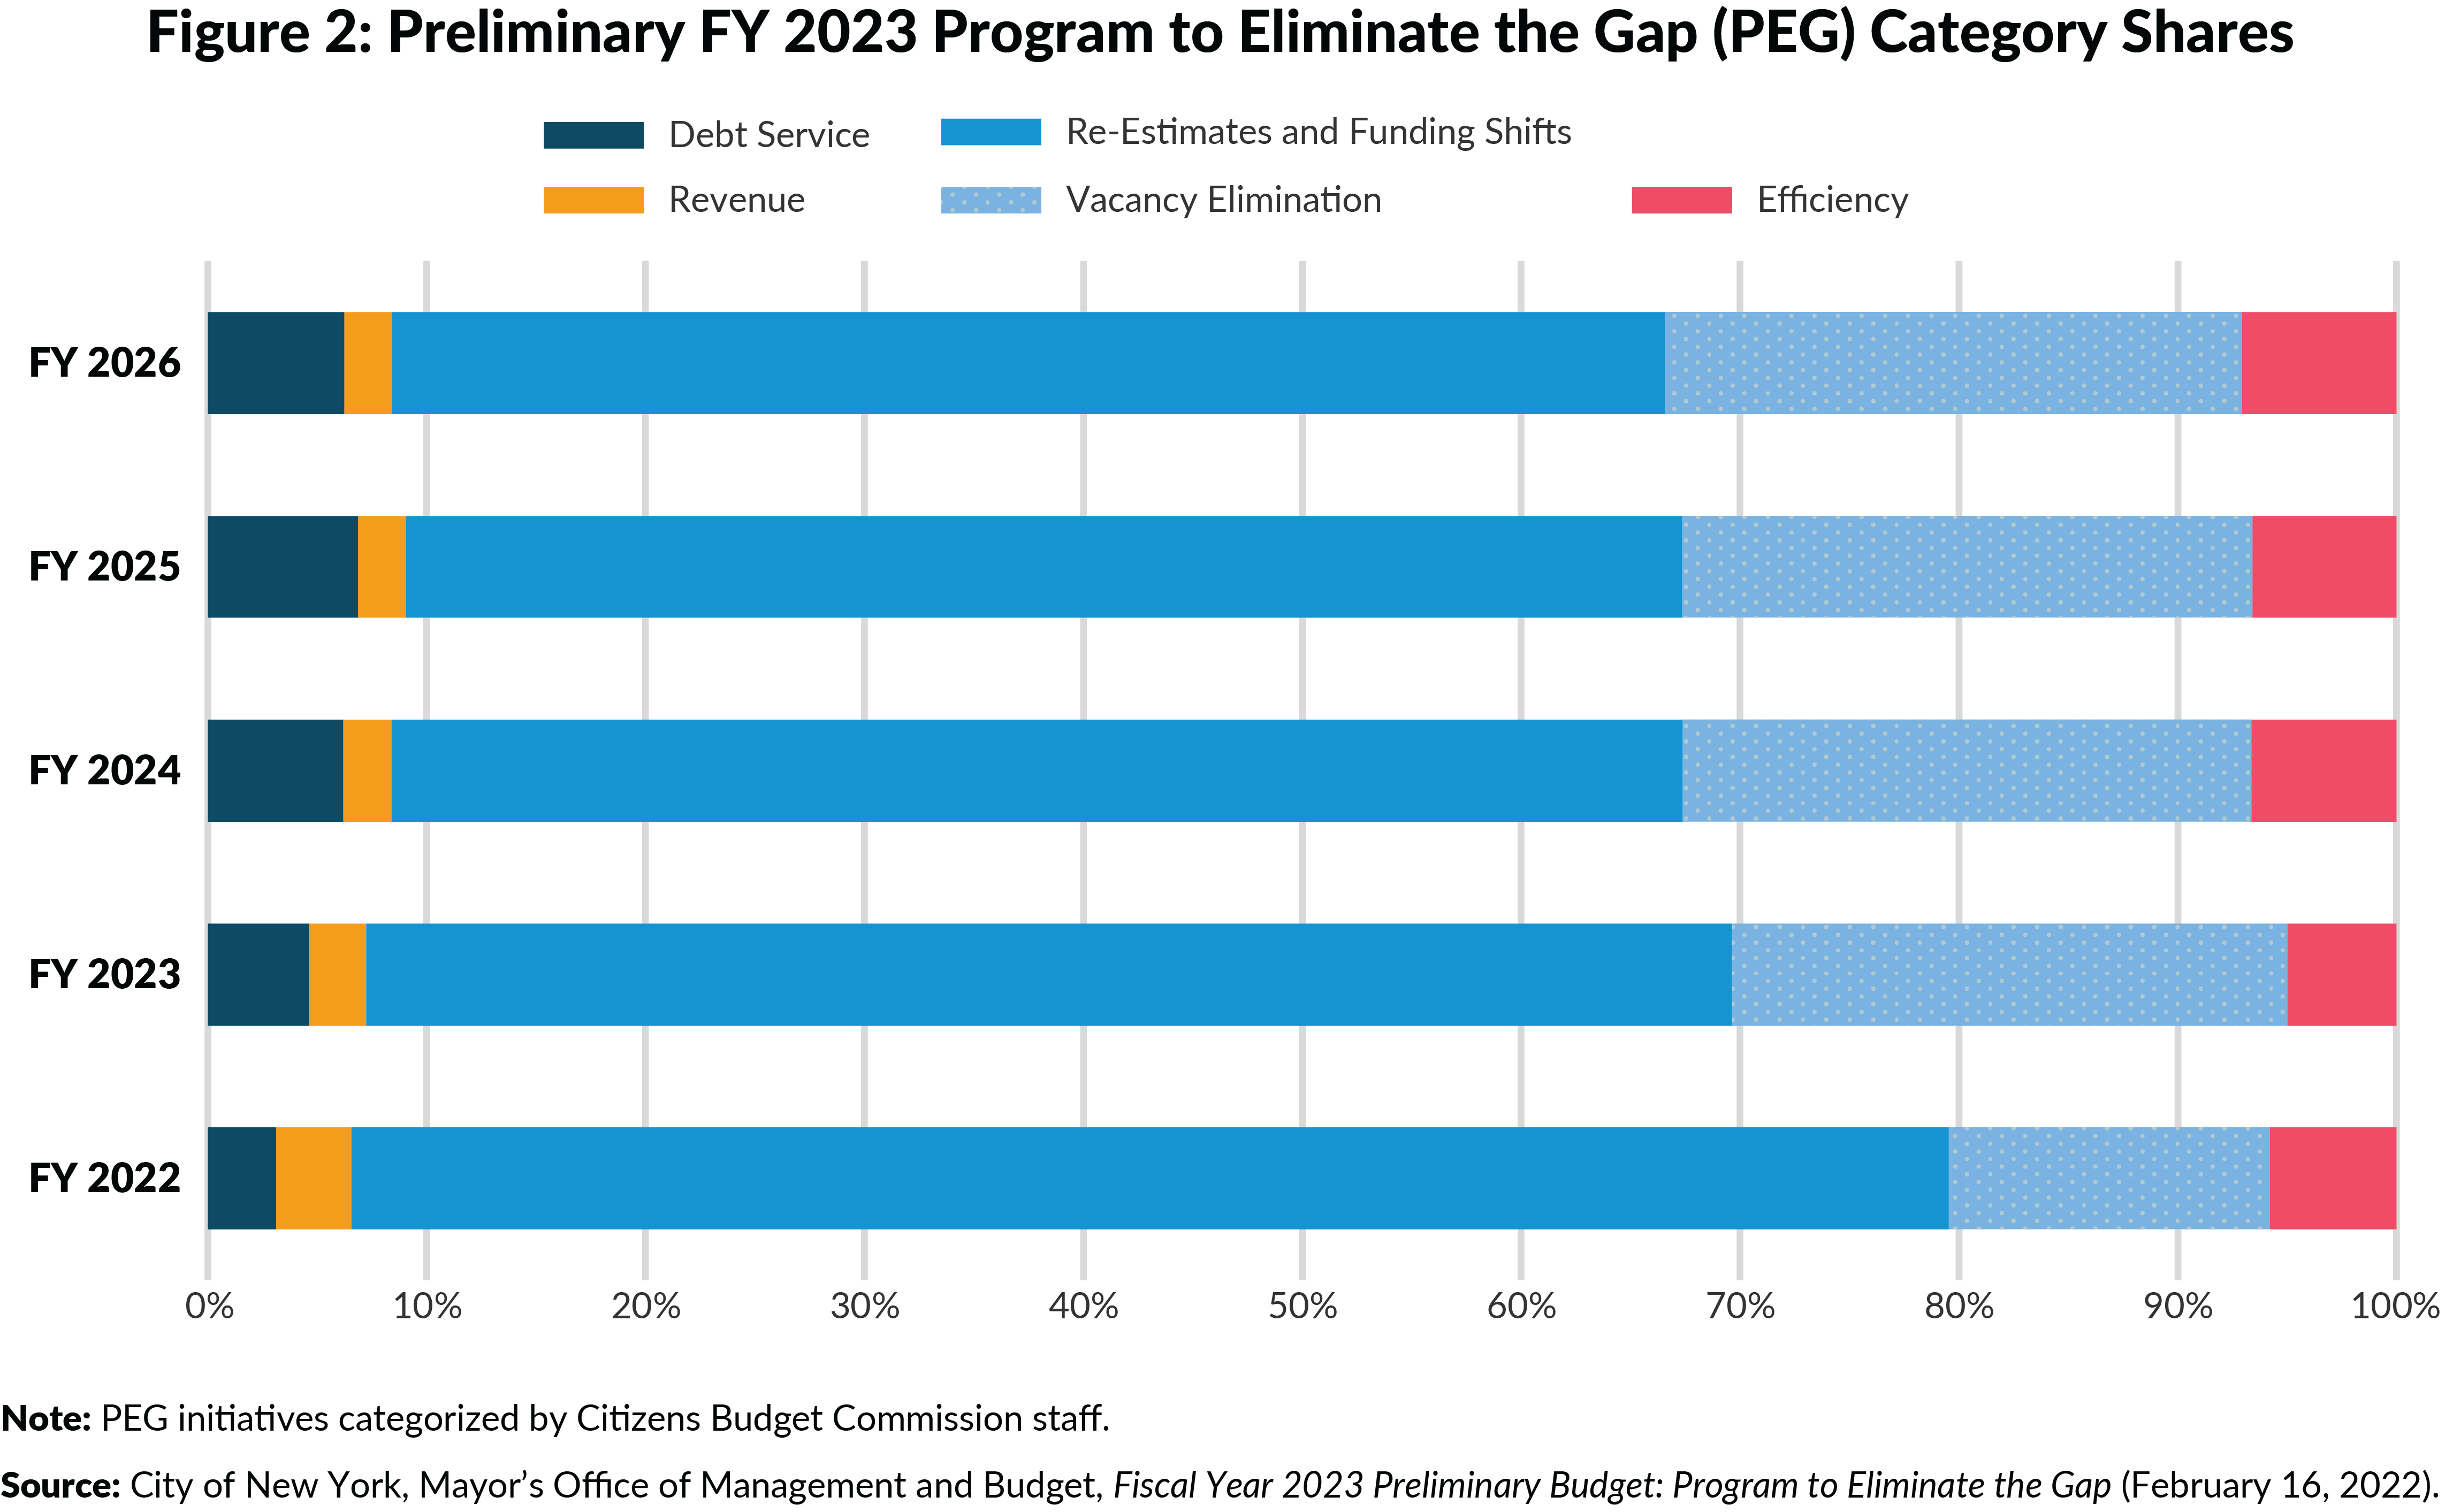
The Preliminary Fiscal Year 2023 Budget PEG included actions that saved an average of $1.1 billion annually from fiscal year 2022 to fiscal year 2026. CBC’s analysis found that only 6.2 percent of the cumulative five-year savings came from increased efficiency.1 Efficiencies’ share of the PEG rose slightly over time, increasing from 5.8 percent in fiscal year 2022 to 7.1 percent in fiscal year 2026. The majority of savings, 61.6 percent, came from re-estimates of planned spending and shifting support for services from City funds to other sources. The second largest portion, 24.1 percent, came from the elimination of vacant positions.2 While not increasing productivity, these vacancy reductions are a welcome, important step to rightsizing the budget. (See Figures 1 and 2.)
Relative to the total budget, efficiency savings initiatives that improve services or reduce costs without cutting effective services were extremely small, comprising approximately 0.15 percent of total City-funded spending of agencies participating in the PEG in fiscal years 2022 and 2023.3 Only 8 of 60 participating agencies’ PEG initiatives included any efficiency savings.4 Of the 10 efficiency initiatives, the biggest savings were from the Department of Education school budget allocation efficiency PEG ($36.8 million in annual recurring savings). Only the Department of Sanitation had multiple efficiency initiatives: 1) reducing garage staffing through attrition, 2) reducing the number of uniformed staff assigned to administrative duties through attrition, and 3) eliminating training that has not been effective.
The PEG’s vacancy reductions eliminated 7,026 full-time positions across 42 agencies for annual savings of approximately $290 million. The net reduction in City authorized headcount was lower in fiscal years 2022 and 2023, by 3,568 and 4,746, respectively, because some of the eliminated City-funded vacancies were offset by federally funded positions or other adjustments in the near term. Nonetheless, bringing authorized headcount to more fiscally manageable levels is important to the City’s long-term stability, and enough vacancies remain to staff priority functions.5
Categorizing PEGs
The City and its fiscal monitors categorize PEG initiatives into categories that differentiate how savings are being achieved. CBC uses the following four groups, though occasionally additional subcategories are included:
- Re-Estimates and Funding Shifts: Re-estimates are savings from lower than previously expected costs not attributable to specific efforts to reduce spending. Within re-estimates, CBC includes elimination of vacant positions (specified separately in this brief given they are a significant portion of the savings and the result of a specific Administration directive) and accruals (short-term savings from unfilled positions that do not remove the position from the budget). Funding shifts are reductions in City-funded spending due to securing non-City revenues. Occasionally the City may identify recurring funding, but in most instances, these are one-time revenues from prior years applied to current year spending.
- Debt Service Savings: Savings from lower-than-expected debt service, including variable rate interest, refunding savings, and differences in actual versus projected debt service on new debt.
- Revenue Actions: Initiatives that increase City-funded revenue; this category can include asset sales or increased collection rates.
- Efficiency Savings: Efficiencies are initiatives that improve operations by reducing costs without reducing services. For example, operations can be redesigned to streamline processes or to leverage technology to reduce staff time needed on functions; services also could be insourced or contracted out to reduce costs. Efficiency savings should be recurring and ideally reduce baseline spending.
PEG Savings Were Uneven Across Agencies
City agencies participating in the PEG were instructed to find savings of three percent. Overall, agency savings averaged 2.4 percent of City-funded spending over the five years, but proportional saving were greater in some agencies than others. Savings for 36 agencies exceeded the Citywide average. For those, most were between 2.5 percent and 3.3 percent; 15 agencies were at the 3 percent target. Of the 21 agencies below the average, 13 agencies were below 1.0 percent and 7 were between 1.0 percent and 2.2 percent. Table 1 presents the agencies with the highest and lowest cumulative five-year savings relative to their pre-PEG City-funded budgets.
Among agencies with savings below 2 percent were the agencies whose savings span only one or two years. To increase the City’s long-run fiscal stability, PEGs should generate recurring savings that reduce baseline spending, not just reductions in one or two years. Ten agencies’ PEGs include savings only in fiscal year 2022, and three more include savings in two or four of the five years.6 On the other hand, some agencies, such as the Police Department, the Department of Design and Construction, and the Fire Department, achieved savings in all five years, although those savings were well below the City’s target.
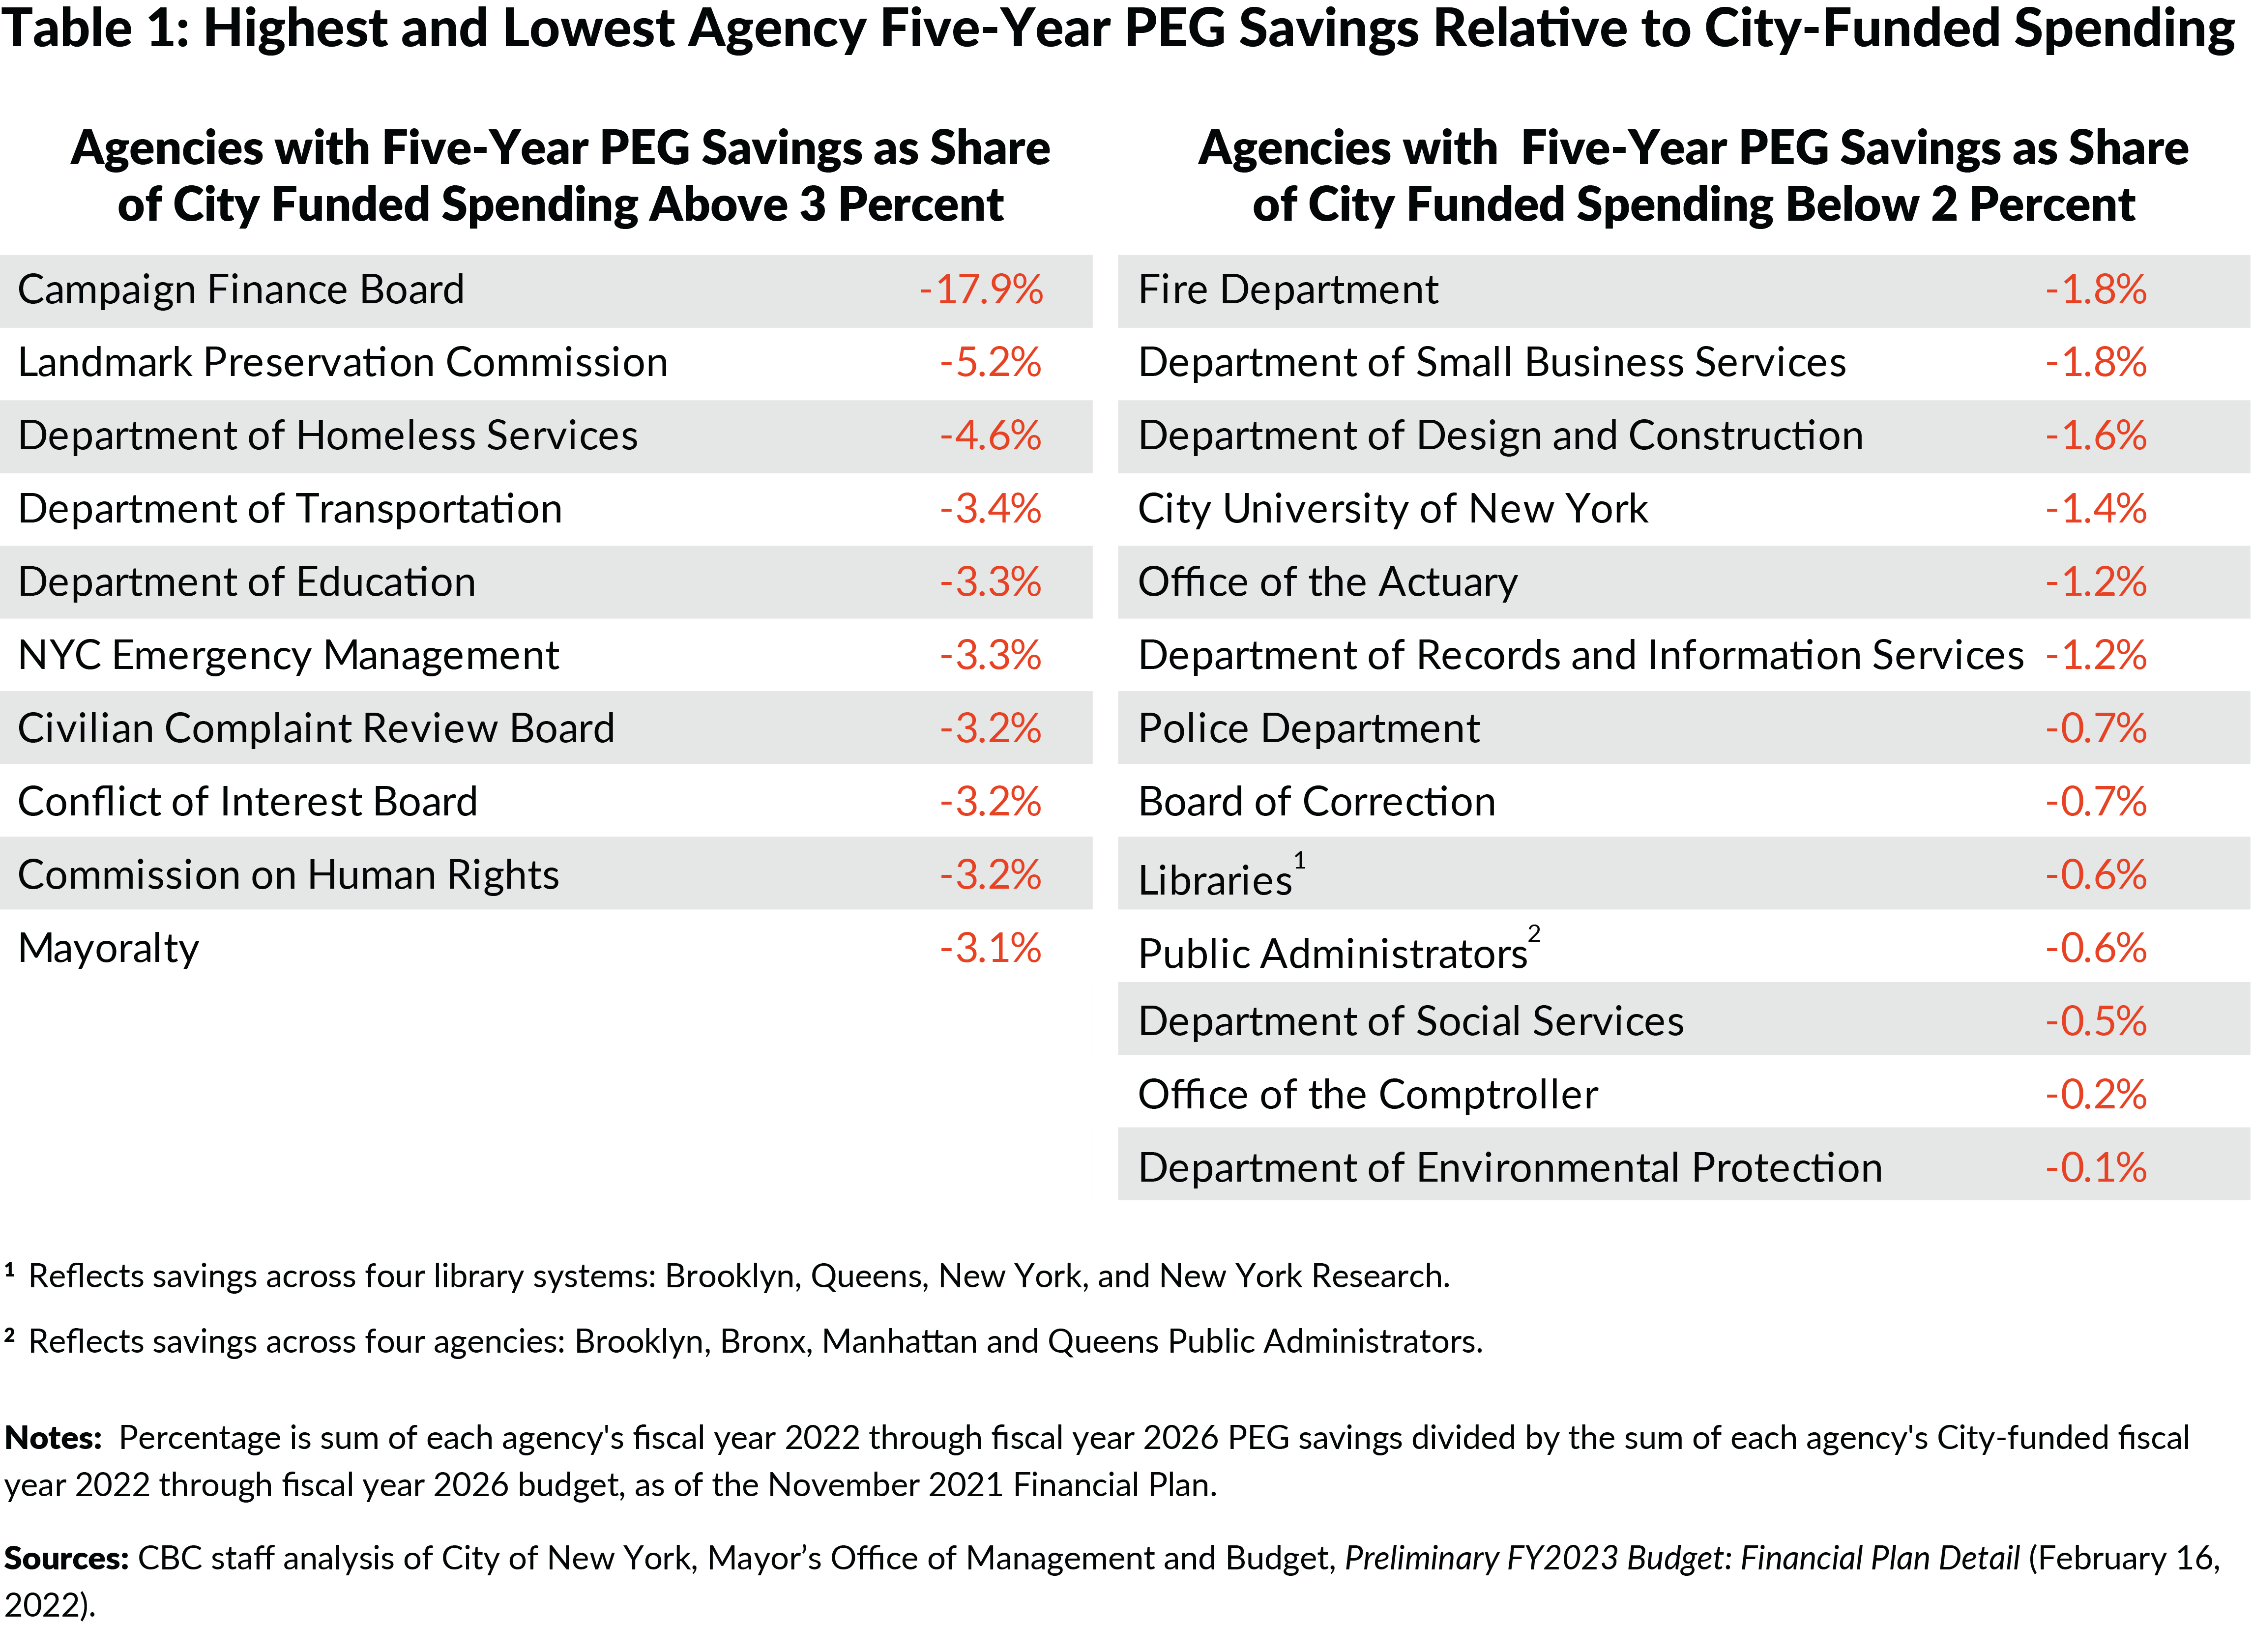
Two agencies stand out with the highest and lowest savings relative to their budgets. PEG savings in the Campaign Finance Board (CFB) were high because the cost of public matching funds for candidates in fiscal year 2022 were overestimated. This led to savings of $22 million from a $73 million budget in fiscal year 2022. Annual savings in the remaining four years were exactly 3 percent per year: $461,000 from a $15.4 million budget. Conversely, while the Department of Environmental Protection (DEP) is city-funded, it is funded by user fees. The Water Board transfers the necessary revenue to operate the system to the City; reductions in DEP City-funded spending generally reduce that transfer and cannot be used for other City expenditures. However, while reductions in DEP spending generally do not affect the City’s budget gap, they should be pursued to improve operations and to lower needed water and sewer rate increases.
The Mayor Should Include a Three Percent Productivity PEG in the Executive Budget
The February 2022 PEG was a welcome start to reducing ongoing City costs. Nonetheless, it did not substantially increase the efficiency of agency operations, nor did it reduce spending on low priority or lower impact services, one of the directions rightly encouraged by the PEG directive.7 The Mayor should take the next step to increase efficiency and reduce waste in his Executive Budget by including a productivity PEG equal to 3 percent of City-funded agency spending, approximately $1.5 billion in fiscal year 2023, whose recurring value would increase to $1.6 billion by fiscal year 2026.
Agencies should identify management reforms that reduce unit costs, streamline operations, and leverage technology.8 The examples cited above from the Department of Education and the Department of Sanitation illustrate the types of reforms that should occur in every agency. The City also should identify and implement efficiencies in centrally managed services like space leasing and fleet, which should provide additional savings.
Achieving a three percent productivity PEG is eminently possible but will be challenging. In recent years, the City has not required agencies systematically evaluate their management and operations to identify opportunities to be more efficient or programs whose outcomes may not be justified by their costs. Restarting a transformative PEG process may prove difficult. Doing so effectively, however, will generate benefits for the City. Sustainable productivity gains and efficiency savings help ensure future fiscal stability. An effective PEG process also is a vital management tool that can result in higher-quality, more cost-effective services for New York City’s residents and businesses.
Footnotes
- This categorization is based on the Citizens Budget Commission’s categorization of PEG initiatives. The City categorized efficiencies as 22 percent in fiscal year 2022, 32 percent in fiscal year 2023, 35 percent in fiscal years 2024 and 2025, and 37 percent in fiscal year 2026.
- In December 2021, there were 283,915 full-time on-board staff. Compared to the authorized level after the PEG, 306,291, the City had 22,376 vacant full-time positions. The authorized level of full-time staff is 302,600 in fiscal year 2023, which would allow the City to hire 18,685 above the December 2021 on-board headcount.
- PEG savings as a share of City-funded spending are calculated using November 2021 Financial Plan City-funded agency spending levels. CBC staff analysis of City of New York, Office of Management and Budget, February 2022 Program to Eliminate the Gap (February 2022), https://www1.nyc.gov/assets/omb/downloads/pdf/peg2-22.pdf,and November 2021 Financial Plan Expense (November 2021), https://www1.nyc.gov/assets/omb/downloads/pdf/nov21-fp.pdf.
- Excluding the debt service agency, the OTPS Inflation agency, and the miscellaneous budget, 57 operating agencies participated in the PEG.
- Ana Champeny, “18,000 Vacancies Should Be Enough: The City’s Vacancy Reduction Will Not Impede Hiring; How the City Manages Will,” Citizens Budget Commission Blog (March 30, 2022), https://cbcny.org/research/18000-vacancies-should-be-enough.
- These ten agencies are the Board of Correction, the New York City Comptroller, the four public library systems (Research, New York, Brooklyn, and Queens), and the four Public Administrators (Bronx, Brooklyn, Manhattan, and Queens).
- Joe Anuta, “In departure from de Blasio, Adams asks agencies to tighten belts. Here’s how much he wants to cut.” PoliticoPro (January 11, 2022), https://subscriber.politicopro.com/article/2022/01/11/in-departure-from-de-blasio-adams-asks-agencies-to-tighten-belts-heres-how-much-he-wants-to-cut-1405173.
- Riley Edwards, “PEGging it Right: Guidelines for the PEG Process,” Citizens Budget Commission Blog (March 5, 2019), https://cbcny.org/research/pegging-it-right.