Raising the REDC Bar
Regional Economic Development Councils (REDCs) are New York State’s latest effort to revitalize regional economies. The ten REDCs develop regional job growth strategies, recommend projects for State and local funding, and work to align local initiatives with State development priorities. Since the REDCs’ 2011 inception, the State has allocated $6.2 billion of State grants, tax credits, and other funding—an average of $773 million a year—to businesses and localities throughout the State.[1] The REDCs are an improvement upon the State’s past approaches to revitalizing struggling local economies; redesigning REDC processes could allow them to be more effective models of economic development.
The REDC model is rooted in best practices for successful economic revitalization. By convening local leaders, engaging in long-term planning, and incorporating workforce development, REDCs are able to design effective local economic development strategies. Furthermore, the REDC application process consolidates previously disparate grant programs, reducing bureaucracy for applicants and allowing local strategies to factor into funding allocations.
However, the implementation of REDCs has shortcomings. Many of the projects are unrelated to regional or State economic development strategies. Projects tied to strategies are dispersed among industries and areas within each region such that no single strategy garners the sustained, intensive investment necessary to spur lasting economic growth. Finally, REDC activity is opaque, with inadequate follow-up reporting on each project and inconsistent measures of regional performance.
Building on the Citizens Budget Commission’s (CBC’s) previous work and work commissioned for a December 2018 conference on overcoming regional economic stagnation, this report assesses REDC design and implementation based on best practices identified through case studies of successful local revitalization efforts in the U.S.[2] New York’s REDC program should be modified to enhance REDCs’ ability to strengthen their regional economies:
- All projects funded through the REDC process should align with the long-term economic development strategies with the greatest likelihood of spurring job growth in regional population centers;
- REDCs’ project assessments should be a greater factor in funding decisions in order to increase adherence to regional strategies; and
- REDCs should use uniform metrics to report the progress of individual projects and overall regional performance, with an aggregated report of all statewide activity.
OVERVIEW OF ECONOMIC DEVELOPMENT SPENDING IN NEW YORK STATE
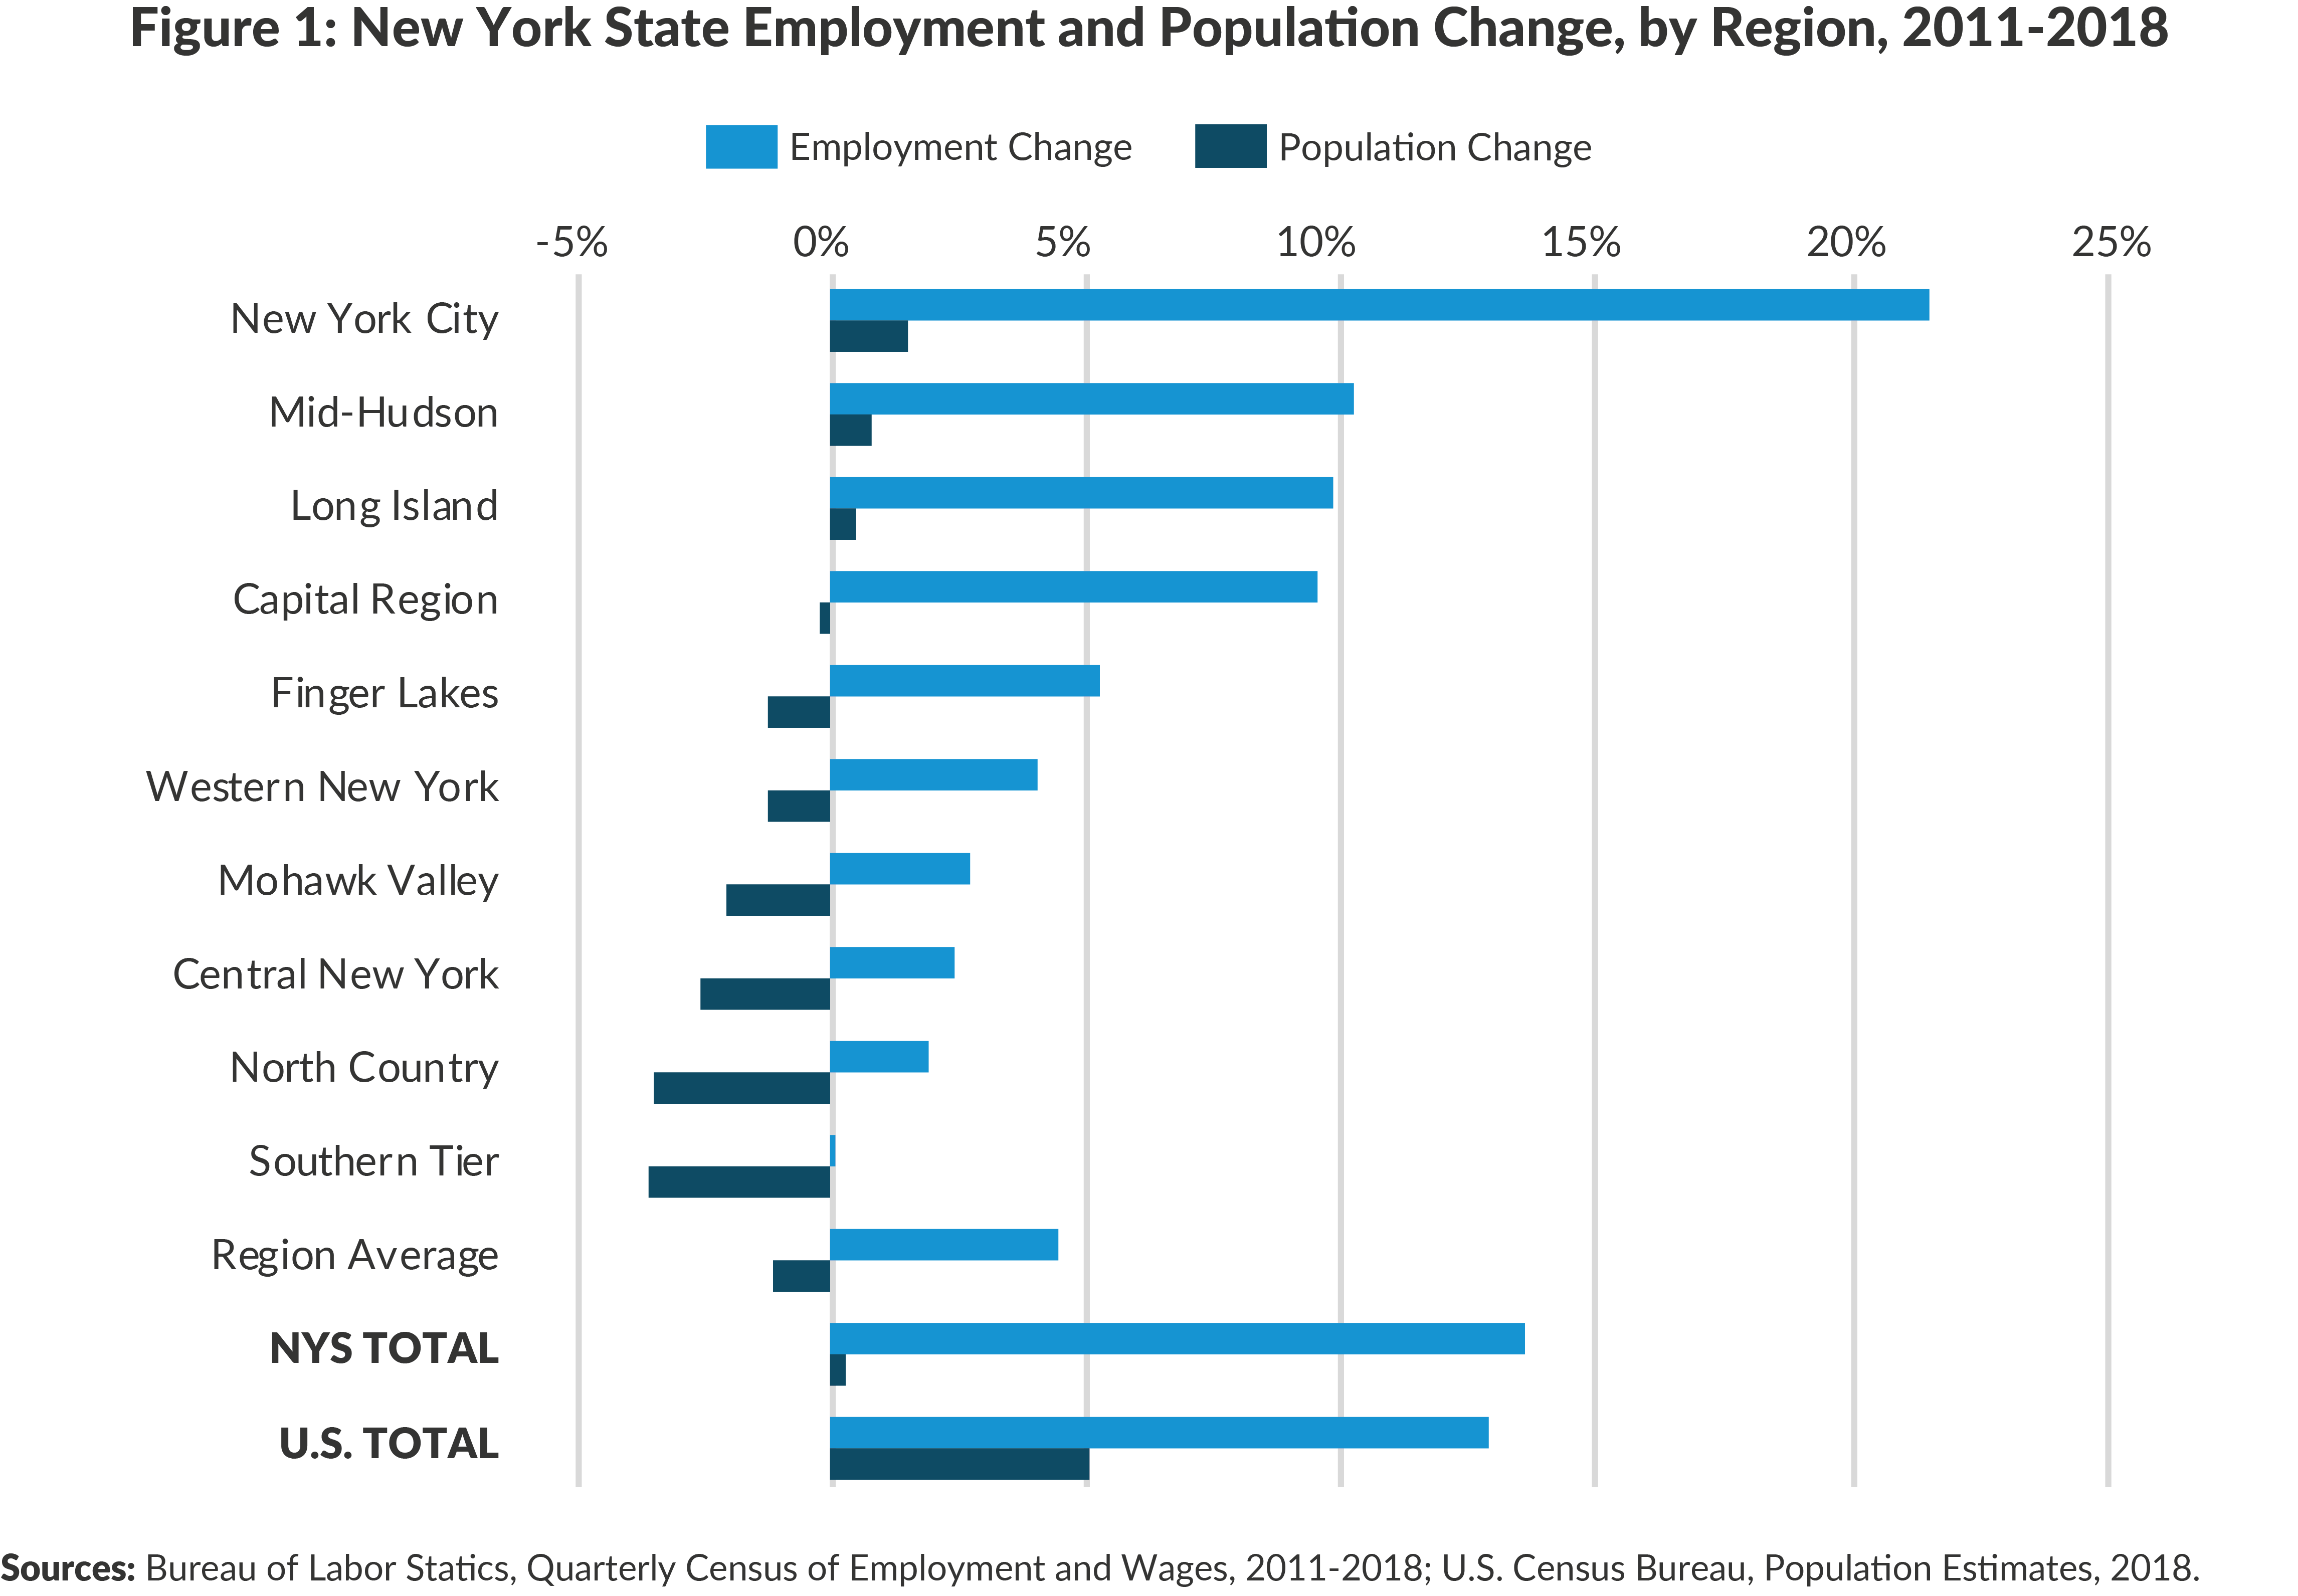
Job creation is an urgent challenge for many regions in New York State. While the State’s job growth has kept pace with national trends since 2011, gains have been concentrated in the downstate area and Capital region, with slow or stagnant growth plaguing much of upstate. (See Figure 1.) Spurring job growth in struggling regions is a key priority of the Cuomo Administration. Since 2010 State spending on economic development—in direct expenditures and forgone tax revenue—has risen 57 percent, reaching $4.4 billion in 2018.3
Tax expenditures—tax breaks provided as incentives to businesses to spur economic development—are a larger share of the State’s economic development efforts than direct spending. In 2018 State economic development-related tax expenditures totaled $2.5 billion—58 percent of all State economic development costs. The largest tax expenditures were sales tax breaks for spending related to research and development and industrial production. Other major tax expenditure programs include tax credits for film production and the Excelsior Jobs program, which provides tax credits to firms creating jobs in target industries and is a successor to the Empire Zone program.4
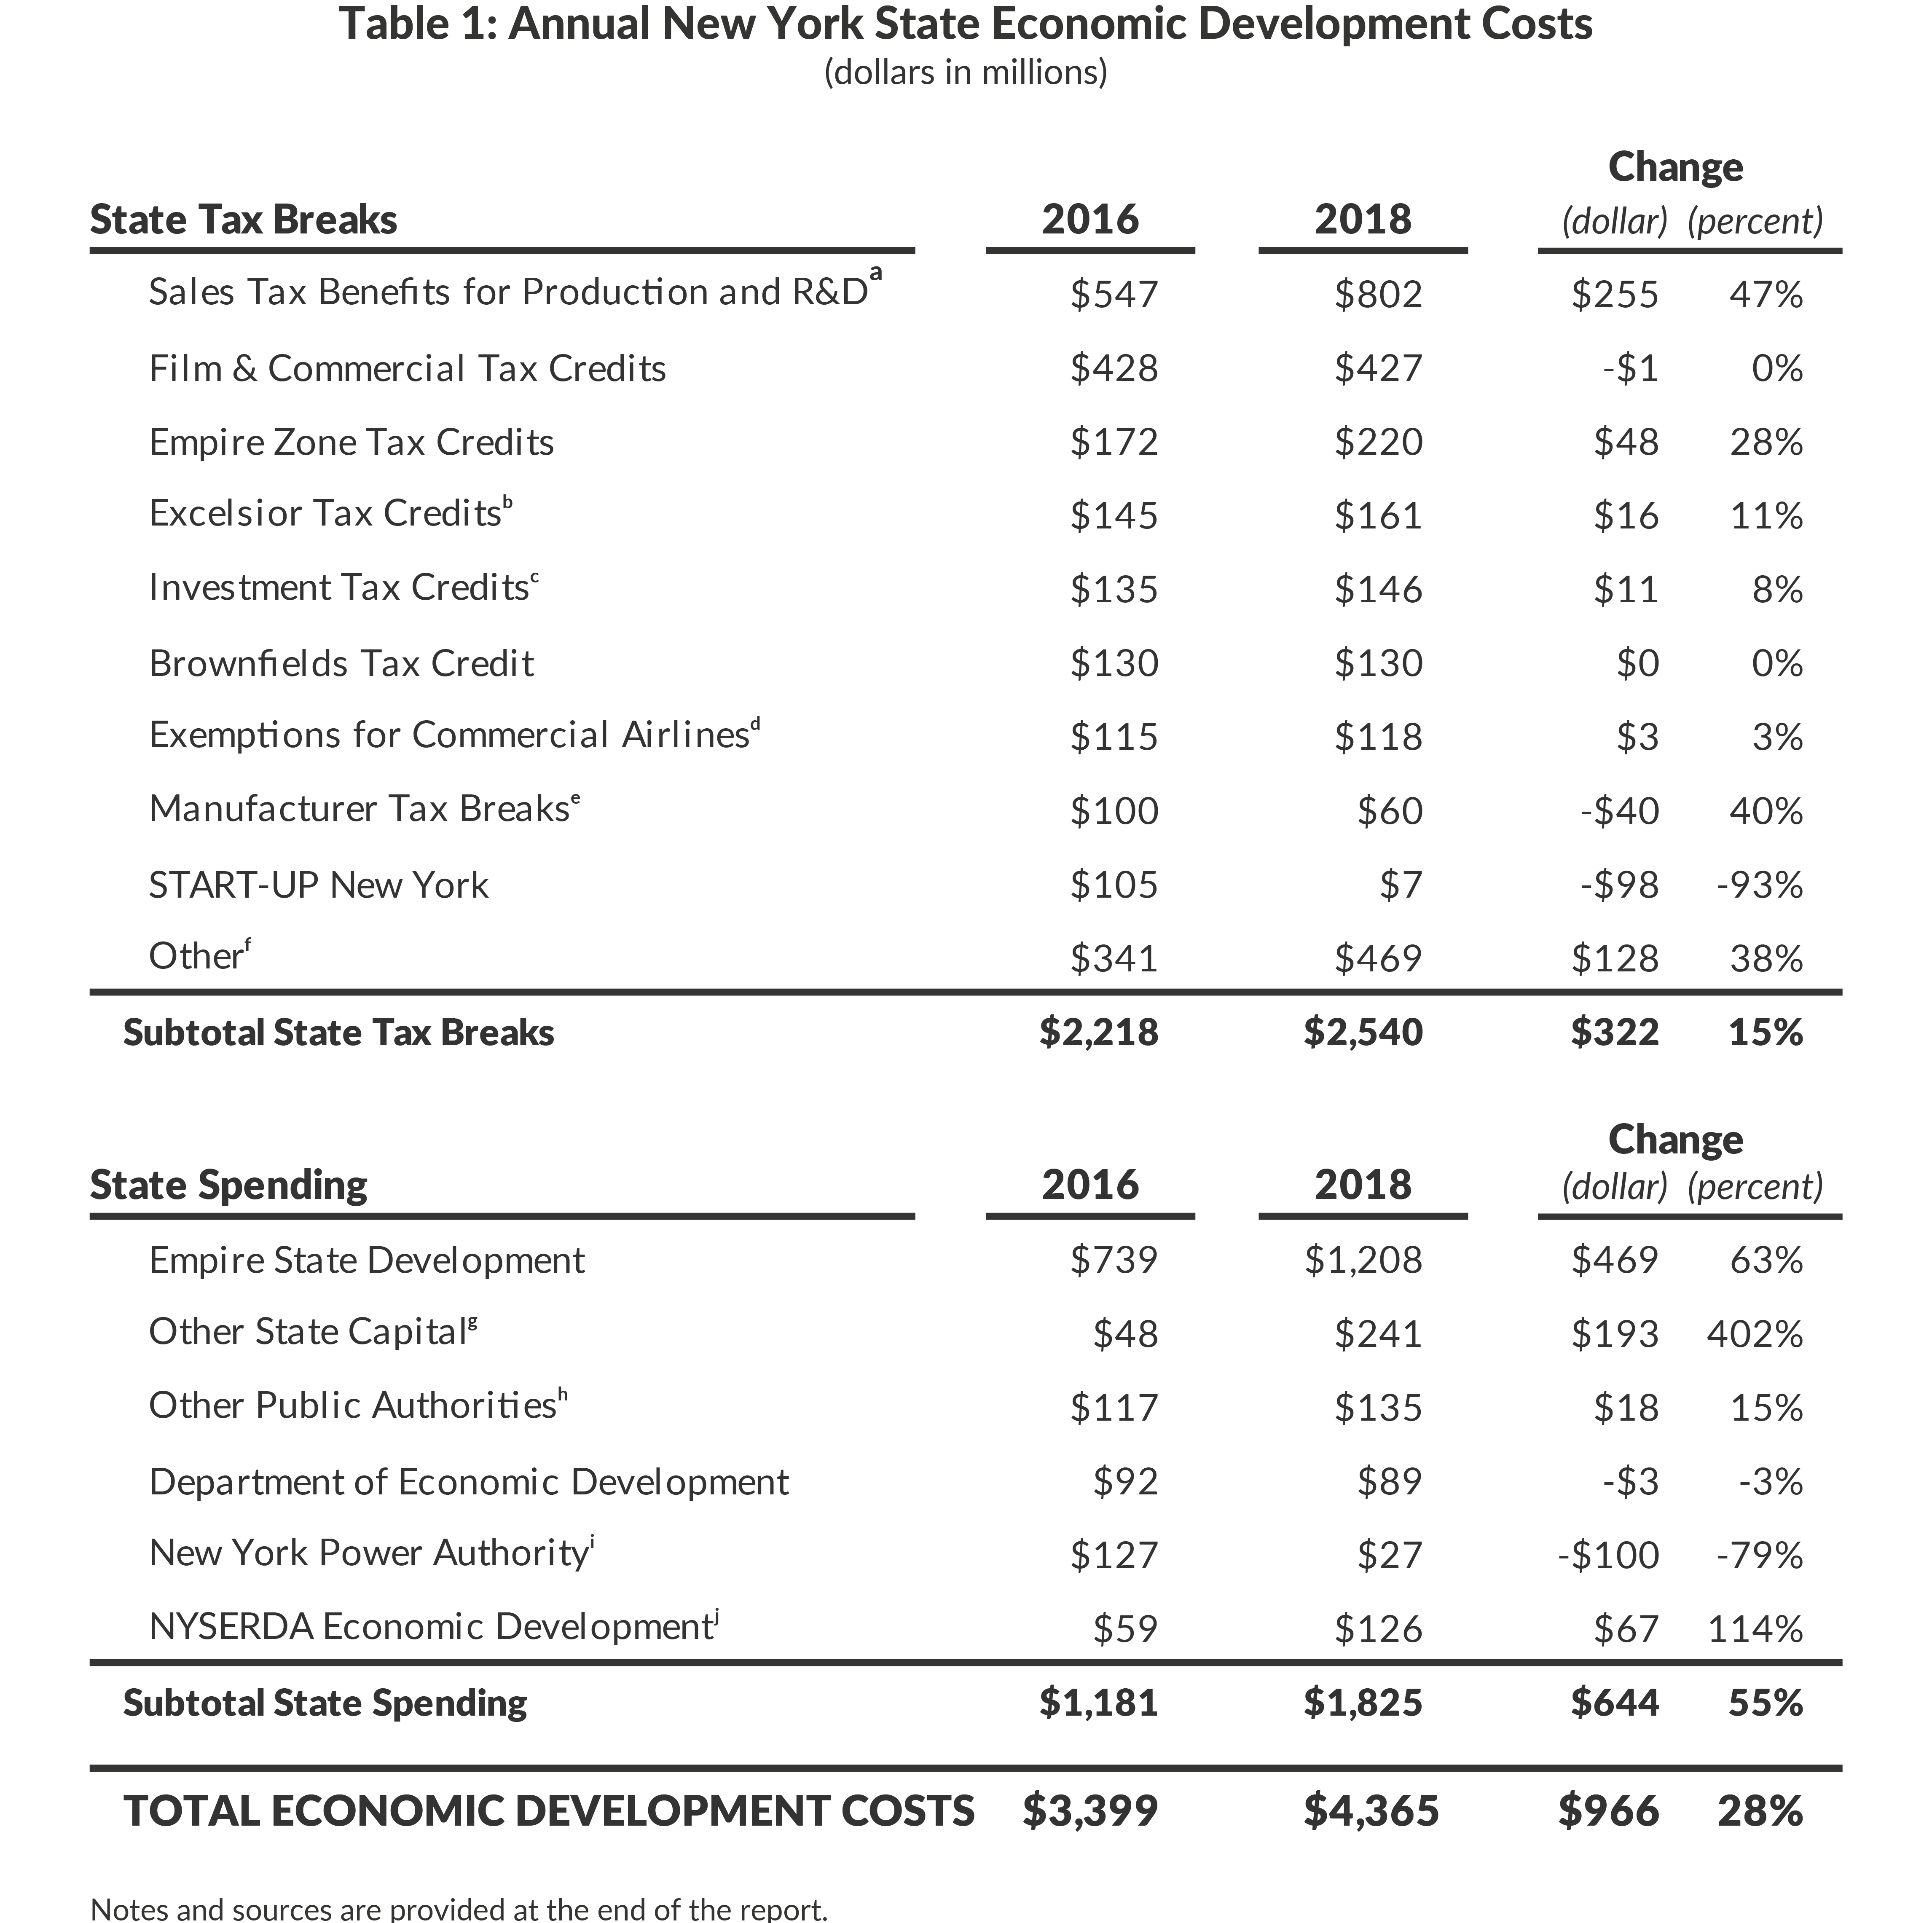
In 2018 State economic development direct spending totaled $1.8 billion. The Empire State Development Corporation (ESD), the State’s primary economic development agency, accounted for two-thirds of State economic development spending. ESD is responsible for many of the State’s major economic development efforts and capital investments, including the “Buffalo Billion,” the Upstate Revitalization Initiative, Moynihan Station reconstruction, and the Javits Center expansion. In addition to these major projects, ESD administers the Excelsior Jobs program and other tax incentives, and provides business support services, including technical assistance and access to financing, to firms in priority industries including life sciences, innovative technology, and manufacturing.
OVERVIEW OF THE REGIONAL ECONOMIC DEVELOPMENT COUNCILS
REDC members, all appointed by the Governor, include regional leaders in business, higher education, and labor. Regional elected officials, including county executives, local legislators, and mayors, serve ex-officio as nonvoting members. In the first operating year of the program, each REDC produced a five-year plan that outlined the region’s resources, goals, and overall economic development strategy. Each REDC publishes an annual report on past projects and nominates new projects for funding. Annual progress reports contain some updates to plans, but revisions to the initial five-year plans have not been published.
REDC funding and statewide economic development spending cannot be compared to each other. REDCs provide a mechanism to allocate funds from other State agencies, with many funding projects not related to economic development. Many of these projects—including engineering studies funded through the Department of Environmental Conservation (DEC)—may relate to quality of life and infrastructure concerns, but are not considered economic development and are not captured in the figures presented in Table 1. Furthermore, REDCs only provide data on the funding awarded to projects, not actual spending. Not all funding awarded through REDCs is spent, since some projects fail to launch or are scaled back.
The REDC process
REDCs evaluate projects submitted on the Consolidated Funding Application (CFA), an application for funding from multiple State agencies that replaced a previously disparate patchwork of grant applications. The REDCs and State funding agency evaluate each application simultaneously. CFA assessments focus on determining a project’s potential to advance economic development strategies. REDCs’ CFA assessments are worth 20 percent of the overall score while those of the State funding agencies are worth 80 percent. An REDC may designate applications as priority projects based on their alignment with an economic development strategy.
All regions receive ESD capital grants and tax credits through the CFA, which culminates in an annual award ceremony each December, which features report presentations and updates to projects and regional strategies. As part of the CFA evaluation process, the Strategic Implementation Assessment Team (SIAT), which includes heads of key State agencies, assesses each REDC’s progress toward their regional and State economic development strategies. Regions that the SIAT determines to be top performers receive additional ESD funding, allowing more CFA projects in those regions to advance.
In addition to the funding distributed based on the CFAs, the REDCs also recommend projects for the Upstate Revitalization Initiative (URI) and Downtown Revitalization Initiative (DRI). In 2015 the URI awarded $1.5 billion, funded by the State’s litigation settlements with various financial institutions following the 2008 recession.5 The URI created a competition outside the standard annual awards cycle. Seven of the State’s upstate regions developed revitalization plans outlining how they would use $500 million, payable over five years, to accelerate regional job growth.6 Central New York, Finger Lakes, and Southern Tier were selected as winners.7 As of August 2019 only $368 million of the program’s $1.5 billion allocation has been spent statewide, suggesting that URI spending may be behind schedule.8
Since 2016 each of the State’s 10 regions has received $10 million annually as part of the DRI. Every year each REDC selects a defined geographic area, which then undergoes a local planning process to identify revitalization projects for program funding.9
Composition of REDC awards
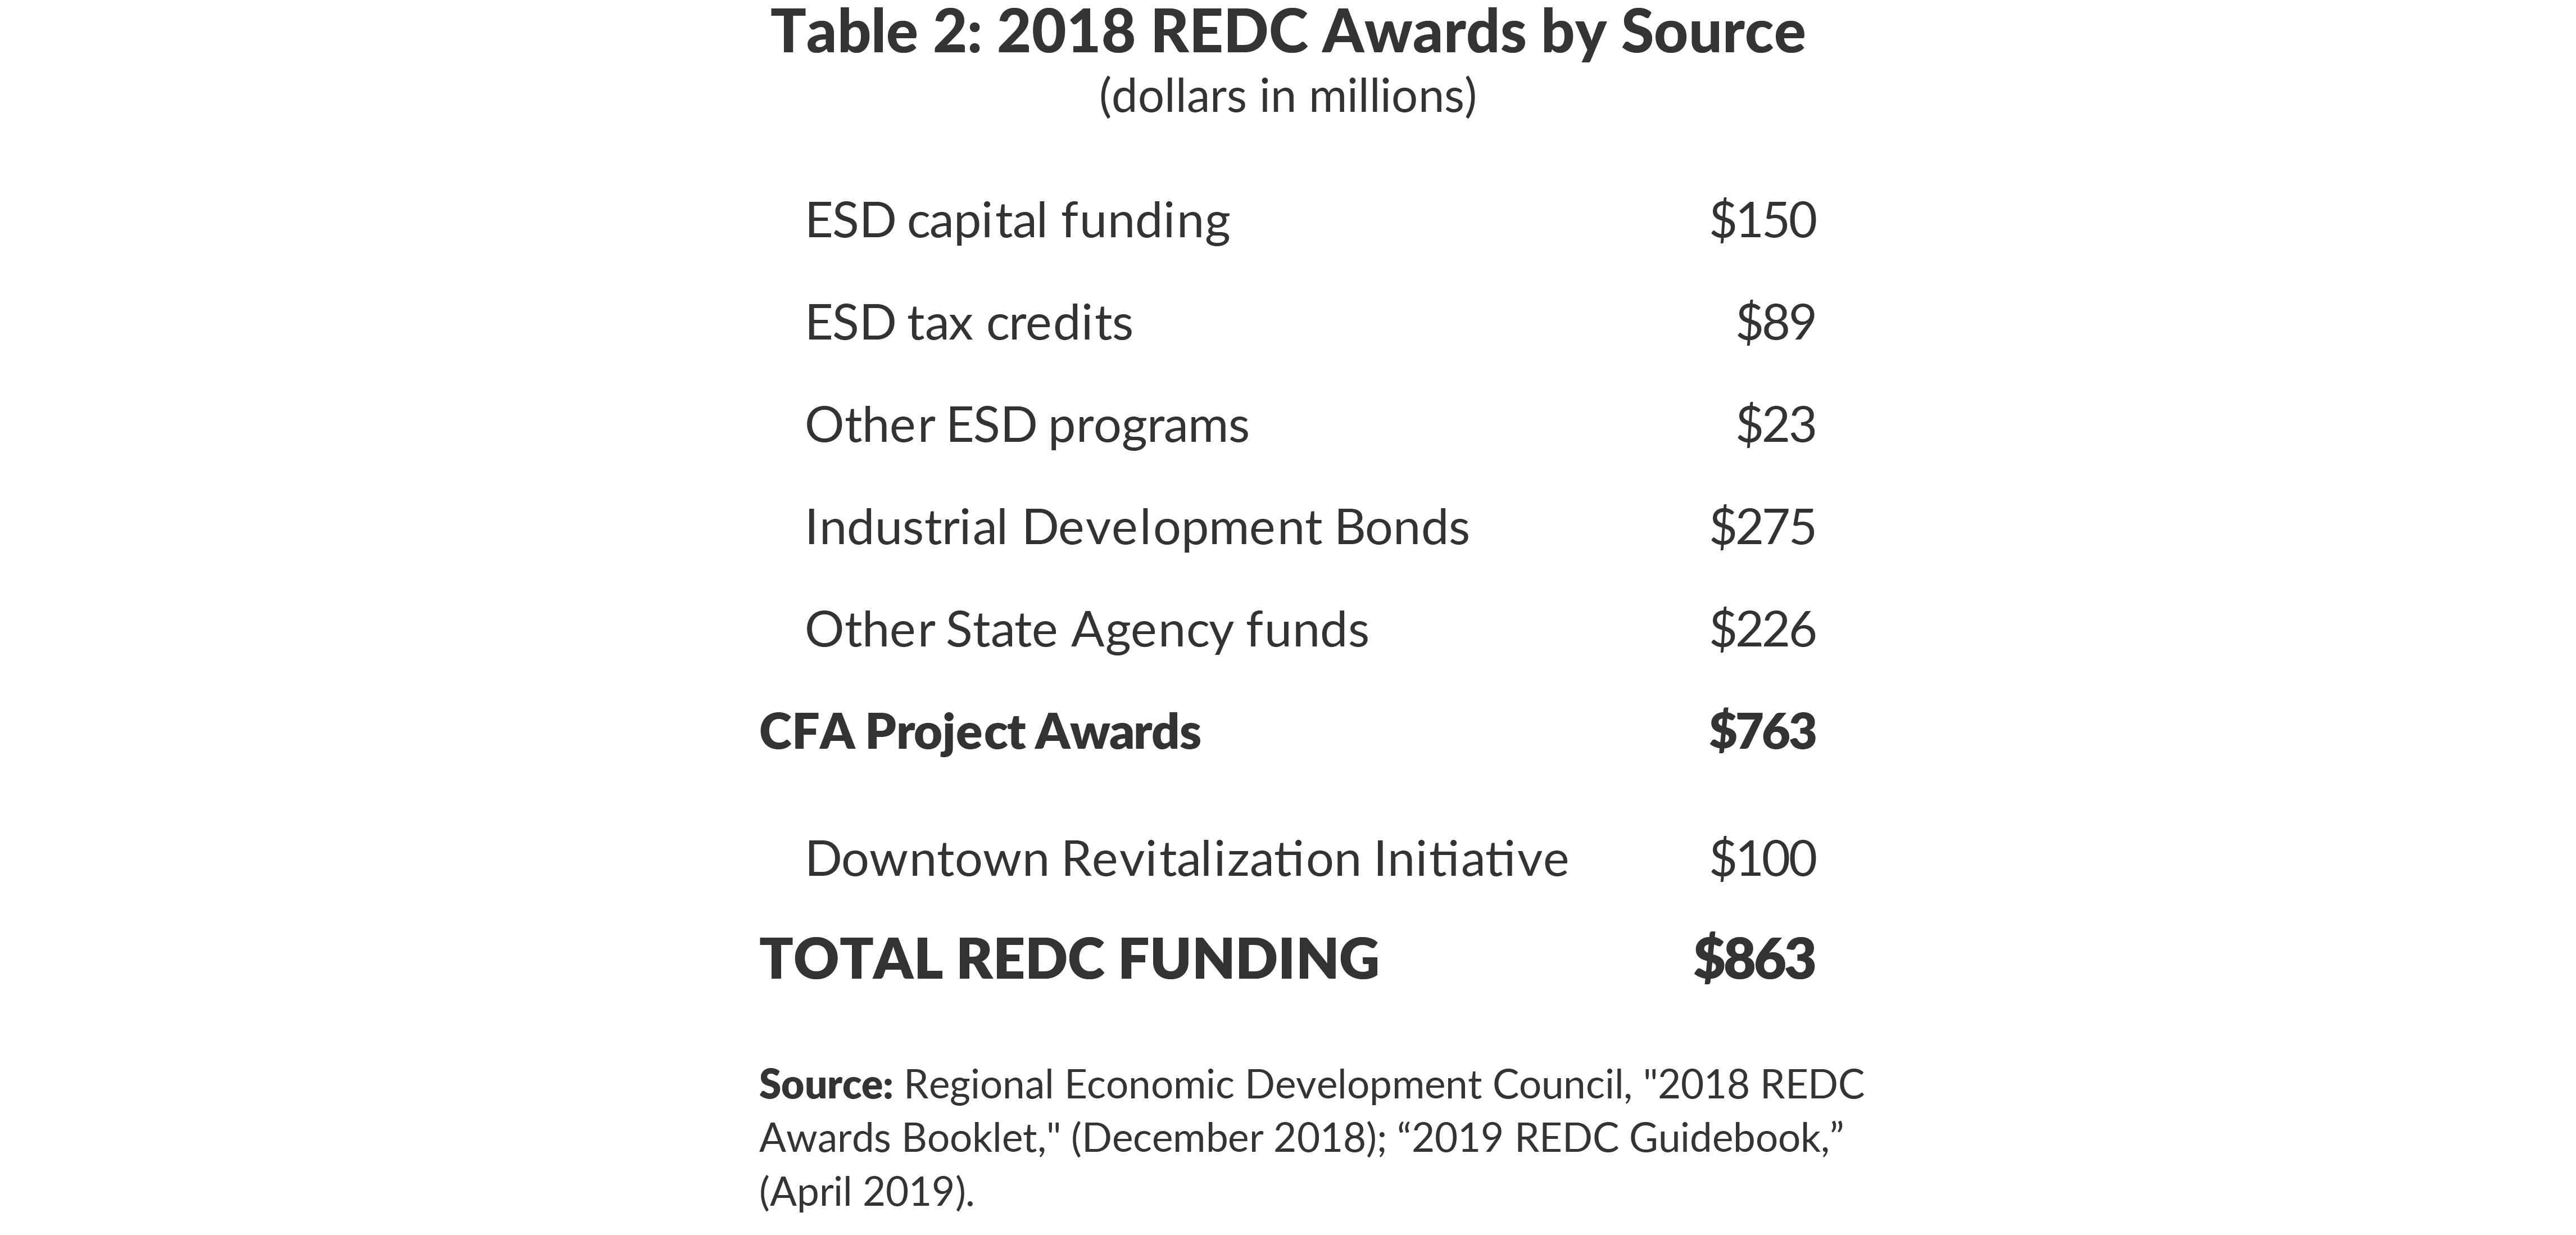
The State has awarded $773 million annually on average through REDCs. In 2018 projects received $763 million through the CFA process and an additional $100 million through the DRI.10 (See Table 2.) Statewide awards allocated through the CFA have been relatively stable over the program’s eight years.11 Expansions to the REDC funding have tended to take the form of statewide initiatives, including the URI and DRI. ESD is the single largest source of REDC funding offering grants, largely for infrastructure or other local capital projects, and tax credits, as well as other programs designed to support local businesses and governments. ESD further allocates authority to issue industrial development bonds to regions’ industrial development authorities to finance private sector investments. The REDC awards process apportions New York’s federal cap on these tax-exempt bonds to the regions.
In addition, other State agencies participating in the CFA awarded $226 million in 2018. These agencies included the Department of Environmental Conservation, the Office of Parks, Recreation and Historic Preservation, and the Office of Community Renewal, all of which provide aid to localities investing in infrastructure or other capital improvements, especially water management and the rehabilitation of historic buildings to support tourism or business.
Regional distribution of REDC awards
Since 2011 the REDC process has resulted in similar levels of funding, with 7 of the 10 regions receiving awards within 5 percent of the cumulative regional average. However, two regions received substantially less than their peers: awards for Western New York and New York City are 12 percent less than the regional average since 2011. However, the regions differ sharply. Western New York is the beneficiary of the “Buffalo Billion,” a $1.5 billion economic development effort administered by ESD, the centerpiece of which was a $959 million SolarCity plant.12 Buffalo Billion funds were distributed outside the REDC process. New York City has only won the regional competition once; however, its economy is the strongest in the state. Every region has won the regional competition at least once (between three and five regions win each year). Central New York has won the most regional competitions—6 of the 8 between 2011 and 2018—and leads in total funding awarded through the REDCs, with a cumulative award value 14 percent above the regional average. The two regions with the highest CFA awards—Central New York and the Finger Lakes—also won $500 million as part of the URI, pushing their totals far higher than any other regions. Southern Tier, the third URI winner, has received a slightly below-average amount of CFA awards since 2011.
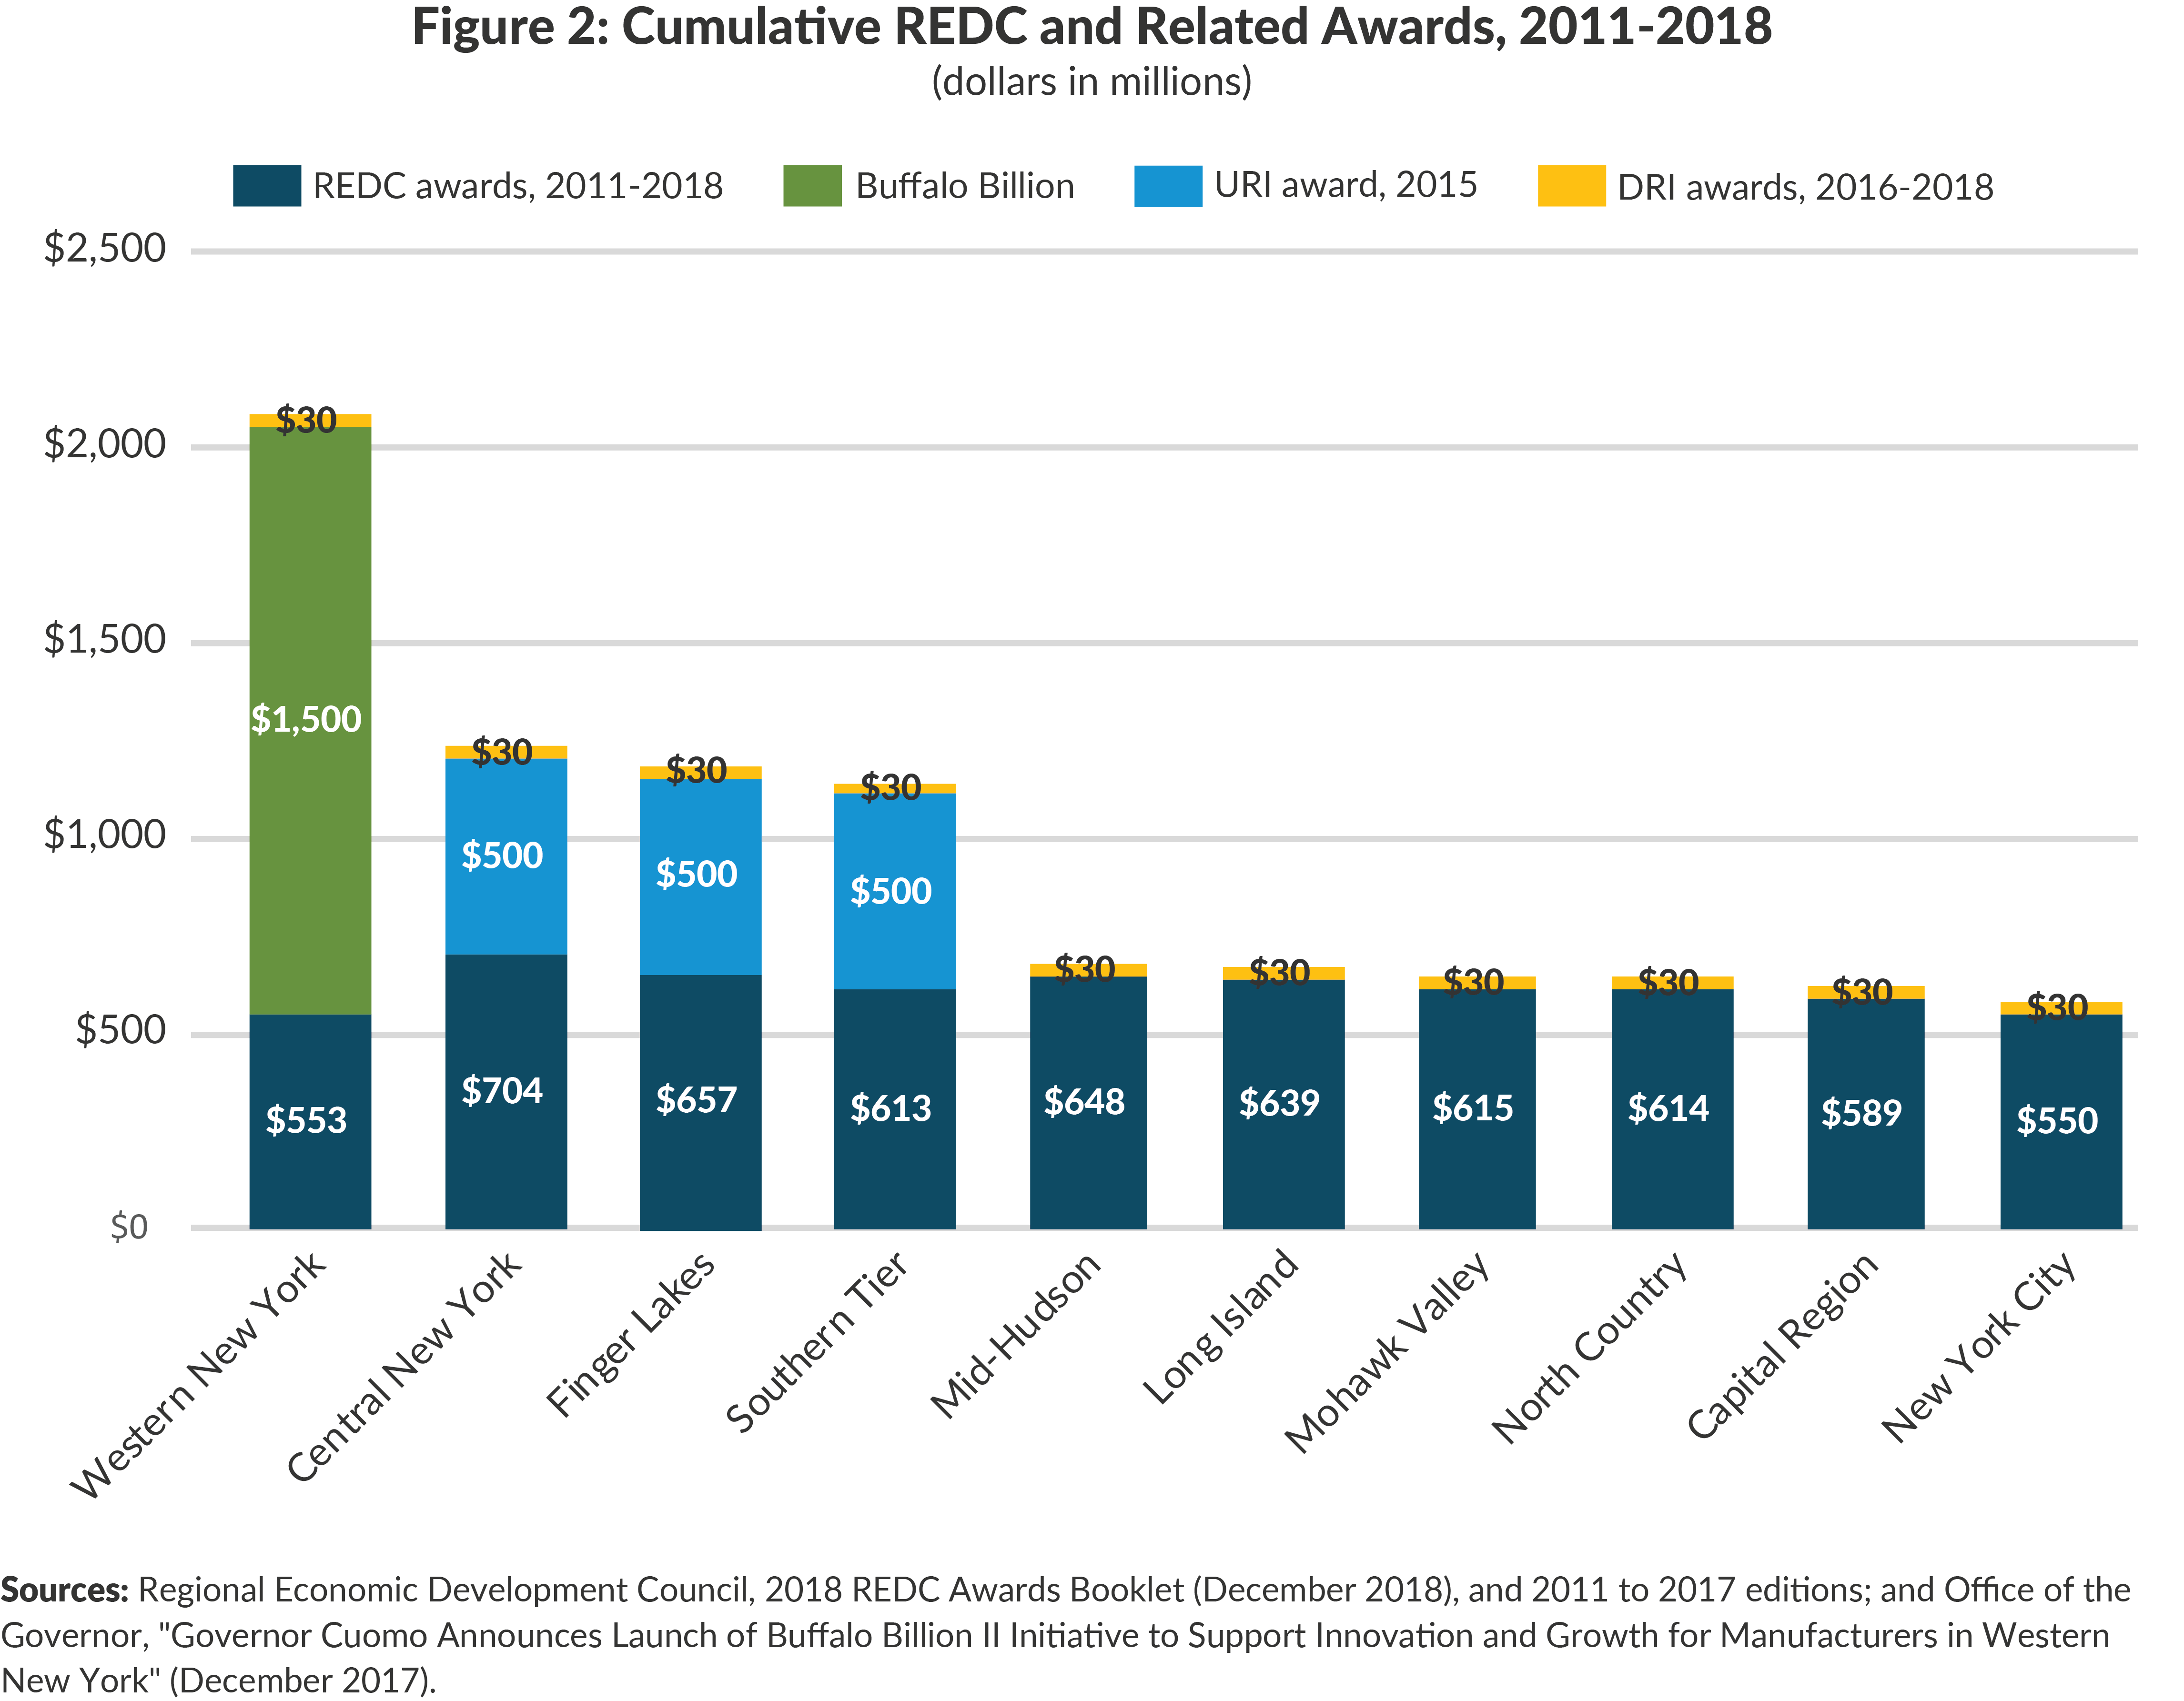
The CFA grant programs that fund REDC projects are not designed to favor particular regions of New York State. Nevertheless, economically struggling regions have garnered the most funding per resident. Four regions have received considerably higher funding per resident: North Country, Mohawk Valley, Southern Tier, and Central New York all had per-resident awards far higher than the regional average of $667. Employment in these four regions has grown at the lowest rates statewide over the same period. These regions have also experienced population loss since 2011.
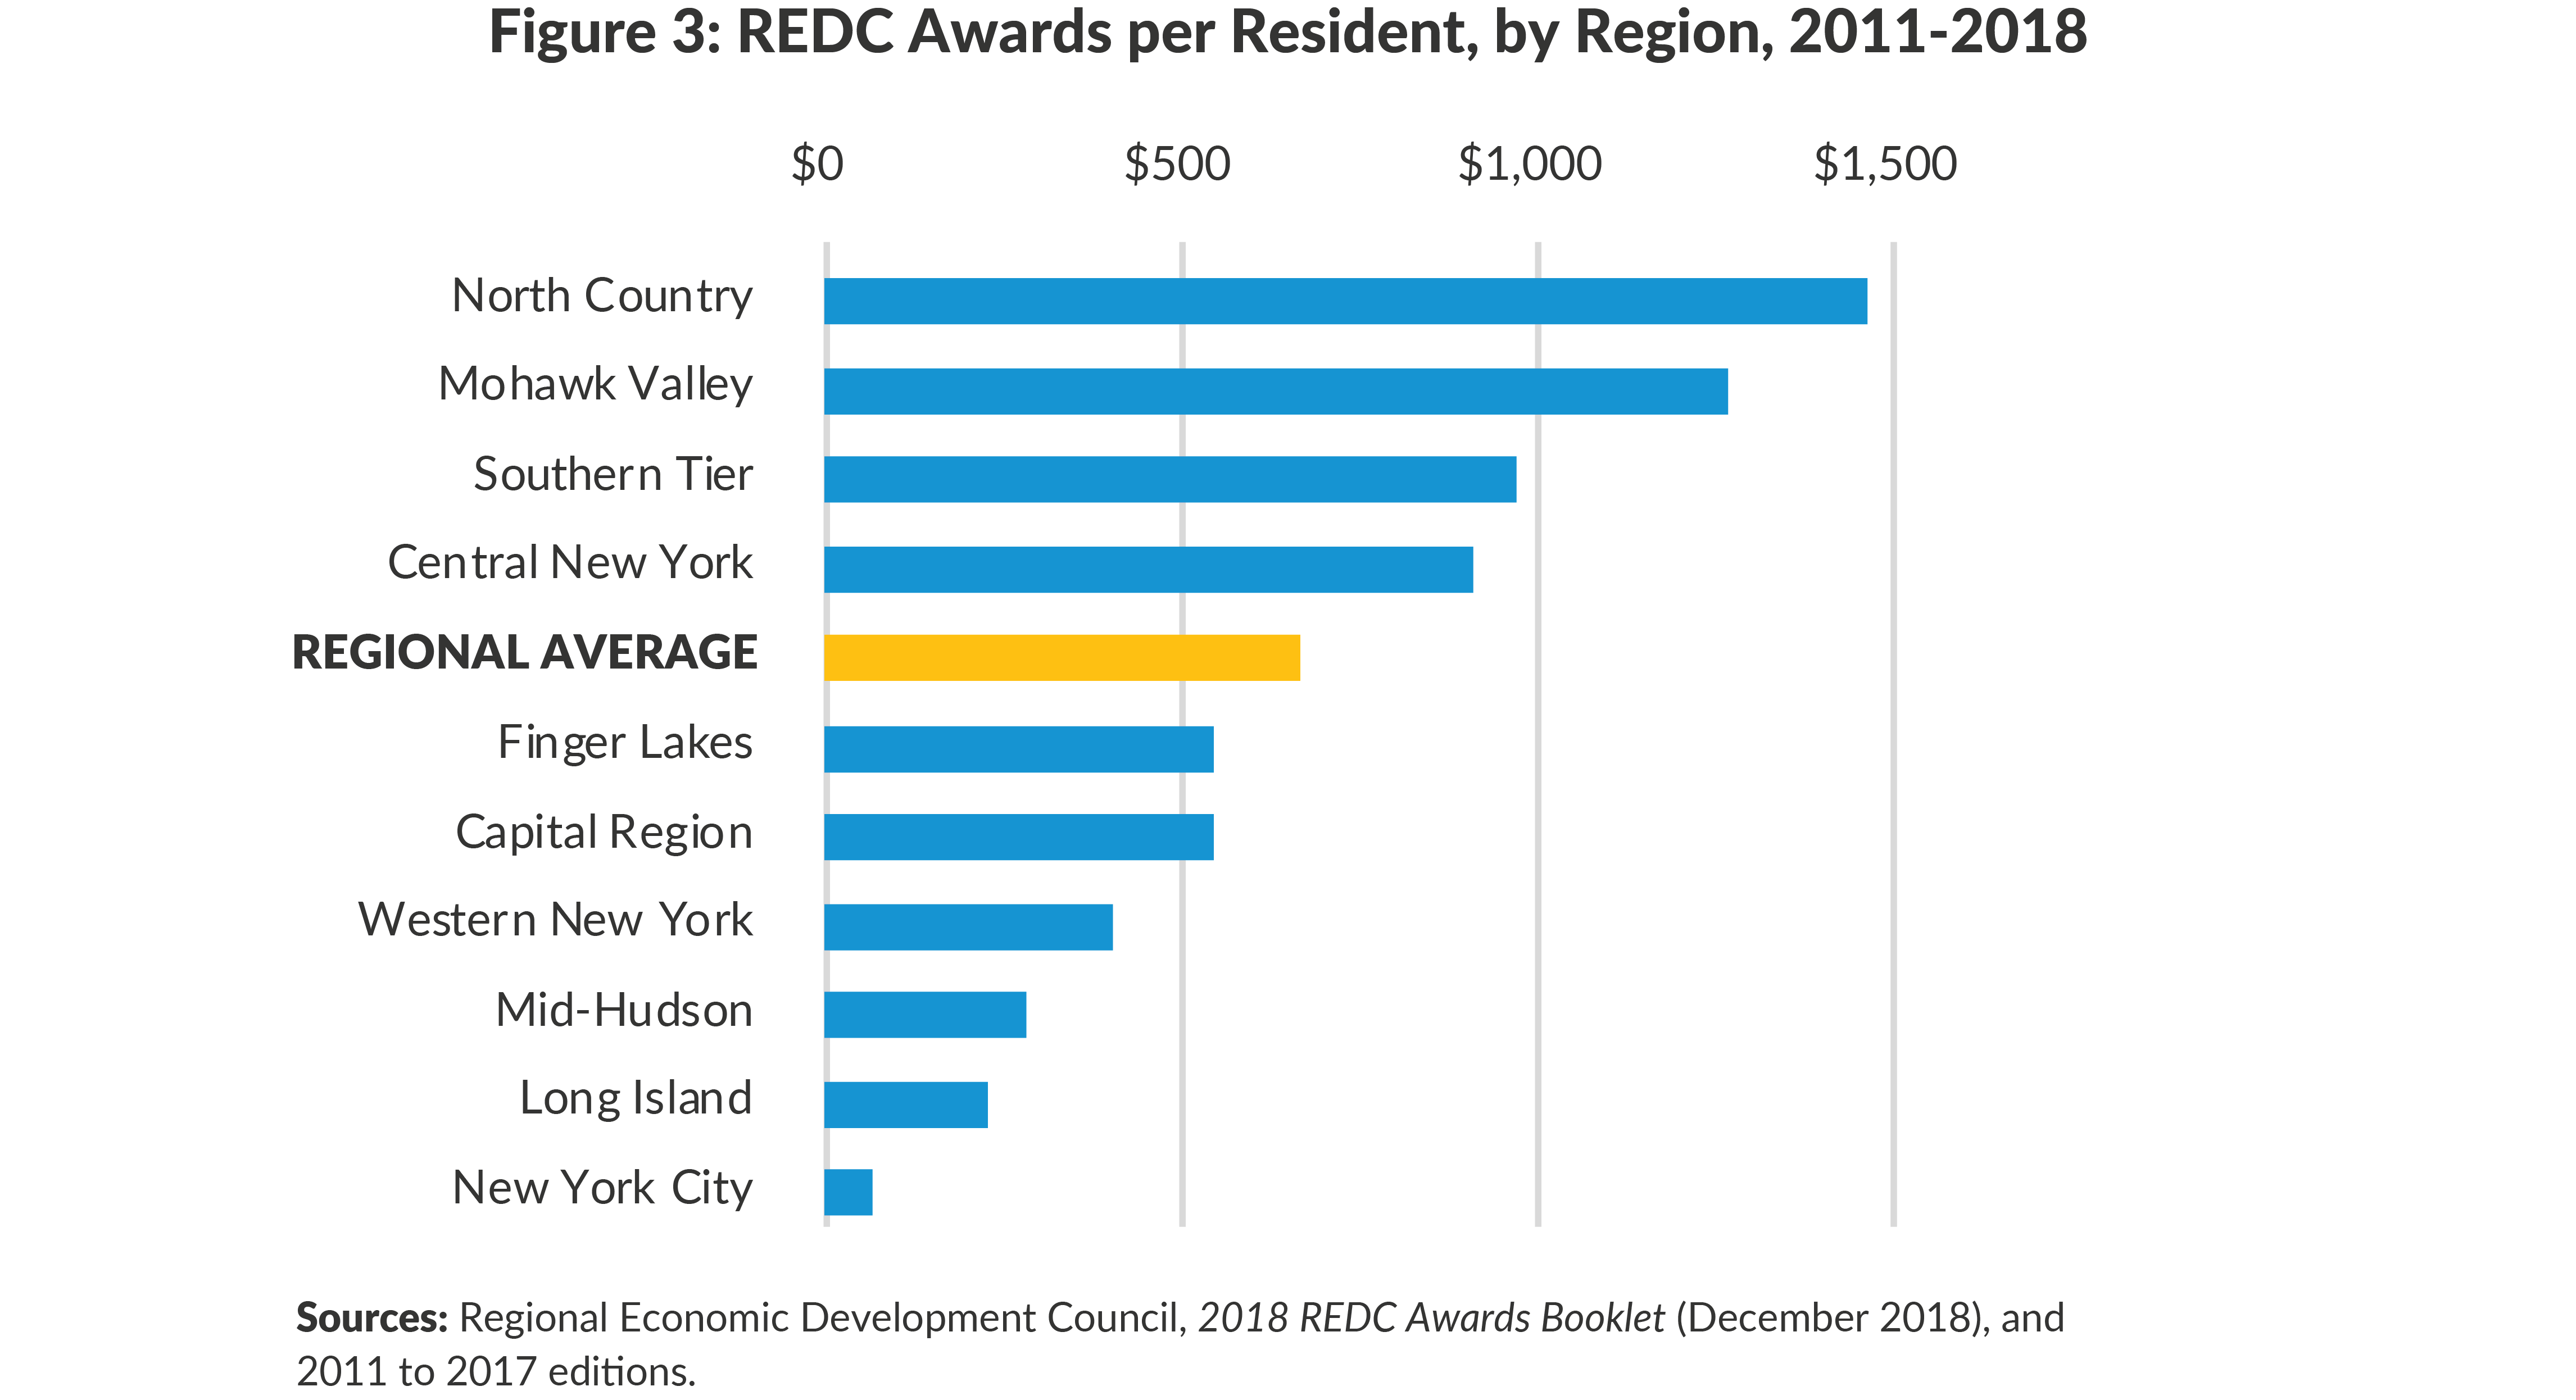
The State’s job and population growth has primarily occurred downstate and through the Hudson Valley to the Capital Region.13 These regions have received less REDC funding relative to their populations. New York City only received $65 per resident in REDC awards since 2011—far lower than the next lowest-funded region (Long Island received $225 per resident) and about one-tenth of the regional average. New York’s upstate regions were struggling economically prior to 2011; it is difficult to determine whether they would have experienced greater population loss and slower job growth if not for the increase in local economic development spending. Nevertheless, higher award values per resident have not yet translated into job or population growth.
THE REDC MODEL’S POTENTIAL
REDCs have the potential to improve the State’s economic development efforts. The REDC design follows best practices employed by successful economic revitalizations in regions similar to those struggling in New York. To explore more effective ways for the State to stimulate economic development in lagging regions, CBC commissioned Dr. Michael Wasylenko to investigate successful cases of economic turnarounds in struggling post-industrial economies similar to those of upstate New York.14 The following analysis draws on that research, which is summarized in Appendices A and B.
The REDC planning process, convening of local leaders, and focus on workforce development are vital parts of any successful economic development program. By streamlining applications for funding through the CFA, the strategies developed by REDCs factor into the allocation of previously unrelated State funding sources.15 Further, by consolidating these allocations, funding awards have become easier to track.
REDCs engage in long-term planning
When the REDCs were created, they developed five-year strategic plans identifying regional economic stresses and existing resources available to support job growth. New York City and its neighboring regions focused on affordability for businesses and residents, while many upstate regions highlighted the economic strains of populations that were slow-growing, aging, and less educated. The regional plans identified engines for job growth—including public and private universities, along with medical research centers, laboratories, and existing university networks—as well as burgeoning industry clusters, including green energy in the Southern Tier, biotechnology in Mid-Hudson, and advanced healthcare in Finger Lakes. Regions across the State commonly cited tourism and advanced manufacturing as opportunities for growth.16 In addition to broad vision statements, the plans formed the basis of the annual reports and outlined key projects to anchor economic development efforts.17
REDCs are led by local stakeholders
REDCs’ local leadership positions them to identify local industries ripe for investment. Each REDC includes at least one leader of a flagship university, an official representing labor, and owners of prominent regional businesses. The inclusion of university officials and research organizations is key in ensuring implementation support from these institutions. In addition to these appointed members, REDCs include ex-officio elected officials from each region, including county executives and leaders of county legislatures. REDCs’ relatively stable memberships also serve as institutional memory to provide continuity and ensure commitment to long-term strategies.
REDCs incorporate workforce development
Regional strategic plans highlight the role workforce development plays in economic growth. The emerging, skill-intensive industries that regions identified as having the highest potential to create good jobs require workers with relevant training. Without workforce investments, many workers may be left behind by economic change, as legacy industries continue to stagnate. To address job-training needs, the State designated $175 million in 2019 for its Workforce Development Initiative (WDI), which was incorporated into the CFA. This funding expands on the regional workforce development programming already built into REDCs. In 2018, the State’s Department of Labor funded 121 workforce training projects totaling $10 million through REDCs.18
SHORTCOMINGS OF REDC IMPLEMENTATION
While REDCs’ design holds promise as a model for regional economic development in New York State, aspects of both their structure and implementation suffer from shortcomings.
Diversions from regional strategies are frequent
Despite the planning and scoring processes, which were designed to allocate resources to the highest priority investments, award decisions often are not tied to regional or State economic development strategies. CBC staff used publicly available project descriptions to analyze CFA-funded projects’ alignment with either regional or State strategies. Neither State reports nor the REDCs’ regional annual reports directly link all funding awards to State or regional strategies. In recent years, regional annual reports include discussions of projects funded under each regional strategy, but award amounts are not clearly detailed and not all funded projects are listed under a strategy. The regional reports include a crosswalk detailing how priority projects and regionally significant projects correspond to State and regional strategies. They do not, however, provide the same crosswalk for all other projects that receive State funding through the REDCs’ process.
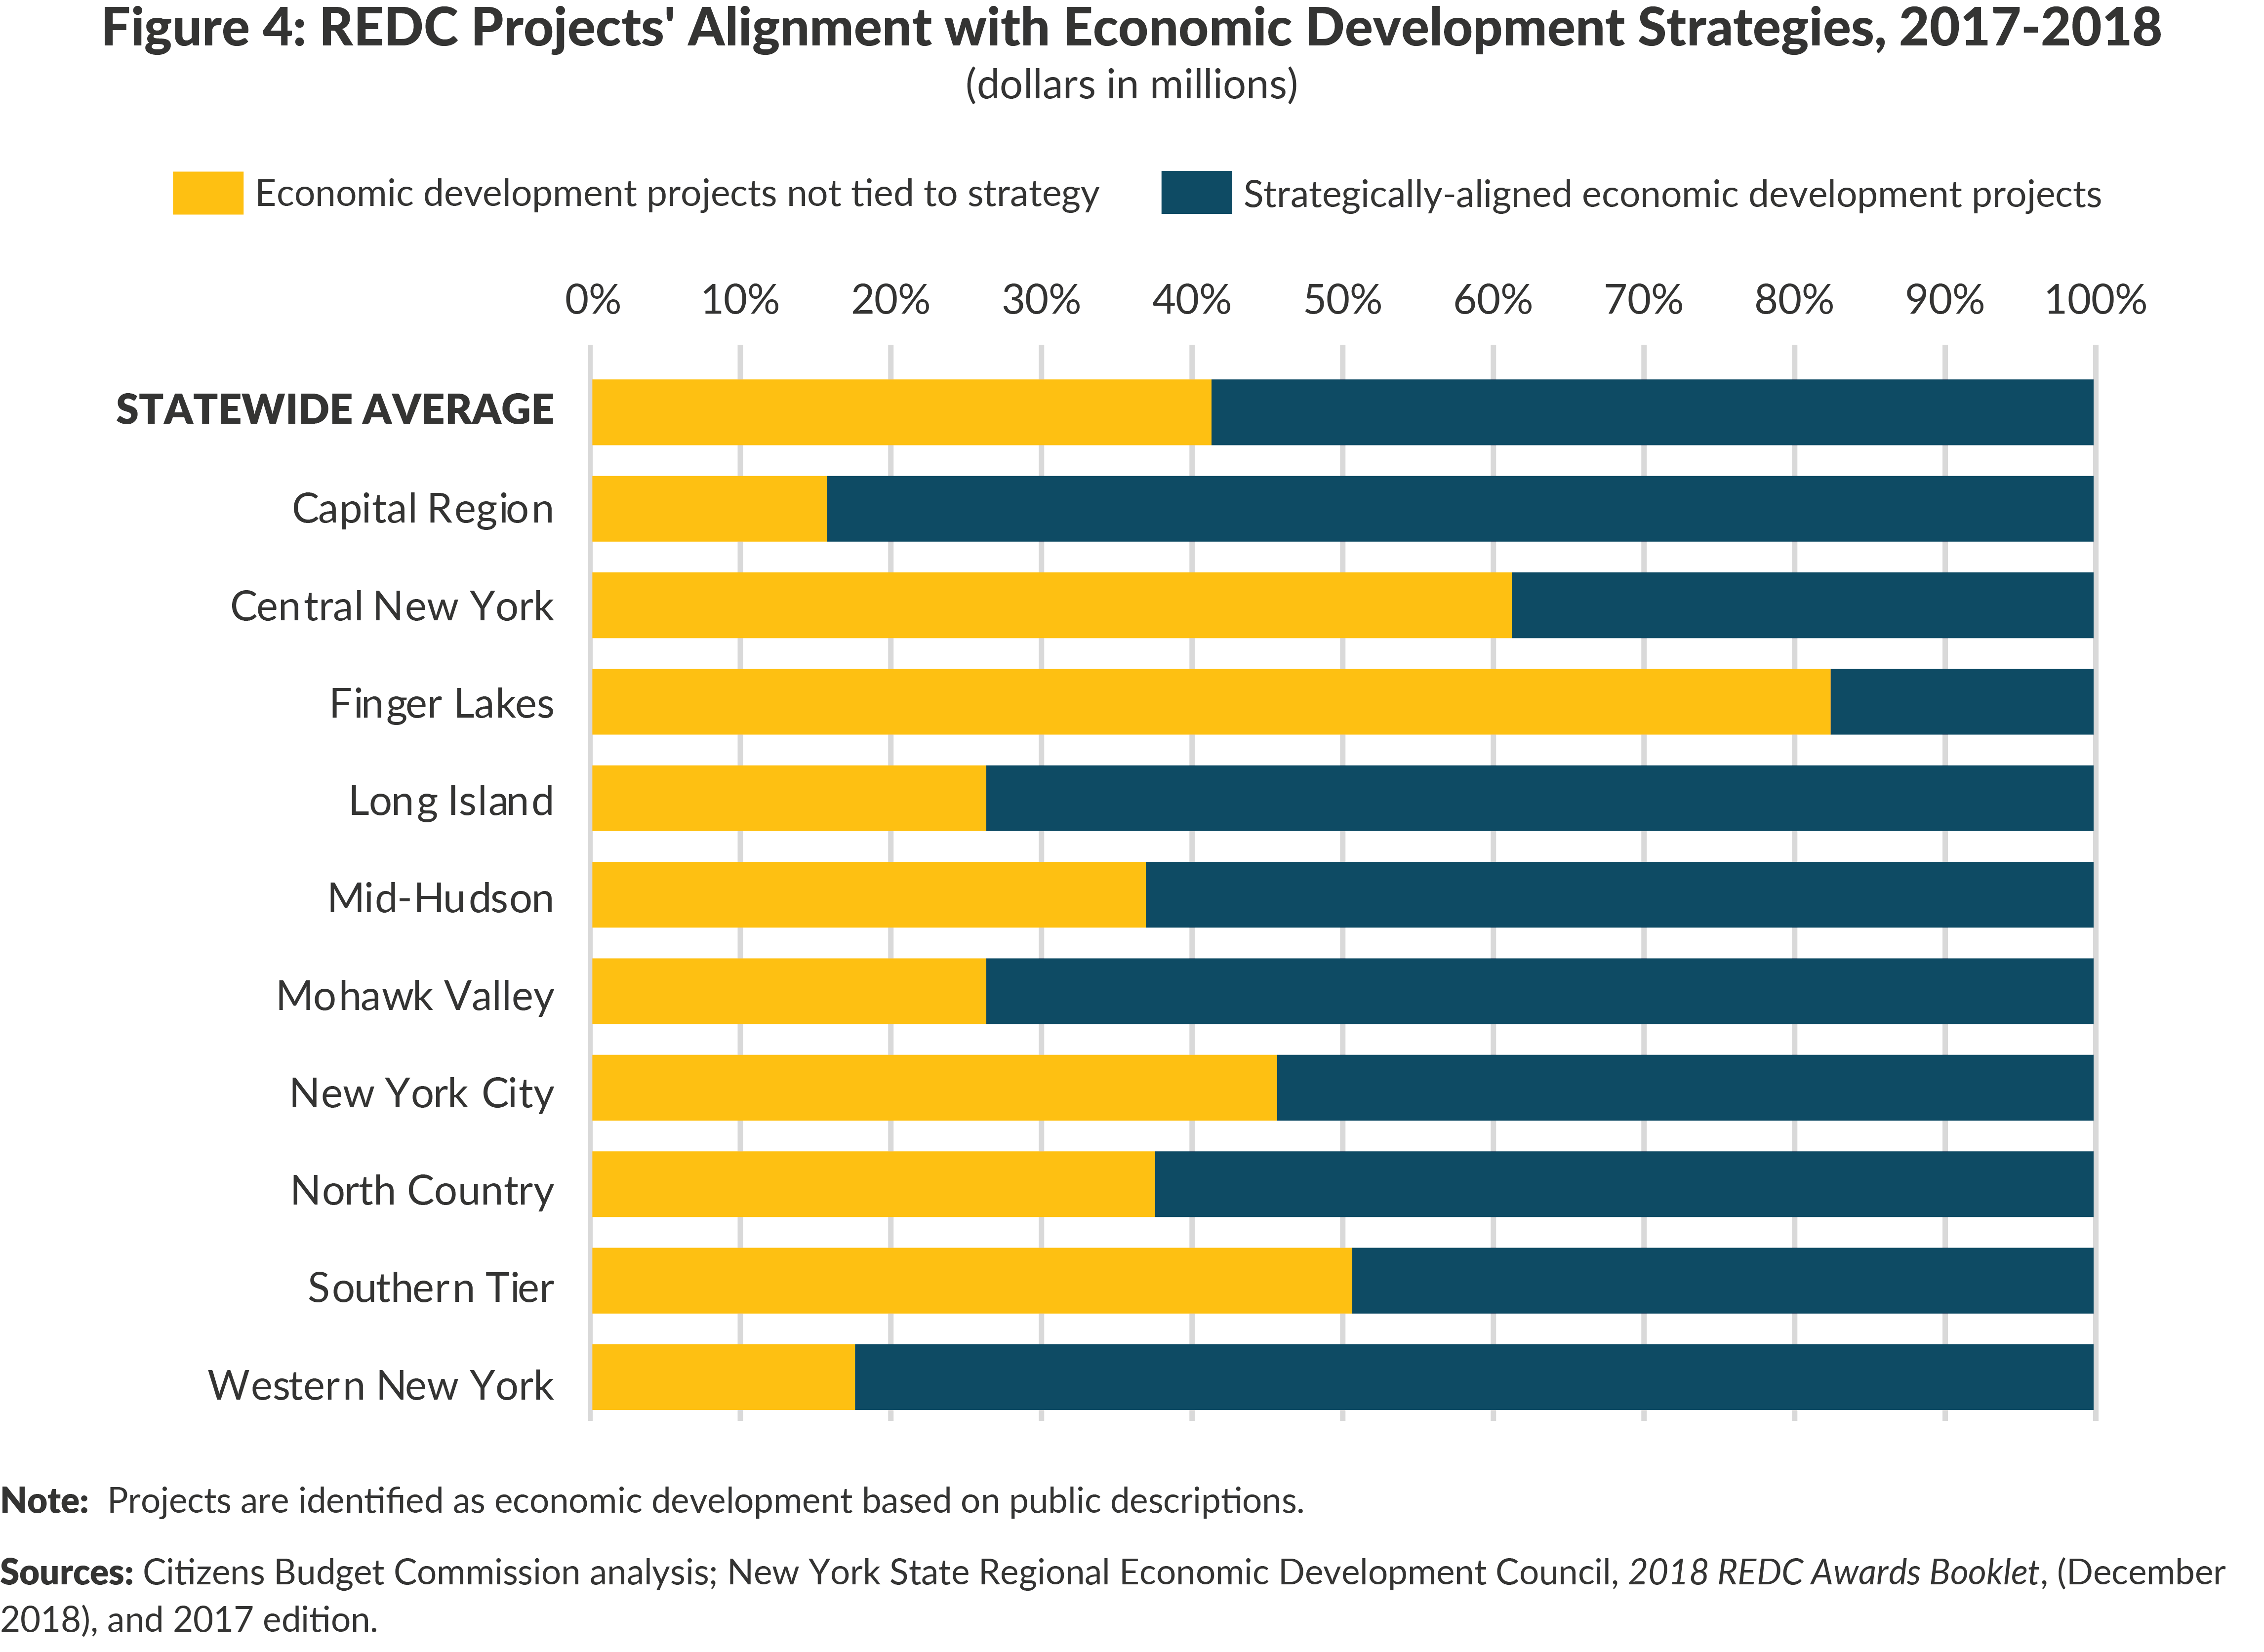
REDCs also draw on grants from agencies like DEC and the New York State Council on Arts that are not directly involved in the State’s economic development efforts; therefore, not all REDC projects focus on economic development. CBC’s analysis showed that over half of the 2017 and 2018 REDC projects related to economic development. DRI and URI projects were not included in this analysis; insufficient information is available for these projects.
Of the 1,090 economic development projects funded in 2017 and 2018, 59 percent related to a regional or State strategy. These projects accounted for 73 percent of funding. State strategies noted in the State’s annual competition guidebook for 2018 included workforce training for veterans, support for the life sciences industry, and downtown revitalization.19 Each REDC’s strategic plan lists the region’s strategy. Common strategies include support for target industry clusters and tourism.
The alignment of projects awarded funding to regional or State strategies varies considerably across regions. The Capital Region and Western New York had the greatest alignment in 2017 and 2018, with more than 80 percent of their projects aligning with a strategy. The former was most aligned with State strategy, while the latter was most aligned with its regional strategy. Finger Lakes lagged all others on both State and regional alignment, with just 18 percent of projects being strategically-aligned. Central New York and Southern Tier followed Finger Lakes in having the lowest alignment. These three regions also were selected as winners of the URI (the awards for which are not reported with the rest of the REDC award data and are therefore not reflected in the data used for this analysis), indicating that low alignment does not hamper regions’ ability to attract funding through the REDCs. This lack of alignment diverts resources from identified strategies.
Investment is dispersed
Experience in other jurisdictions suggests that sustained, focused investment supporting targeted industries in core population centers drives successful revitalization. (See Appendices A and B.) REDC funding, however, often is spread widely across projects, industries, and geographies.
This funding diffusion may mute the effectiveness of advancing any one strategy in a given area. Each region receives annual funding for relatively few projects—28 on average in 2018—across multiple strategies. Project awards average about $400,000, so each individual strategy—whether promoting an industrial cluster or revitalizing a particular area—receives limited funding in any given year. As a result, many strategies receive little funding.
In 2018 agriculture, manufacturing, healthcare, and tourism projects received the most funding, with healthcare and agriculture projects each receiving about $10 million, tourism receiving about $20 million, and manufacturing projects totaling about $40 million in funding. Other industries targeted by State and regional plans, including the tech sector and life sciences, have not generated a substantial number of funded projects.20 While it is unclear whether this disparity is by design or reflects a lack of demand in certain industries, it indicates that strategies may not match the types of projects that a region is able to attract.
The weak targeting of strategies is driven by the loose criteria the REDCs and the State use to evaluate projects. Rather than consistent and focused targeting of industries based on established criteria, regional and State strategies are often too broad and shift over time. Strategic targeting should consider return on investment, industry wages, and the market for the product (“tradability”) in planning decisions, facilitating the targeting of highest-impact industries.21
Awards also generally are spread within each region rather than targeting a particular area. Maps in annual regional updates reflect this geographic diffusion.22 Industrial clusters are place-based, making nearby projects of the same industry more likely to spur sustainable economic activity than dispersed projects.23 Each REDC has a central city or county; commuting to this hub is feasible from across the region and makes regional industrial clustering feasible.
Transparency and reporting is lacking
In its 2015 assessment of REDCs’ performance reporting, CBC found deficiencies that impede program evaluation.24 Regions chose which metrics to report and limited performance data was available only for priority projects. Reliable and thorough reporting and evaluation are necessary to design effective programs and allocate resources efficiently. Sufficient, standard metrics on projects’ performance would allow the State to determine the programs, projects, and strategies that are most successful in spurring economic development. These successes could then serve as models for regional and State policymakers.
Regional metrics have improved somewhat since 2015. Many regions are converging on a standard set of metrics sharing the same sources and reporting data from 2011 to present. For example, five regional reports shared statistics on employment, wages, number of businesses, among other economic indicators for the two most recent years and 2011, the year REDCs were launched.25 Although the metrics improve with each year’s reports, the State has yet to implement a consistent REDC reporting format that would allow for statewide comparisons.
Performance reporting for individual projects remains problematic. Reporting focuses on priority and regionally significant projects. Project-level data generally is limited to a basic description, including applicant and funding agency, award amount, and project status. Job creation is reported in the aggregate and is not reported for individual projects. Projects report only initial allocations, not actual spending. For industrial development bonds and some ESD tax credits, allocations are reported only for the entire region with no information on which projects are funded by those programs or the percent of allocated funds that are spent.26
More detailed reporting on projects and uniform metrics across regions would support evaluation of regional strategies and inform program design. The New York State Fiscal Year 2020 Adopted Budget included $500,000 for ESD to build a database of economic development projects and ESD has awarded a contract for developing the database. However, it is not clear if all REDC awards will be reported in the database.
RECOMMENDATIONS
To maximize the value of its economic development initiatives, the State should redesign the REDC process. REDCs should direct resources to the places and industries where they will be most effective. The transparency and reporting of REDC activity and regional representation in the project evaluation process also should be increased. Specifically:
Strategies should guide project funding
Only projects tied to an established regional or State strategy should be eligible for economic development-related financial assistance. This is not current practice. To maximize each project’s effectiveness in transforming the regional economy, the REDC process should utilize quantifiable criteria by which target industries are identified. These criteria should take into account likely returns on investment, industry wages, public costs per job, public-private investment ratios, and local need.27 New jobs in high-value added industry clusters in disinvested parts of the State are more likely to have a transformative effect on local economies than additional jobs not connected with burgeoning sectors or in already-thriving areas. Equalized regional funding across the State should not be a driver of award decisions. Furthermore, dispersed funding across target industries may limit the ability to advance any given strategy. In those cases, funding should be redirected to higher impact strategies.
Finally, REDCs should focus projects in major population centers—the anchor metropolitan areas in a given region—where projects are more likely to contribute to the development of sustainable industry clusters. Highly focused investments meeting these criteria are more likely to foster new industry clusters and lasting job growth.
New York State should mandate better reporting and evaluation
The State should establish standardized metrics for regional performance and require project-level reporting on progress, employment, and spending. Improved reporting on individual projects would allow more rigorous evaluation of their results and provide evidence of which programs are most effective. Annual project-level reporting should include standard information on projects’ progress: timeline and project status; employment projections; employment results; and costs and investments.28 These metrics should align with the criteria used for targeting industries so that over time performance metrics can guide strategy. Rigorous performance reporting and evaluation would identify the plans that are most effective as well as identify those plans that should be revised.
Regional assessments should carry more weight
The REDCs’ project assessment is only 20 percent of a project’s total score. The remaining 80 percent comes from the relevant State agency. This low share, together with an annual competition that favors lower-scoring projects in “winning” regions, marginalizes the input of stakeholders with the strongest ties to and best knowledge of a region’s economy. To mitigate this, the REDCs’ project scores should count as a greater proportion of the total assessment.
CONCLUSION
More than a decade after the 2008 recession, some areas of New York State remain economically stagnant. Despite major investment from the State, many regions’ populations are flat or declining and job growth trails the national average. Nevertheless, economic turnarounds in postindustrial economies are possible. While the REDC process is a considerable improvement over past approaches to economic development and has improved since first implemented, further improvements, including those supporting well-designed, sustained, and focused investments, can better harness the potential of REDCs to revitalize all of the State’s regional economies.
Download Report
Raising the REDC BarAPPENDIX A: BEST PRACTICES IN REGIONAL ECONOMIC DEVELOPMENT
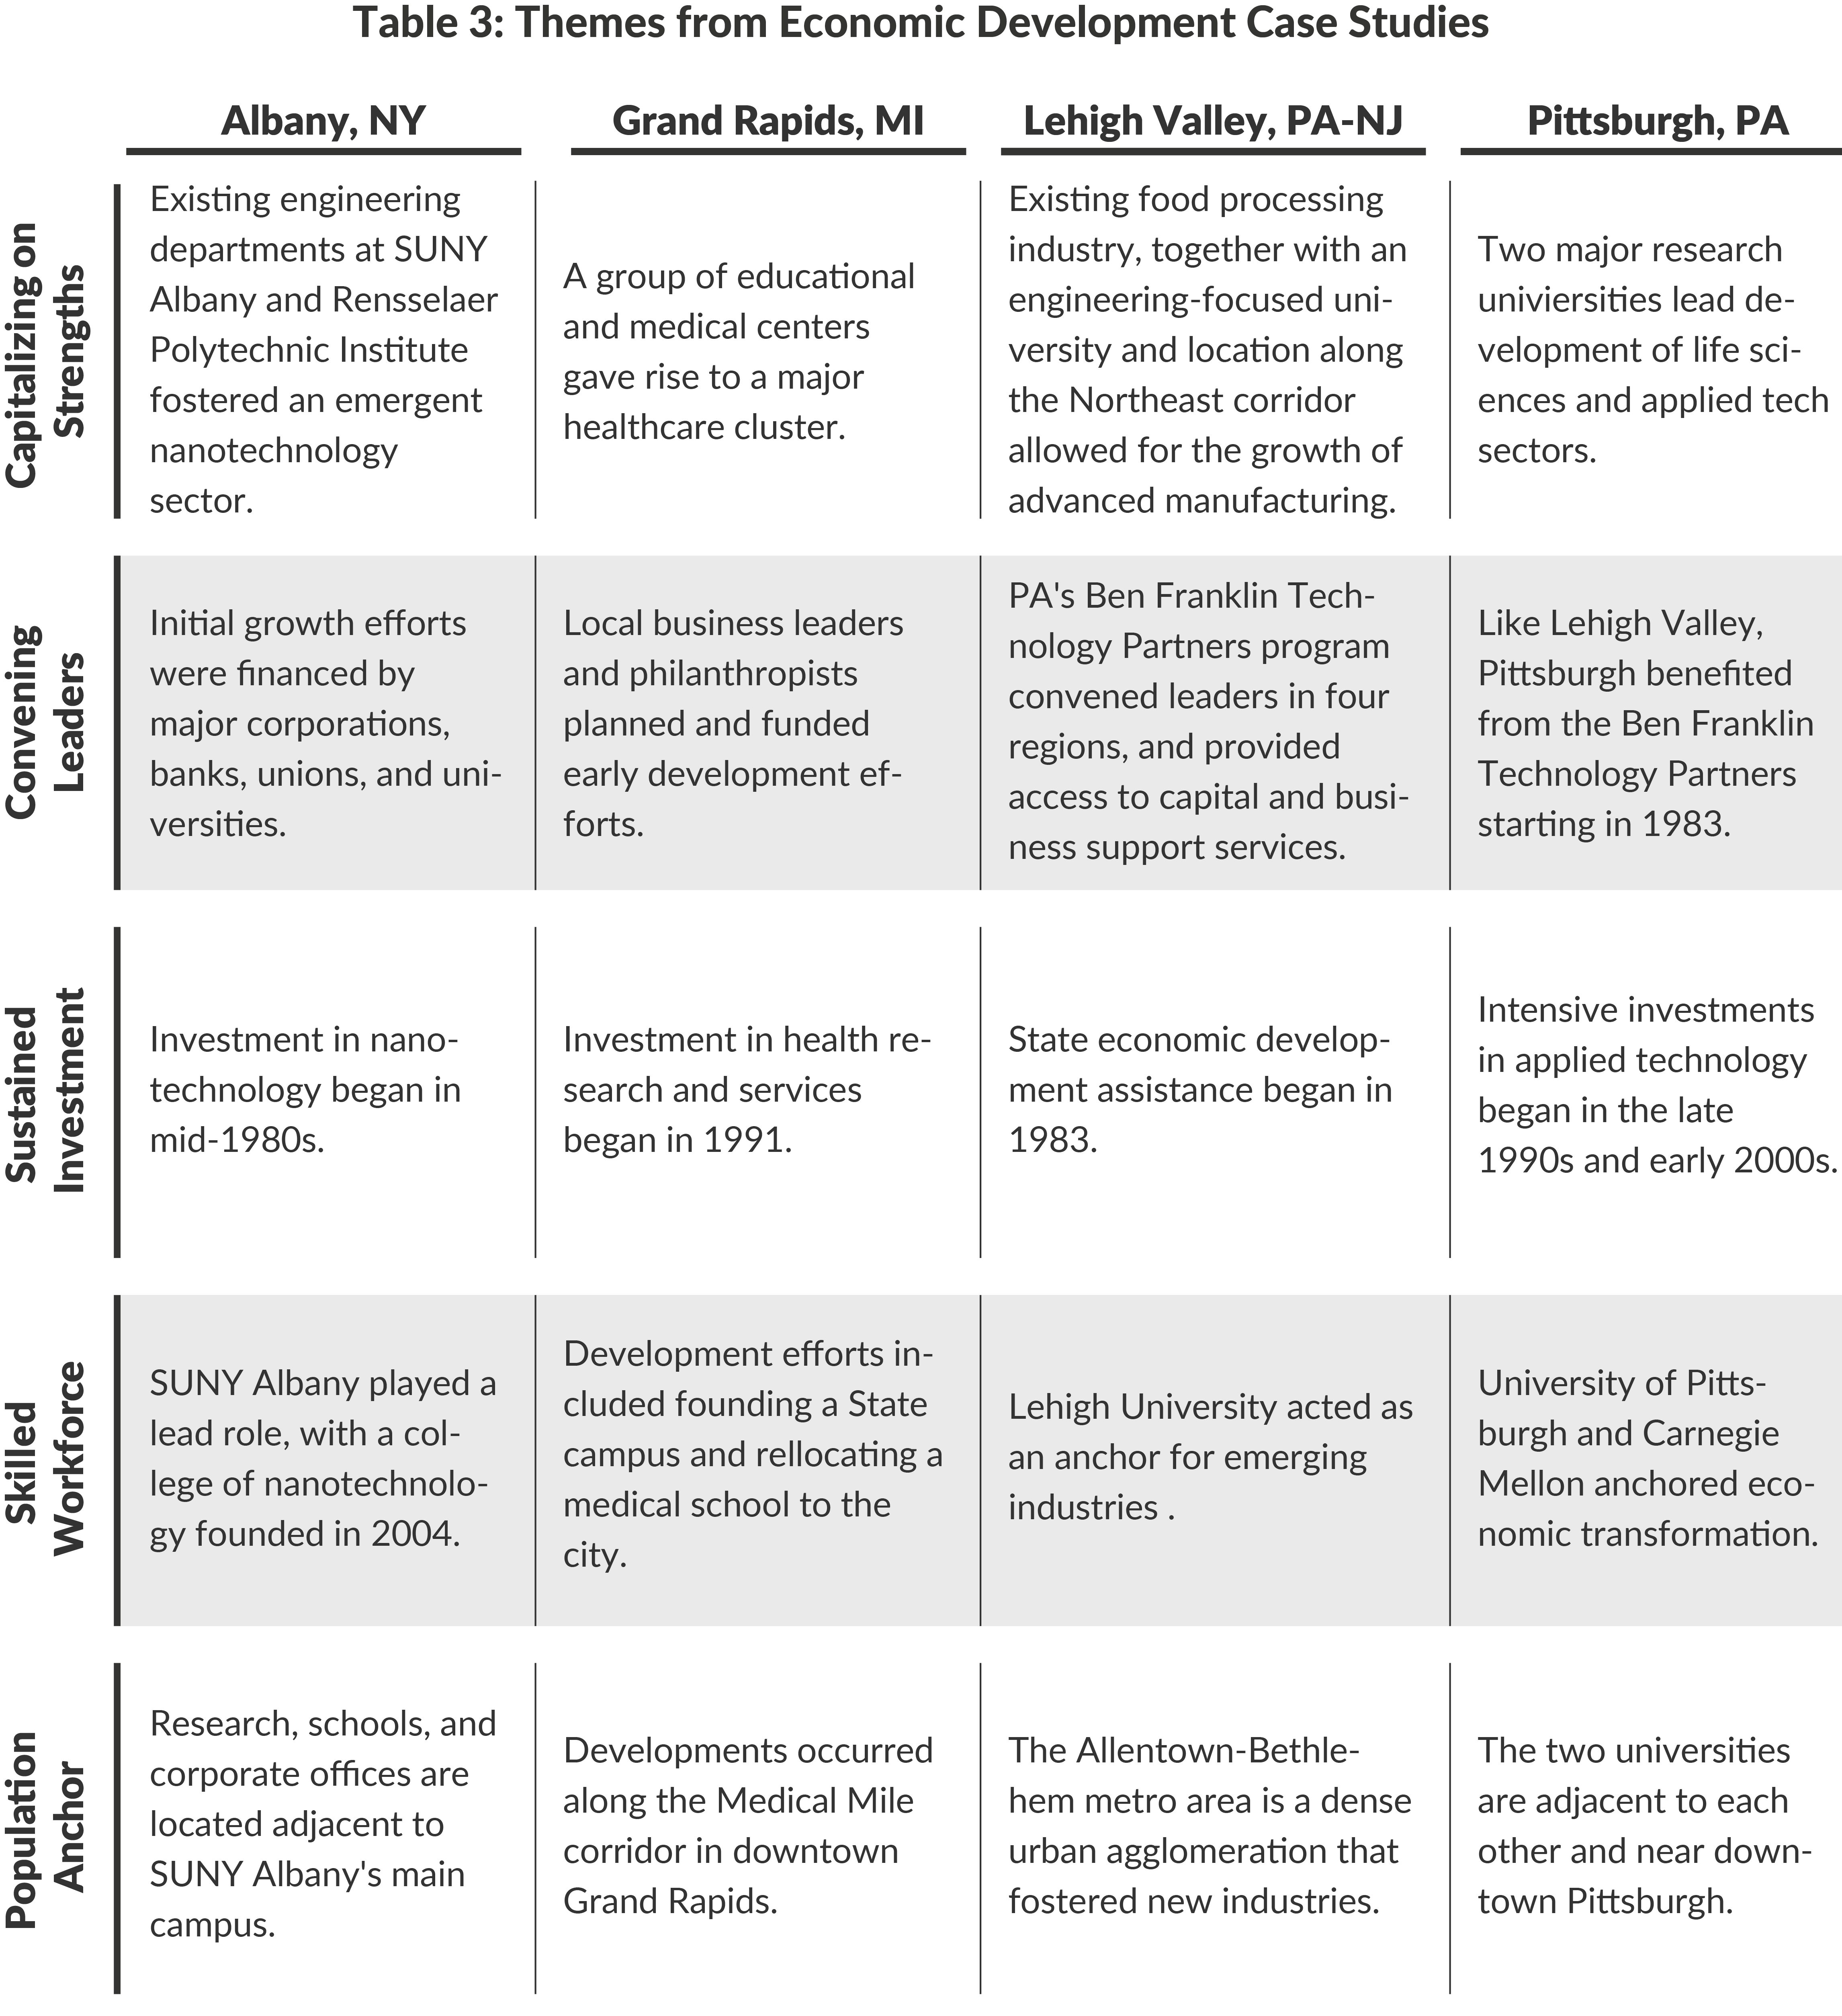
The State’s past economic development efforts have an uncertain track record; many of the State’s programs lack evidence of success to justify high costs.29 In four case studies commissioned by CBC—Albany, NY, Grand Rapids, MI, Lehigh Valley, PA-NJ, and Pittsburgh, PA—Dr. Wasylenko found five common elements of local economic development strategies that support accelerated job growth: successful strategies were built on existing regional strengths; convened groups of engaged local leaders; benefited from intensive, consistent investment over a long period of time; focused on workforce training; and centered on population centers as core economic engines. Table 3 provides an overview of how each case followed these themes; Appendix B summarizes the case studies.
Capitalizing on existing strengths
In regions that experienced post-industrial economic revivals, successful economic development strategies purposely cultivated existing regional resources to create new businesses. These resources were often major universities, medical centers, or other research organizations. Successful strategies were those that were able to harness resources in promoting industry clusters with the highest growth potential, including those characterized by value-added activities and those in tradable sectors, including regionally appropriate, technology-intensive sectors, including life sciences, advanced manufacturing, and agriculture technology.
Convening engaged leaders
Successful regional economic development strategies were generally formulated and implemented by formally organized groups of local leaders from the public, private, and civic sectors. These local networks were better able to identify regional resources and promising strategies, marshal investments, and implement programs over the long term.
Consistent investment
The economic revivals were not immediate. Successful regional development strategies required long periods—often two or more decades—of sustained investment for new industry clusters to mature and generate meaningful employment growth. The need for a long-term view highlighted the importance of designing a sound strategy that could sustain financial and political support.
Building a skilled workforce
Job growth and stability was a central goal of regional economic development in each case study. Ensuring a supply of workers equipped to fill roles in emerging industries was a key ingredient for successful development. Workforce training programs ranged from basic job skills like language and computer skills to applied apprenticeships and degree programs developed in partnership with local universities.
Focusing on a population center
Developing high-skill industry clusters required concentrations of economic resources, including access to investment and supply chains, and human capital, or skilled workers. Industry clusters thus generally formed in the regions’ primary population centers. In each case, a region’s primary metropolitan area led economic development, providing the skilled workers and established business environments necessary for new firm creation.
APPENDIX B: REGIONAL ECONOMIC DEVELOPMENT CASE STUDIES
As part of his research, Dr. Wasylenko prepared four case studies, which summarize post-industrial economic development: Albany, NY, Grand Rapids, MI, Lehigh Valley, PA-NJ, and Pittsburgh, PA. The following is taken directly from his work.
Albany, NY30
Despite its role as the capital, the presence of a large public university (SUNY Albany), and a leading engineering school (Rensselaer Polytechnic Institute), the Albany region’s economy began to decline in the 1970s and 1980s. In 1987 regional leaders established the Center for Economic Growth funded with donations from large private companies, banks, trade unions, and universities. In the mid-1980s Governor Mario Cuomo led efforts to attract nanotechnology to the region and in 1988 initiated the State University of New York Graduate Research Initiative on advanced semiconductors. SUNY-Albany enhanced its capabilities in the sciences with new faculty hires and investment in research labs in 1995. With the large NYS commitment to semiconductors, SEMATECH- a non-profit organization formed by semi-conductor manufacturers and initially funded by the U.S. Department of Defense and that performs research on chip making- relocated from Austin, Texas to Albany, followed by Tokyo Electronics. NYS, IBM, and SEMATECH contributed funds (NYS invested $210 million; SEMATECH $40 million plus $120 million of in kind services; and IBM $100 million) to establish the College of Nanotechnology at SUNY-Albany in 2004. Tokyo Electronics also contributed $200 million to the SUNY Albany Center for Excellence.
Following the public-private investments, nanotechnology manufacturing companies began moving to the area to learn from the nearby research innovations. NYS continues to subsidize nanotechnology relocations in the area, including $1.2 billion in incentives to Global Foundries to build a semiconductor factory in Malta, a suburb located 20 miles north of Albany. In addition, Hudson Valley Community College offers a 25-credit training certificate to qualify for entry-level positions in nanotechnology manufacturing.
Nanotechnology is highly competitive globally. NYS has certain advantages, such as the stable geology necessary for chip manufacturing and the clustering of research and major manufacturing facilities. Semiconductor technology also has applications in biological areas, including synthetic biology, human body implants, and biometric monitoring. Expanding the technology to more uses diversifies the production lines and makes the region less vulnerable to competition in a single industry.
Grand Rapids, MI31
The Grand Rapids area had major industries in fabricated metals and pharmaceuticals manufacturing located in three major employment centers in the region. The region’s manufacturing sector began to struggle in the 1970s before declining rapidly between 2000 and 2005.
The Grand Rapids metropolitan statistical area has 1.1 million residents and Grand Rapids City has 199,000 residents. Witnessing a decline in Grand Rapids City and observing a steady decline in Michigan’s automobile industry, in 1991 Grand Rapids formed a Grand Vision Committee that later became a Grand Action Committee of the business leaders of closely held large locally based companies, including Amway, Steelcase Office Furniture, and Meijer Food. (The other two employment centers in the region created their own development councils.)
Through personal donations and gifts from their foundations, Grand Rapids’ business leaders invested in parks, convention centers, and other community infrastructure in downtown and areas near downtown. For example, the Van Andel family of Amway bought and redeveloped a downtown hotel and created the Amway Grand Plaza in an area around the hotel. In the late 1990s the DeVos Family used its funds to establish a downtown campus of Grand Valley State University. With these and other investments, downtown Grand Rapids transformed from a place that President Ford’s - a Grand Rapids native - security detail deemed too desolate and unsafe to hold a welcome home parade in 1976, to a vibrant downtown area.
The group also established the Medical Mile in downtown Grand Rapids. Van Andel jump-started the initiative with more than a $1 billion investment to establish the Van Andel Research Institute for biomedical research that opened in 2000. The Grand Action Committee also raised $20 million to match a Michigan State alumnus’ gift to lure Michigan State University to relocate its College of Human Medicine to Grand Rapids. Spectrum Health located in the area and other manufacturing companies changed their operations to start fabricating medical devices and other orthopedic products. Advanced manufacturing and medical facilities tend to employ high-wage employees and are associated with large investments and high multipliers.
Lehigh Valley, PA-NJ
The Lehigh Valley is a four county area– three counties in Pennsylvania and one county in New Jersey. Its metropolitan area population is about 1 million. It is located just north of Philadelphia, and it was mainly a one-industry area, as it was formerly the home of Bethlehem Steel.
Lehigh Valley recognized the limitations of relying on a single industry, and in the 1950s established an industrial park that assembled land for future industries– a common strategy in that era. The State of Pennsylvania recognized that its two large cities, as well as other parts of the state, were losing jobs in traditional industries. In 1983 the State organized the Ben Franklin Technology Based Economic Partnership (TBEP), designed to invest state money in primarily three places- Pittsburgh, Philadelphia, and University Park, the location of Pennsylvania State’s flagship campus. The Lehigh Valley region persuaded the State to include a fourth anchor location in the Lehigh Valley.
A regional group of business, government, financial, and university leaders established the Lehigh Valley Development Committee (LVDC). The organization is funded through a local hotel tax. The group targeted clusters in advanced manufacturing of life sciences products, high-value business services and food and beverage processing – an extant industry in the region. The LVDC promoted life sciences research, entrepreneurship, and the establishment of new companies. To overcome the lack of venture capital in the region, the LVDC organized 16 area regional banks to provide startup loans to new companies. LVDC recruited new firms domestically and internationally. With the work of TBEP and LVDC, the Lehigh Valley has created a new manufacturing base centered on It has rebuilt a manufacturing base around medical activities. The region benefits from its population size, a technology oriented university in its center, and proximity to the pharmaceutical and technology corridor that runs from Boston to Washington D.C.33
Pittsburgh, PA
The Pittsburgh metropolitan area has a population of 2.3 million. Known in a prior era as a steel and banking area - U.S. Steel and Mellon Bank - thought leaders in the region recognized in the 1950s that reliance on two major industries made the economy vulnerable to economic downturns in those industries and possibly long-term decline.34 The downturn in the region’s steel production accelerated in the 1980s: from 1981 to 1984, Pittsburgh lost 120,000 manufacturing jobs, mostly in steel, and continued to lose jobs in the manufacturing sector. It faced large population outmigration, especially in younger age cohorts, and had an aging workforce.
Pittsburgh has two major universities located next to one another- the University of Pittsburgh with a major medical center and Carnegie Mellon with an engineering and science focus. The medical center had a national reputation, and the Salk vaccine originated at the University of Pittsburgh in 1952. Leveraging these assets was central to Pittsburgh’s turnaround.
As in the Lehigh Valley, Pennsylvania’s Ben Franklin Partnership program emphasized Technology-Based Economic Development (TBED) strategies to revitalize its legacy manufacturing cities. In addition to this partnership, Pittsburgh benefited from the State of Pennsylvania’s investment into life sciences of a portion of funds that it and other states received from a 1998 tobacco settlement. Pennsylvania committed $64 million per year for the next 25 years.36 In 2002 Pennsylvania funded a Greenhouse Life Sciences initiative for $100 million in three locations – Pittsburgh, Central PA, and Southeastern PA to support public/private partnerships (government, businesses, universities and other partners).
The University of Pittsburgh Medical Center (UPMC) is currently the largest employer in Pittsburgh followed by the University of Pittsburgh. Pittsburgh remains a major center for financial activities. The region has also developed a diversified energy production system. It exports energy produced from coal, natural gas, nuclear, solar, and wind power.
In the new economy, the presence of two major research universities has led to job growth in three main areas: life sciences, robotics, and advanced manufacturing and autonomous systems. The high-wage earning and highly educated persons in these fields thrive in Pittsburgh. The region retains and attracts major firms, such as Alcoa, Bayer, Google, and Uber.
Pittsburgh represents state investment of funds in a region with comparative advantages in life sciences and high technology based on its two major universities. A drawback is that the region does not yet have the level of entrepreneurship to convert the innovations from research and development to downstream manufacturing and service jobs.37
NOTES TO TABLE 1
Totals may not add due to rounding. Tax expenditure values reflect projects current-year value of forgone taxes. Spending values reflect actual appropriations. Years refer to calendar year. Data for other public authorities and New York Power Authority are lagged per data availability.
Sources for Table 1 are listed below.
a Includes tax breaks for research and development property; services to machinery and equipment used in production; machinery and equipment used in production; fuel, gas, electricity, refrigeration and steam used in research and development and production.
b Includes Excelsior Jobs Program.
c Includes investment credit and investment credit for financial services industry.
d Includes tax breaks for commercial aircraft, food sold to airlines, and fuel sold to airlines.
e Includes elimination of net income tax on corporate manufacturers in 2016, and real property tax relief credit for manufacturing.
f Includes alcoholic beverage production credit; biofuel production credit; clean heating fuel credit; commercial buses; computer systems hardware; economic transformation and facility redevelopment program tax credit, which supports firm creation in areas affected by the closure of correctional facilities; Empire State apprenticeship tax credit; farm production and commercial horse breeding; farmers' school property tax credit; fuel, gas, electricity, refrigeration and steam used in farming and commercial horse breeding; green building credit; industrial development agencies sales tax exemption; Lower Manhattan commercial office space; NY Works youth job credit; musical and theatrical production credit; Qualified Emerging Technology Company credits; rehabilitation of historic properties; tractor-trailer combinations; and training and maintaining race horses.
g Includes Economic Development Capital Programs; Strategic Investment Program; Regional Economic Development Program; Economic Development Program, New York State; High Technology and Development Program; as well as Special Infrastructure Account funds except those for emergency preparedness, counterterrorism, hospital projects, and Thruway stabilization.
h Data for 2015 and 2017. Total expenses, excluding depreciation costs and transfer of excess revenues; includes Agriculture & New York State Horse Breeding Development Fund, Development Authority of the North Country, Hudson River Park Trust, Olympic Regional Development Authority, and New York State Thoroughbred Breeding and Development Fund.
i Data for 2015 and 2017. Includes estimated benefit to ReCharge NY participants; Industrial Incentive Awards paid; deposits to Western New York Economic Development Fund; deposits to Northern New York Economic Development Fund (established in 2014); legacy rebate payments made to Power For Jobs program participants; and payments to Transitional Electricity Discount recipients.
j Includes expenditures on NYSERDA's Technology and Market Development Program, Saratoga Technology and Energy Park, Energy Research & Development, and Market Development/Innovation & Research. The Technology and Market Development Program expired in 2016 and is included in "Other" in the 2017-2018 financial statements; it is not included in the 2018 total.
SOURCES FOR TABLE 1
State of New York Authorities Budget Office, “2019 Annual Report on Public Authorities in New York State,” (July 2019), https://www.abo.ny.gov/reports/aboannualreports.html.
New York Independent System Operator, “Energy Market and Operational Data: Zonal Day- Ahead Market Location Based Marginal Price,” www.nyiso.com/energy-market-operational-data.
New York State Authorities Budget Office, “Industrial Development Agencies’ Project Data,” https://data.ny.gov/Transparency/Industrial-Development-Agencies-Project-Data/9rtk-3fkw; “Summary Financial Information for Local Development Corporations,” https://data.ny.gov/ Transparency/Summary-Financial-Information-for-Local-Developmen/wgry-y5zd.
New York State Division of the Budget, “FY 2019 Annual Report on New York State Tax Expenditures,” (February 2018), www.budget.ny.gov/pubs/archive/fy19/exec/fy19ter/taxexpendfy19.pdf, and FY 2017 edition, www.budget.ny.gov/pubs/archive/fy17archive/eBudget1617/fy1617ter/TaxExpenditure2016-17.pdf; “FY 2019 Enacted Budget Capital Program and Financing Plan,” (May 2018), www.budget.ny.gov/pubs/archive/fy19/enac/fy19enacCP.pdf, and Fiscal Year 2017 edition, www.budget.ny.gov/pubs/archive/fy17archive/ enactedfy17/FY2017CPFP.pdf; “FY 2019 Enacted Budget Financial Plan,” p. T-155 (May 2018), www.budget.ny.gov/pubs/archive/fy19/enac/fy19enacFP.pdf, and Fiscal Year 2017 edition, p. T-155, www.budget.ny.gov/pubs/archive/fy17archive/enactedfy17/FY2017FP.pdf.
New York State Energy Research and Development Authority, “Financial Statements,” (March 31, 2018), www.abo.ny.gov/annualreports/PARISAuditReports/FYE2018/State/NewYorkStateEnergyResearchandDevelopmentAuthority2018.pdf, and Fiscal Year 2016 edition, www.abo.ny.gov/annualreports/PARISAuditReports/FYE2016/State/NYSERDA2016.pdf.
Office of the New York State Comptroller, “Financial Data for Local Governments,” www.osc.state.ny.us/localgov/datanstat/findata/index_choice.htm.
Power Authority of the State of New York, “2015 Annual Report,” (March 2016), p. 41, www.nypa.gov/NYPA-2015-AnnualReport.pdf; “2017 Report to the Governor and Legislative Leaders on Power Programs for Economic Development,” (April 2018), p. 3, 7-8, www.nypa.gov/-/media/nypa/documents/document-library/governance/2017govrpt.pdf, and 2015 edition, p. 3, 9-10; “Electric Supply Rates - Business Customers: Beginning 2012,” https://data.ny.gov/Energy-Environment/New-York-Power-Authority-NYPA-Electric-Supply-Rate/2x8p-pewm; “Financial Report, December 31, 2017 and 2016” (March 2018), pp. 17-18, www.nypa.gov/-/media/nypa/documents/document-library/financials/2017-finance-report.pdf.
Footnotes
- Regional Economic Development Councils, “2018 REDC Awards Booklet” (December 2018), and 2011 to 2017 editions, https://regionalcouncils.ny.gov/resources.
- See Rahul Jain and Riley Edwards, “An Assessment of Performance Reporting by Regional Economic Development Councils,” Citizens Budget Commission (November 29, 2015), https://cbcny.org/research/assessment-performance-reporting-regional-economic-development-councils; Riley Edwards and Maria Doulis, “Should New York’s REDCs REDO Their Plans?” Citizens Budget Commission (December 6, 2016), https://cbcny.org/research/should-new-yorks-redcs-redo-their-plans; and Dr. Michael Wasylenko, "How to Spur and Sustain Economic Growth in NY’s Upstate Regions" (presentation given at Citizens Budget Commission Conference on the Most Important Economic and Fiscal Issues Facing New York State, December 17, 2018), https://cbcny.org/sites/default/files/media/files/PRESENTATION_NYSConfEconDev_12172018.pdf.
- This sum only includes only economic development costs incurred by New York State. Economic development cost localities in New York State an additional $5.6 billion in 2018. See: Riley Edwards, “10 Billion Reasons to Rethink Economic Development in New York,” Citizens Budget Commission (February 11, 2019), https://cbcny.org/research/10-billion-reasons-rethink-economic-development-new-york.
- The Empire Zone program targeted prescribed geographies across the State but has been closed to new participants since 2010.
- Financial institution settlements with New York funded the URI among other state priorities. See: State of New York, “Upstate Revitalization Initiative Frequently Asked Questions” (accessed September 11, 2019), https://www.ny.gov/upstate-revitalization-initiative/upstate-revitalization-initiative-frequently-asked-questions.
- New York State’s downstate regions, New York City and Long Island, are ineligible for the Upstate Revitalization Initiative. Western New York was also ineligible because the URI represented an expansion of the Buffalo Billion, which granted the region about $1.5 billion beginning in 2012. Source: Office of the Governor, "Governor Cuomo Announces Launch of Buffalo Billion II Initiative to Support Innovation and Growth for Manufacturers in Western New York" (press release, December 18, 2017), https://www.governor.ny.gov/news/governor-cuomo-announces-launch-buffalo-billion-ii-initiative-support-innovation-and-growth.
- State of New York, “Upstate Revitalization Initiative Guidebook” (April 2015), https://esd.ny.gov/sites/default/files/URI_GuideBook.pdf.
- If URI spending were at a constant level over five years, total spending as of 2019 would be approximately $900 million. Source: New York State Open Budget, “Open Budget” (accessed September 8, 2019), https://openbudget.ny.gov/openBudget.html.
- State of New York, “Downtown Revitalization Initiative Guidebook” (April 2019), https://www.ny.gov/sites/ny.gov/files/atoms/files/DRI_Four_Guidebook.pdf.
- Regional Economic Development Council, “2019 REDC Guidebook” (April 2019), https://regionalcouncils.ny.gov/sites/default/files/2019-04/2019REDCGuidebook.pdf.
- Annual average award figure is not inclusive of the Upstate Revitalization Initiative or Downtown Revitalization Initiative. Statistics throughout this report are exclusive of these initiatives except where specifically noted.
- David Robinson, “Tesla’s Buffalo plant gets $884 million write-down,” The Buffalo News (November 8, 2019), https://buffalonews.com/2019/11/08/pennies-on-the-dollar-the-tesla-plant-isnt-worth-nearly-what-the-state-paid-to-build-it/.
- U.S. Census Bureau, Population Estimates, 2018; U.S. Bureau of Labor Statics, Quarterly Census of Employment and Wages, 2011-2018.
- Case studies of regional economic development initiatives conducted by Dr. Michael Wasylenko showed that successful strategies were: developed by local leaders, capitalized on regional assets, benefited from sustained investment, incorporated workforce development, and focused on regions’ population centers. See Appendices A and B for best practices and case studies.
- Five-year plans referenced in this section include all available through the Regional Economic Development Council resource portal. This is not exhaustive, as not all regions’ five-year plans are available. Source: Regional Economic Development Councils, “Resource Center” (accessed November 6, 2019), https://regionalcouncils.ny.gov/resources; Long Island REDC, “Long Island’s Future Economy: A New Beginning for Nassau and Suffolk Counties” (November 14, 2011), https://regionalcouncils.ny.gov/sites/default/files/2019-01/LongIslandsFutureEconomy.pdf; New York City REDC, “Strategic Plan” (November 14, 2011), https://regionalcouncils.ny.gov/sites/default/files/2017-12/REDECFINALNYC.pdf; Mid-Hudson REDC, “Strategic Plan” (November 14, 2011), https://regionalcouncils.ny.gov/sites/default/files/2017-11/MHREDCSPFINAL11_12_11.pdf; Southern Tier REDC, “The Southern Tier’s Approach to Economic Growth” (November 14, 2011), https://regionalcouncils.ny.gov/sites/default/files/2018-02/2011STStrategicPlan.pdf; Western New York REDC, “A Strategy for Prosperity in Western New York” (November 14, 2011), https://regionalcouncils.ny.gov/sites/default/files/2018-04/A_Strategy_for_Prosperity_in_Western_New_York_November_2011.pdf; and Finger Lakes REDC, “Accelerating Our Transformation” (November 14, 2011), https://regionalcouncils.ny.gov/sites/default/files/2017-11/FLREDCStrategicPlan.pdf.
- Reports referenced for this section were 2018 Progress Reports for each region, accessed in November 2019 through https://regionalcouncils.ny.gov/resources.
- See: Citizens Budget Commission, “Avoiding Past Mistakes: Principles for Governing Regional Economic Development Councils,” Citizens Budget Commission (September 12 2011), https://cbcny.org/research/avoiding-past-mistakes.
- Regional Economic Development Councils, “2018 REDC Awards Booklet” (December 2018), https://regionalcouncils.ny.gov/resources.
- Regional Economic Development Council, “2019 REDC Guidebook” (April 2019), https://regionalcouncils.ny.gov/sites/default/files/2019-04/2019REDCGuidebook.pdf.
- CBC staff analysis of Regional Economic Development Councils, “2018 REDC Awards Booklet” (December 2018), https://regionalcouncils.ny.gov/resources.
- Tradable sectors refer to industries producing goods or services that can be consumed outside the region in which they are produced. Examples of tradable sectors include manufacturing, agriculture, and business services, while non-tradable sectors include healthcare and education.
- Reports referenced for this section were 2018 Progress Reports for each region, accessed in November 2019 through https://regionalcouncils.ny.gov/resources.
- See: Edward Glaeser and David C. Maré, “Cities and Skills” Journal of Labor Economics, 19 No. 2 (April 2001), pp. 316–342, www.jstor.org/stable/10.1086/319563; Enrico Moretti, “Local Labor Markets” in Orley Ashenfelter and David Card, eds., Handbook of Labor Economics, Vol. 4B (November 10, 2010), pp. 127-1313.
- Rahul Jain and Riley Edwards, “An Assessment of Performance Reporting by Regional Economic Development Councils,” Citizens Budget Commission (November 29, 2015), https://cbcny.org/research/assessment-performance-reporting-regional-economic-development-councils.
- Mohawk Valley REDC, “Home” (October 2018), pp. 10, https://regionalcouncils.ny.gov/sites/default/files/2018-10/MohawkValley2018ProgressReport.pdf; New York City REDC, “State of the Region: New York City” (October 2018) , pp. 8-20, https://regionalcouncils.ny.gov/sites/default/files/2018-10/NYCREDC_Progress_Report_2018_0.pdf; North Country REDC, “NC” (October 1, 2018) , pp. 12-21, https://regionalcouncils.ny.gov/sites/default/files/2018-10/NorthCountry2018ProgressReport.pdf; Western New York REDC, “7 Year of Transforming Our Region” (November 2018) , pp. 12-17, https://regionalcouncils.ny.gov/sites/default/files/2018-11/WNYREDC%202018%20Progress%20Report%20FINAL3.pdf; Long Island REDC, “Long Island: Completing the Puzzle” (October 1, 2018), pp. 4-5, https://regionalcouncils.ny.gov/sites/default/files/2019-01/LongIsland2018REDCReportFINAL.pdf.
- Rahul Jain and Riley Edwards, “An Assessment of Performance Reporting by Regional Economic Development Councils,” Citizens Budget Commission (November 29, 2015), https://cbcny.org/research/assessment-performance-reporting-regional-economic-development-councils.
- Based on publicly available information, it is not clear if any or all of these criteria are utilized by REDCs or State agencies in the evaluation process.
- Rahul Jain and Riley Edwards, “An Assessment of Performance Reporting by Regional Economic Development Councils,” Citizens Budget Commission (November 29, 2015), https://cbcny.org/research/assessment-performance-reporting-regional-economic-development-councils.
- Riley Edwards, “The State Budget Keeps Wasting Economic Development Cash,” City & State (April 5, 2018), https://cbcny.org/advocacy/state-budget-keeps-wasting-economic-development-cash.
- CW Wessner (ed), “Best Practices in State and Regional Innovation Initiatives: Competing in the 21st Century,” National Research Council (2013), https://www.ncbi.nlm.nih.gov/books/NBK158826/#ch7.s1.
- A Brookings report examines turnarounds in a number of locations and reports extensively on Grand Rapids. See: Patricia Atkins et al., “Responding to Manufacturing Job Loss: What Can Economic Development Policy Do?” (June 2011), Metropolitan Policy Program at Brookings Institution.
- Lehigh Valley Economic Council, “Annual Report 2017” (March 2018), https://lehighvalley.org/wp-content/uploads/2018/03/LVEDC-2017-Annual-Report.pdf.
- Benjamin Chinitz, "Contrasts in Agglomerations: New York and Pittsburgh," American Economic Review Vol. 51 no. 2 Papers and Proceedings (May 1961), pp. 279 – 289; and Pittsburgh Regional Planning Association, “Economic Study of the Pittsburgh Region: Region with a Future,” (1963), University of Pittsburgh Press.
- State of Pennsylvania Tobacco Settlement Act, Act 77, (June 26, 2001), https://www.legis.state.pa.us/cfdocs/legis/li/uconsCheck.cfm?yr=2001&sessInd=0&act=77.
- Scott Andes, Mitch Horowitz, Ryan Helwig, and Bruce Katz, “Capturing the Next Economy: Pittsburgh's Rise as a Global Innovation City,” Brookings Institution (September 2017), https://www.brookings.edu/wp-content/uploads/2017/09/pittsburgh_full.pdf.