Straight from New Yorkers
CBC Resident Survey Gives Comprehensive View of Satisfaction with Core City Services, Quality of Life


SUMMARY
The Citizens Budget Commission’s (CBC) 2023 Resident Survey provides the most comprehensive, statistically valid, post-pandemic view into how New Yorkers feel about the City’s quality of life and how they rate City government services. By essentially replicating CBC’s 2017 and the City’s 2008 surveys, New Yorkers’ current views can be compared to those times.
New Yorkers generally rate the quality of life and the quality of City services much lower than they did in 2017.
- Only 30 percent rate the quality of life as excellent or good, down from 50 percent in 2017 and 2008;
- One-third of New Yorkers rate the quality of life as poor;
- Fully 29 percent of households earning under $35,000 annually rate quality of life excellent or good, a slightly higher percent than those earning between $35,000 and $99,999, but lower than those earning over $100,000;
- New Yorkers feel better about their neighborhoods as a place to live, with 50 percent rating it excellent or good;
- The gap between these city and neighborhood ratings is present in most Community Boards, with the notable exception of southern and central Bronx, where the ratings in each Community Board for both the neighborhood or city quality of life as excellent or good top out at 20 percent;
- Households with income over $200,000 remained the most satisfied with quality of life in the city, with 45 percent rating it excellent or good.
- Only 37 percent rate public safety in their neighborhood as excellent or good, down from 50 percent in 2017;1
- In fact, New Yorkers feel only marginally safer riding the subway during the day now as they felt on the subway at night in 2017;
- Only 24 percent rate the quality of government services good or excellent, down from 44 percent in 2017;
- Still, over 50 percent of New Yorkers rates particular services as excellent or good, including fire protection, household garbage pickup, 311, and bus services; and
- Only 11 percent believe the government is spending tax dollars wisely, down from 21 percent in 2017.
In reviewing resident survey results, it’s critically important to consider the context: These findings come as New York emerges from the pandemic and has increased affordability challenges. The recession officially ended in May 2020, but employment returned to pre-pandemic levels just a few months ago. While some economic indicators are similar to 2017, coming out of the pandemic still is a different context than 2017, when New York was seven years into a robust economic recovery.
New Yorkers have spoken, represented by the more than 6,600 survey-responding households covering all of New York’s neighborhoods, income brackets, and race and ethnicities. They give direct feedback on their priorities, both in response to that specific question and in rating various aspects of quality of life and many different services.
Fortunately, the focus of Mayor Eric Adams’ Administration by and large aligns with New Yorkers’ priorities—including public safety; housing; and clean streets, parks, and public spaces. However, the gap between how New Yorkers rate the quality of life and City services now and their past ratings is huge. A great deal of progress needs to be achieved to return to prior levels of satisfaction.
Furthermore, there are significant variations in how New Yorkers rate the quality of life and service, among neighborhoods, income levels, and by race and ethnicity. The percentage of respondents rating quality of life excellent or good ranges from 40 percent in Manhattan to 21 percent in the Bronx. Those rating public safety in their neighborhood as excellent or good ranges from 28 percent for Hispanic New Yorkers to 47 percent for White New Yorkers. These more granular findings should also help the Administration better target its efforts to improve services and strengthen policies.
Finally, the Administration should incorporate this type of standardized, statistically valid feedback into its management systems and policy development. These data should complement and be viewed alongside City service performance data to get a sharper picture of service quality and results.
The rest of this report details some of these findings. Additional details by race, ethnicity, Community Board, and more are found at:
- 2023 NYC Resident Feedback Survey Report of Results;
- 2023 NYC Resident Feedback Survey Full Results by Community Board;
- Presentation: Results for the 2023 New York City Resident Survey;
- Maps: Borough and Community Board Disparities; and
- Interactive NYC Resident Survey Tool.
BACKGROUND
Methodologically Rigorous Survey; Comparable Results
The 2023 Resident Feedback Survey, administered for CBC by Polco, employed a random sample of over 125,000 New York City households, with responses from more than 6,600 New Yorkers.2 The survey was sent in two waves, with a second added to strengthen validity, especially at the Community Board level. Responses were gathered from September through December 2023.
The citywide margin of error is +/- 1 percent. Given the large sample size, it also provides statistically valid results by race/ethnicity and income. The margin of error for results is between +/-2 percent and +/- 4 percent for race/ethnicity, and between +/-2 percent and +/- 6 percent for income. The survey also provides geographic detail. Borough results have a margin of error of between +/- 2 percent and +/- 6 percent, while Community Board results have a margin of error between +/-8 percent and +/- 10 percent.
The survey is very comparable to CBC’s 2017 NYC Resident Feedback Survey, as well as a similar survey conducted by the City of New York in 2008.3 The same survey firm was engaged to conduct all three surveys, using comparable methodology and materials. Most questions were replicated in all three surveys.
Economic Context Is Important Lens
This 2023 survey is comparable in content and methodology to the survey’s conducted by CBC in 2017 and the City in 2008. However, there are important differences between time periods when the three surveys were in the field, including the economic conditions facing New Yorkers. The 2008 survey was fielded near the start of a recession; the 2017 survey was in the field seven years into a robust economic recovery, and the 2023 survey was in the field three-and-a-half years after the beginning of the COVID pandemic and associated, brief recession.4
The selected economic indicators are reasonably comparable at the three points, but the severely disruptive effect of the pandemic is still a recent memory and the City has not fully recovered. (See Figure 1.) While private employment finally returned to pre-pandemic levels at the end of 2023, inflation remained slightly elevated. Furthermore, median asking rents have been increasing and crime levels rose during the pandemic. And, despite progress in reducing the rate of murders/non-negligent manslaughter, they both remain above their levels from when the 2008 and 2017 surveys were fielded. (See Figure 2.)
Figure 1: NYC Economic Conditions, January 2006 to December 2023
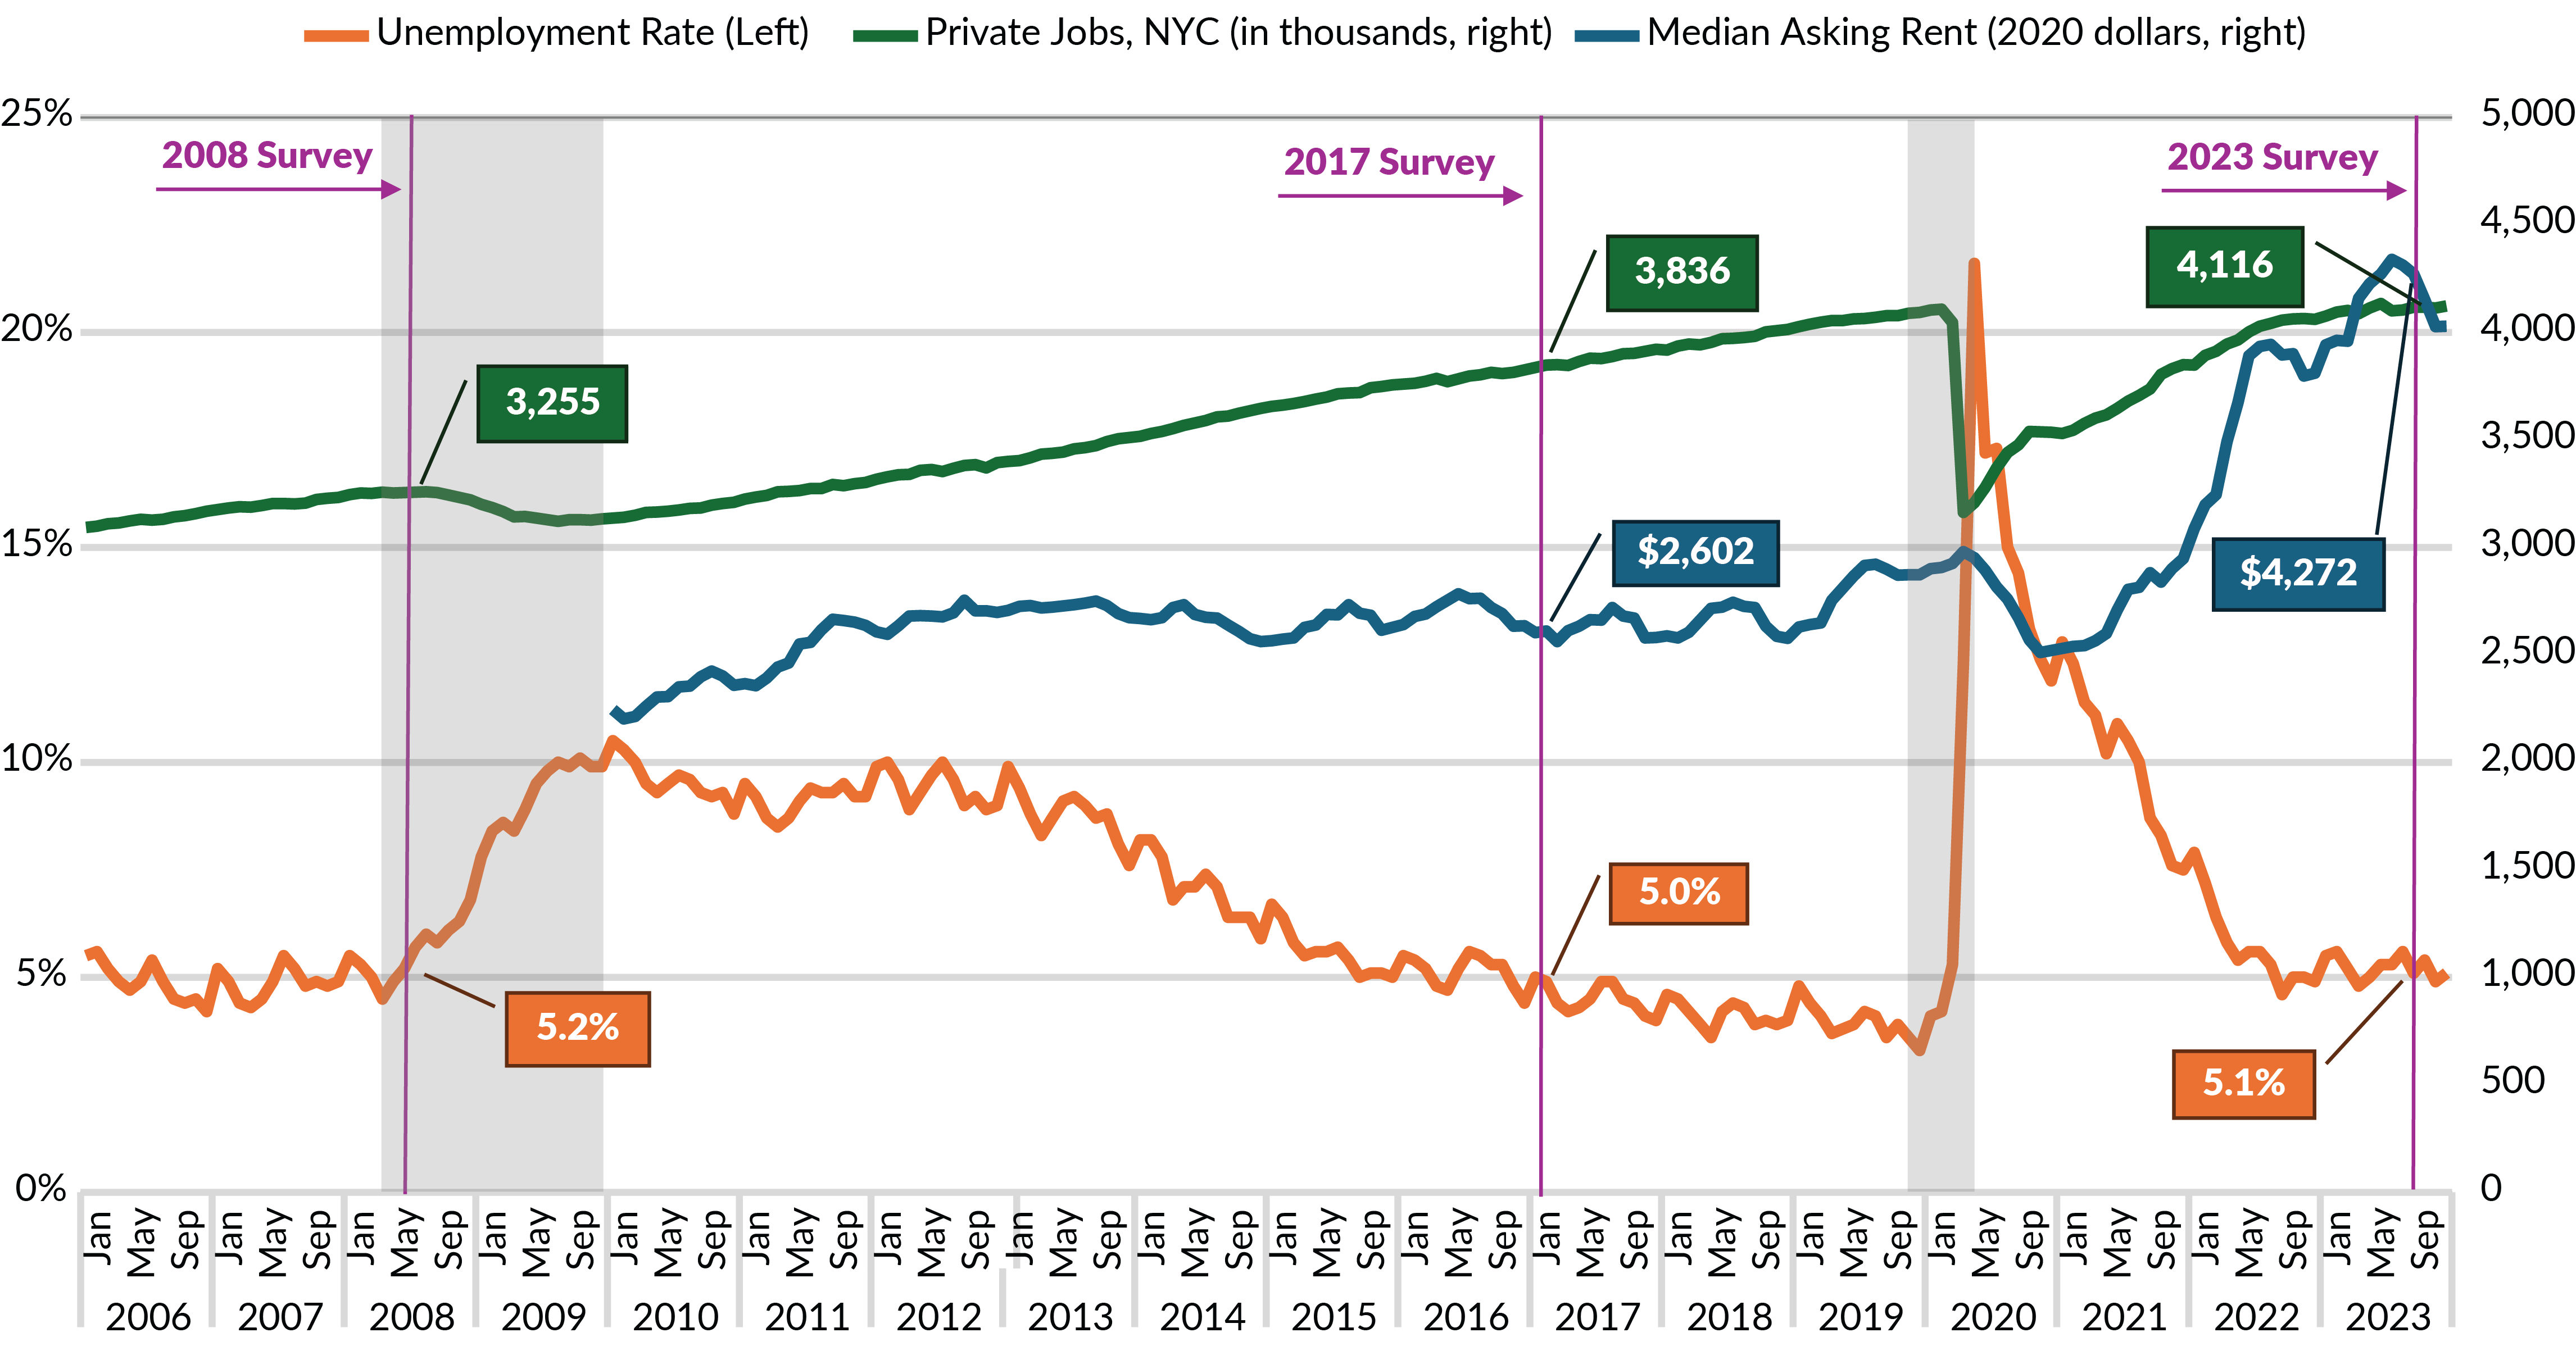
Gray shading represents recessions in NYS based on NYS Department of Labor data. Purple lines indicate survey administration.
City of New York, Mayor’s Office of Management and Budget, “NYC Seasonally Adjusted Employment, January 2024” (March 8, 2024), https://www.nyc.gov/assets/omb/downloads/csv/nycemploy-sa01-24.csv; StreetEasy Data Dashboard, "Median Asking Rents" (accessed March 13, 2024), https://streeteasy.com/blog/data-dashboard; U.S. Bureau of Labor Statistics, "Create Customized Tables - Consumer Price Index for All Urban Consumers (CPI-U)" (accessed March 13, 2024), https://data.bls.gov/cgi-bin/dsrv?cu; and NYS Department of Labor, "Local Area Unemployment Statistics" (accessed 3/13/2024), https://dol.ny.gov/local-area-unemployment-statistics.
Figure 2: Felony Offenses in NYC, Indexed to 2017
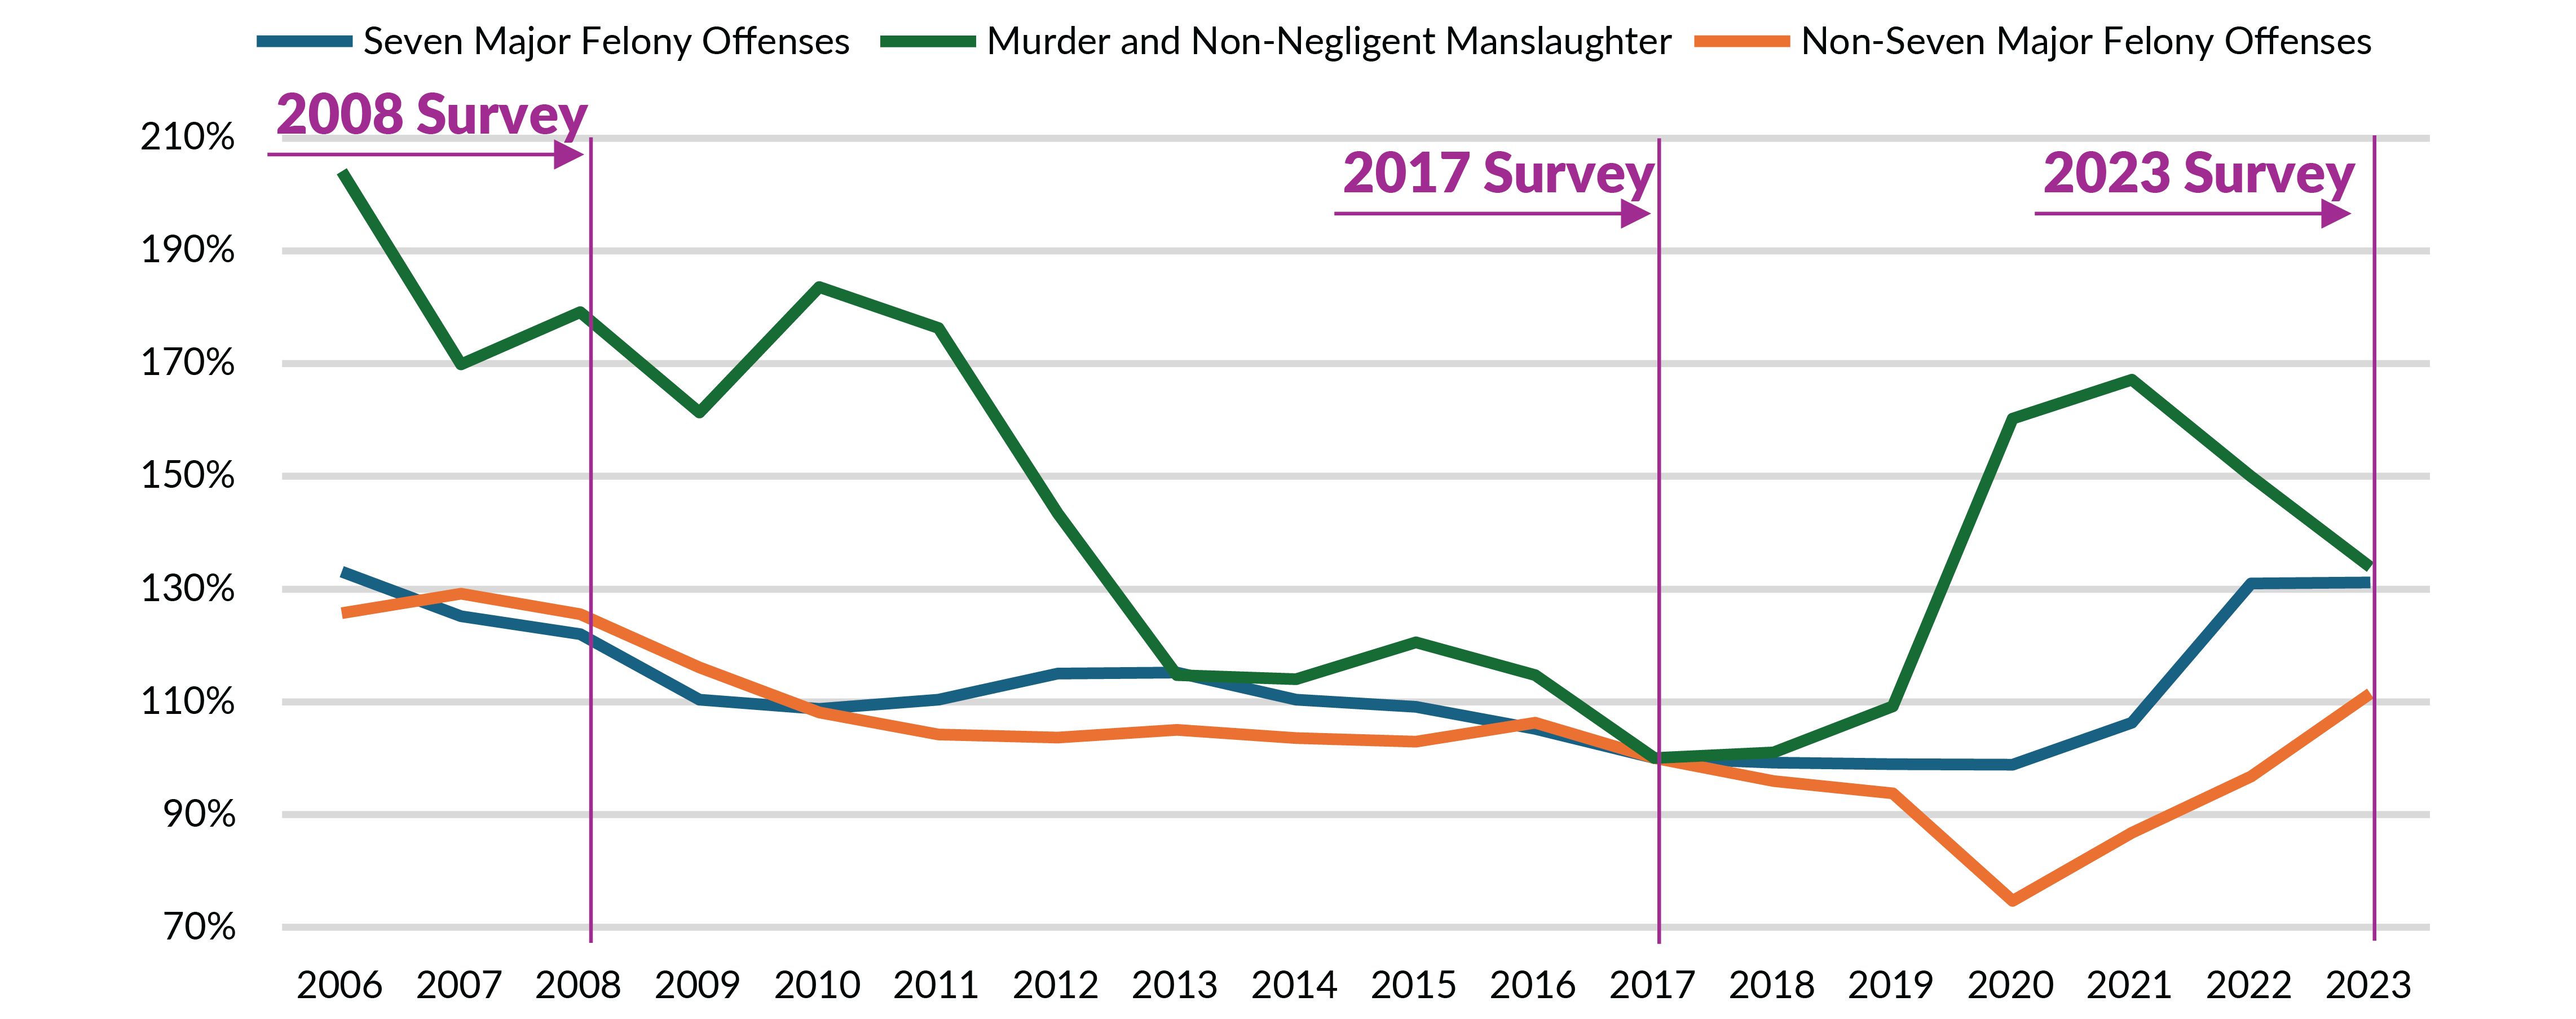
City of New York, Police Department, “Historical New York City Crime Data” (accessed March 13, 2024), https://www.nyc.gov/site/nypd/stats/crime-statistics/historical.page.
FINDINGS: NEW YORKERS FEEL LESS POSITIVE, NOT VERY SAFE; UNSATISFIED WITH MOST CITY SERVICES
Currently, as New York emerges from the pandemic, only 30 percent of New Yorkers rate the quality of life as excellent or good, and one-third rate it as poor. Differences by geography can be stark, with the percent rating quality of life excellent or good being highest in Manhattan (40 percent) and lowest in the Bronx (22 percent). New Yorkers generally feel more positive about their neighborhood as a place to live than they feel about the City’s quality of life overall. New Yorkers generally rate public safety in their neighborhood low, and 37 percent now rate it excellent or good, which is down from 50 percent in 2017. Those rating public safety in their neighborhood as excellent or good ranges from 28 percent for Hispanic New Yorkers to 36 percent for Black New Yorkers and 47 percent for White New Yorkers. The ratings of government services dropped by half, with 24 percent now rating them excellent or good, down from 44 percent in 2017.
Just 3 in 10 New Yorkers Rated the Quality of Life in New York City as Excellent or Good, Down from 5 in 10 in 2008 and 2017
Only 30 percent of New Yorkers rate quality of life in NYC as excellent or good in 2023; 42 percent less than the 51 percent rating it positively in both 2008 and 2017. (See Figure 3.) Conversely, in 2023, seven out of 10 New Yorkers say that NYC quality of life is either fair or poor.
White and Asian New Yorkers are modestly more positive—38 percent and 33 percent rate quality of as good or excellent, respectively—both groups also see dramatic decreases from 2017, similar to the citywide decline. The largest drop in satisfaction with quality of life is for Hispanic New Yorkers, a 56 percent decrease from 47 percent positive in 2017 to just 21 percent positive in 2023—the lowest percentage in this category across all races and ethnicities.
The smallest, though still very sizeable, drop in quality-of-life satisfaction is among Black New Yorkers: 29 percent are positive in 2023, down from 42 percent in 2017.
Satisfaction by income follows a U-shaped curve. At the high ends of the curve, 29 percent of low-income households, those under $35,000 in annual income, and 32 percent of households with annual incomes from $100,000 to $200,000 rate NYC quality of life as good or excellent. In between and at the bottom of the “U,” are households with annual income between $35,000 and $49,999, with an excellent/good rate of 23 percent, households with annual income between $50,000 and $99,999, with an excellent/good rate of 27 percent.
Higher-income households, those with annual incomes exceeding $200,000, remain the most satisfied with quality of life in the city, with 45 percent rating it excellent or good.
Erosion of buying power and New York City’s high costs may be contributing to significant decreases in satisfaction over time, even among higher-income households. For example, there is a 46 percent decrease in satisfaction for households making between $100,000 and $200,000 and even a 34 percent decrease for households making over $200,000.
Figure 3: Percent Rating NYC Quality of Life as Excellent or Good
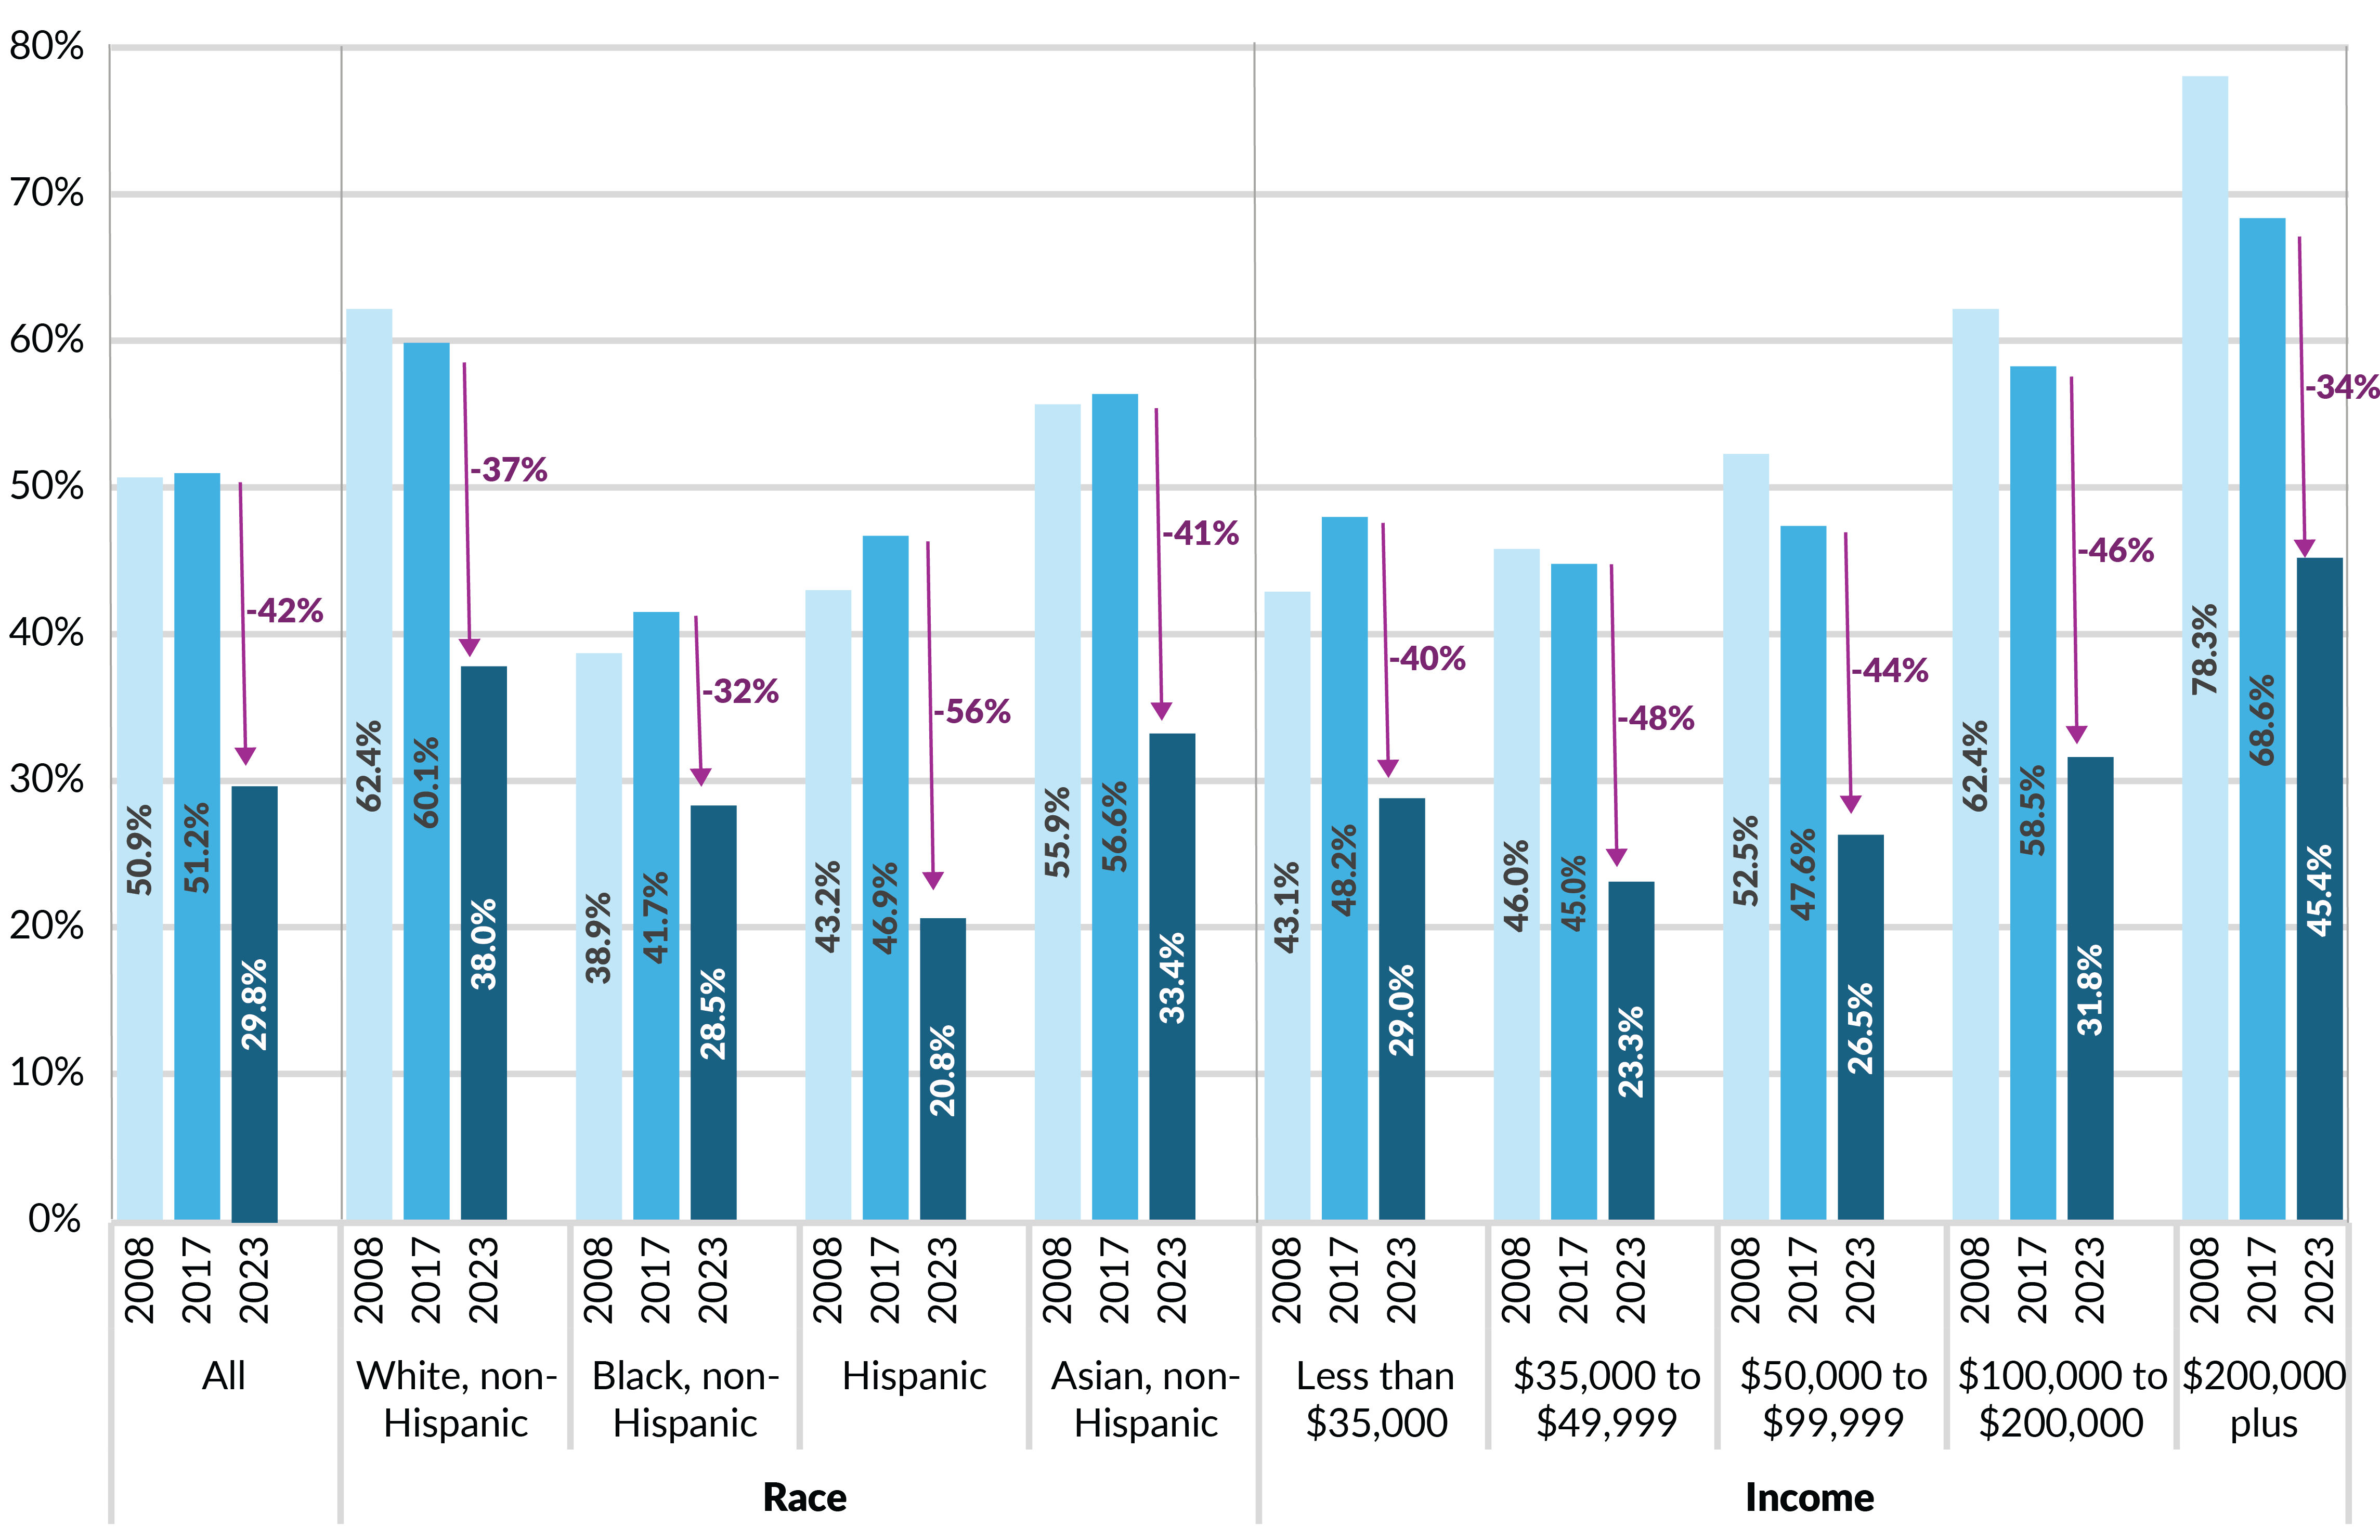
Race/ethnicity is a combination of two survey questions. Any respondent selecting Hispanic or Latino/a is coded as Hispanic. Among those who are non-Hispanic, if a respondent only selects White, Black or Asian/Pacific Islander, he/she is coded as White, non-Hispanic; Black, non-Hispanic; or Asian, non-Hispanic; respectively. Any respondent selecting American Indian, Eskimo, or Aleut; or two-plus races was coded as Other.
CBC Analysis of CBC NYC Resident Feedback Survey 2017 and 2023 editions; and City of New York, Mayor's Office of Operations, "NYC Feedback: Citywide Customer Survey Results" (March 2009), https://www.nyc.gov/site/operations/performance/nycfeedback-citywide-customer-service-results.page.
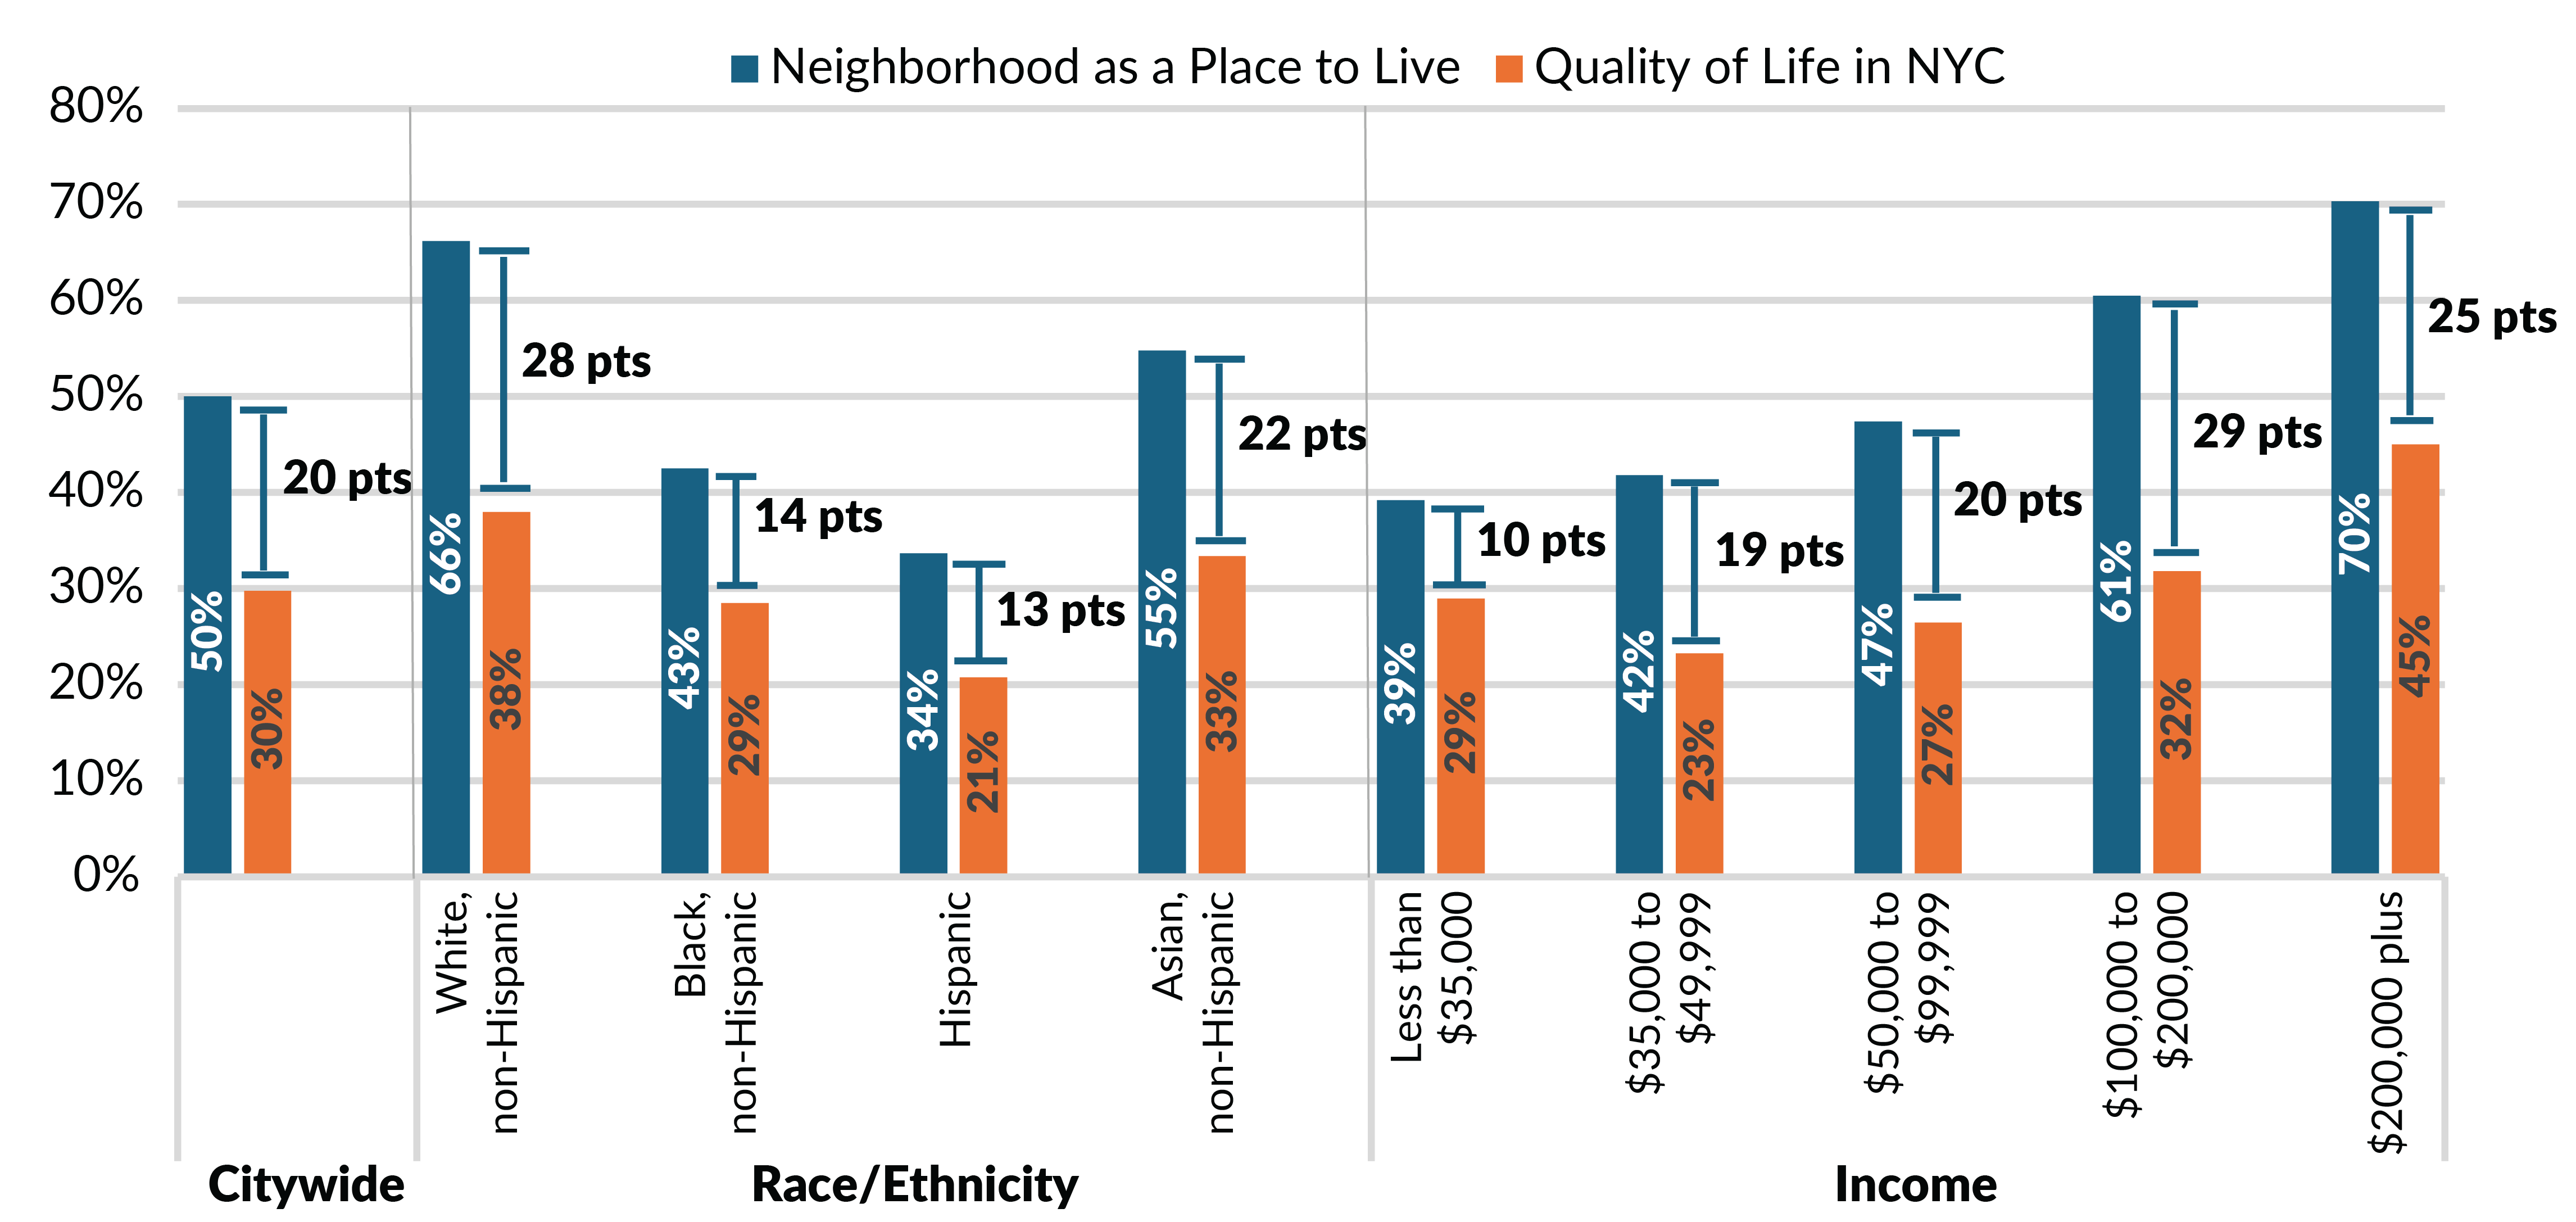
New Yorkers Generally More Satisfied with Life in Their Neighborhood than in City as Whole, Southern and Central Bronx a Notable Exception
Overall, the percentage of respondents rating their neighborhood as an excellent or good place to live was higher than the percentage for the city as a whole; negative feelings about quality of life in the city are not mirrored in negative perceptions of the neighborhood. Nonetheless, Black and Hispanic respondents and those making under $100,000 give their neighborhoods negative ratings, with fewer than 50 percent satisfied.
This satisfaction gap—the difference between the share who rate the city and their neighborhood favorably—is 20 percentage points citywide. While just 3 out of 10 rate city quality of life positively, 5 out of the 10 view life in their neighborhood positively. This gap is wider for White and Asian respondents, as well as those with household incomes over $100,000, who are even more positive about their neighborhood than the city as a whole. Conversely, the gaps are narrower for Black and Hispanic New Yorkers, meaning that their assessment of the neighborhood is more similar to their assessment of the city as whole. That similarly applies to households making less than $35,000 a year.
Figure 4: New Yorkers' Satisfaction Gap Between City and Neighborhood, 2023
Race/ethnicity is a combination of two survey questions. Any respondent selecting Hispanic or Latino/a is coded as Hispanic. Among those who are non-Hispanic, if a respondent only selects White, Black or Asian/Pacific Islander, he/she is coded as White, non-Hispanic; Black, non-Hispanic; or Asian, non-Hispanic; respectively. Any respondent selecting American Indian, Eskimo, or Aleut; or two-plus races was coded as Other.
CBC Analysis of CBC NYC Resident Feedback Survey, 2023.
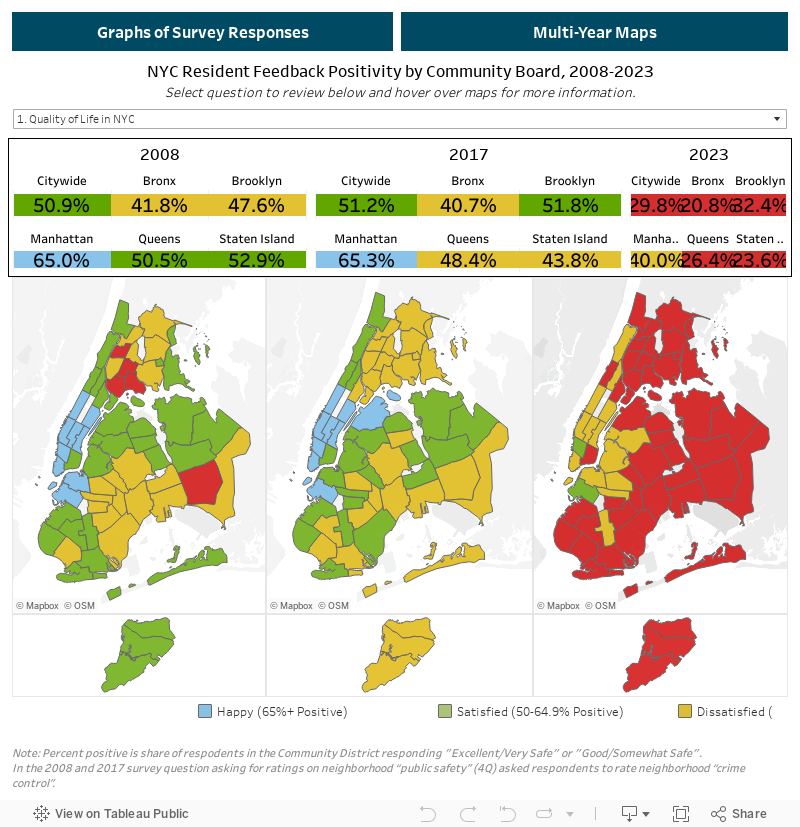
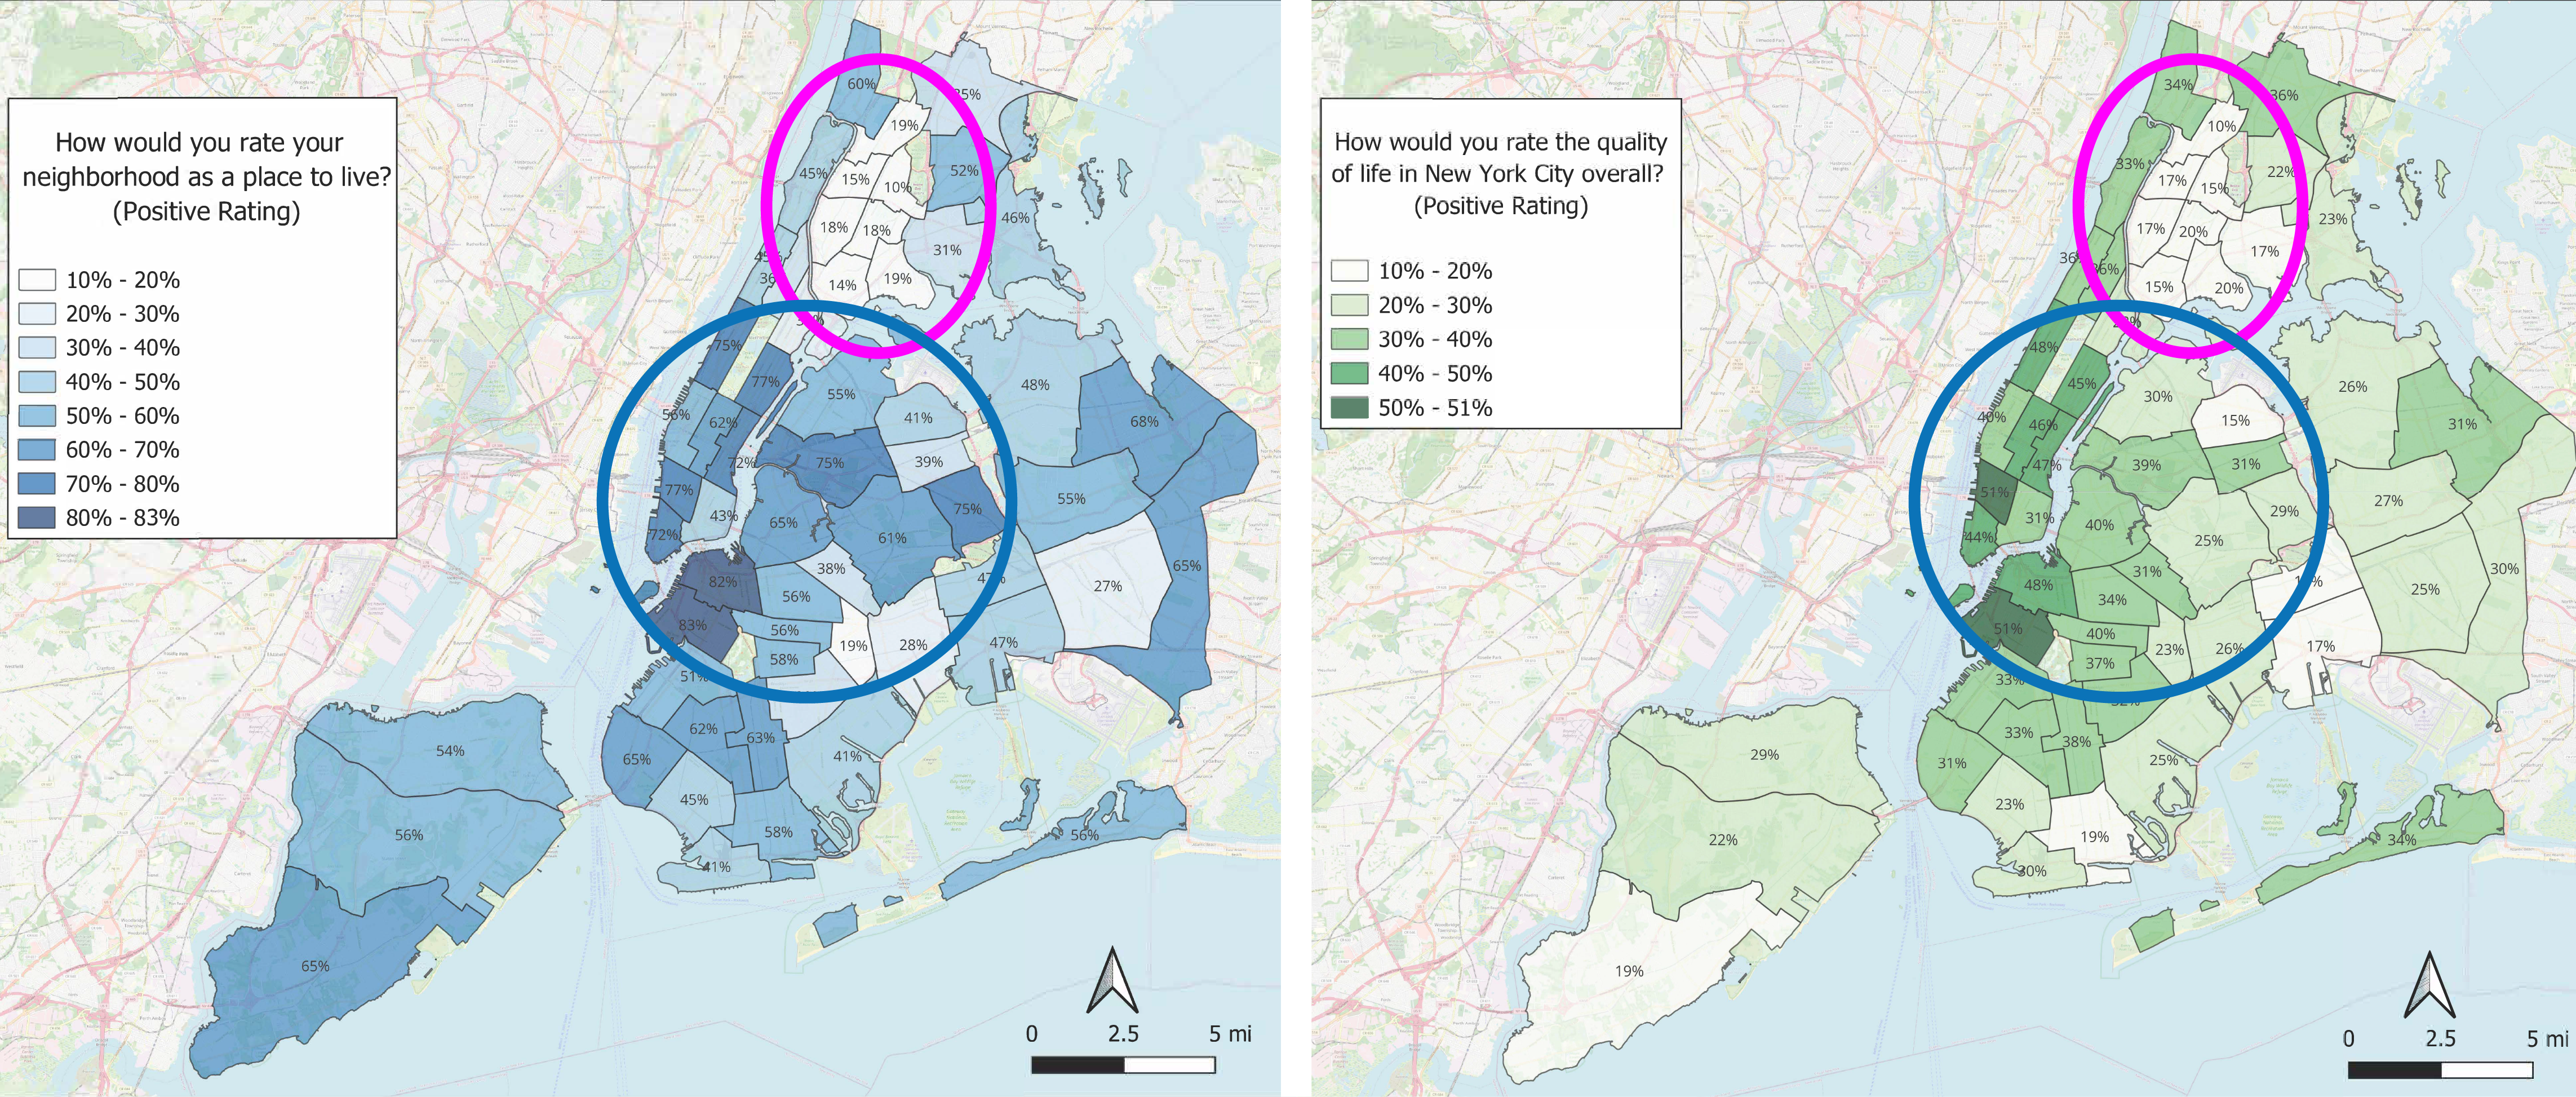
Satisfaction with quality of life in neighborhoods and in the city varies across neighborhoods. (See Figure 5.) The highest neighborhood satisfaction ratings are in Brownstone Brooklyn and nearby neighborhoods, in Manhattan below 110th Street, and eastern Queens. (See the blue circles in Figure 5.) Furthermore, the satisfaction gap is evident for most Community Boards, with a notable exception for southern and central Bronx. (See the pink circles in Figure 5.) In these seven community boards, respondents are equally negative about their neighborhood and the city, suggesting they encountered particularly challenging local conditions, such as crime, lack of cleanliness, or lower quality services.
Figure 5: Shares Rating their Neighborhood and NYC As Excellent or Good, by Community Board, 2023
Citizens Budget Commission, "NYC MAPS (Q1 Q2 Q7 Q14)" (Prepared by Polco, February 17, 2024).
New Yorkers Feel Much Less Safe
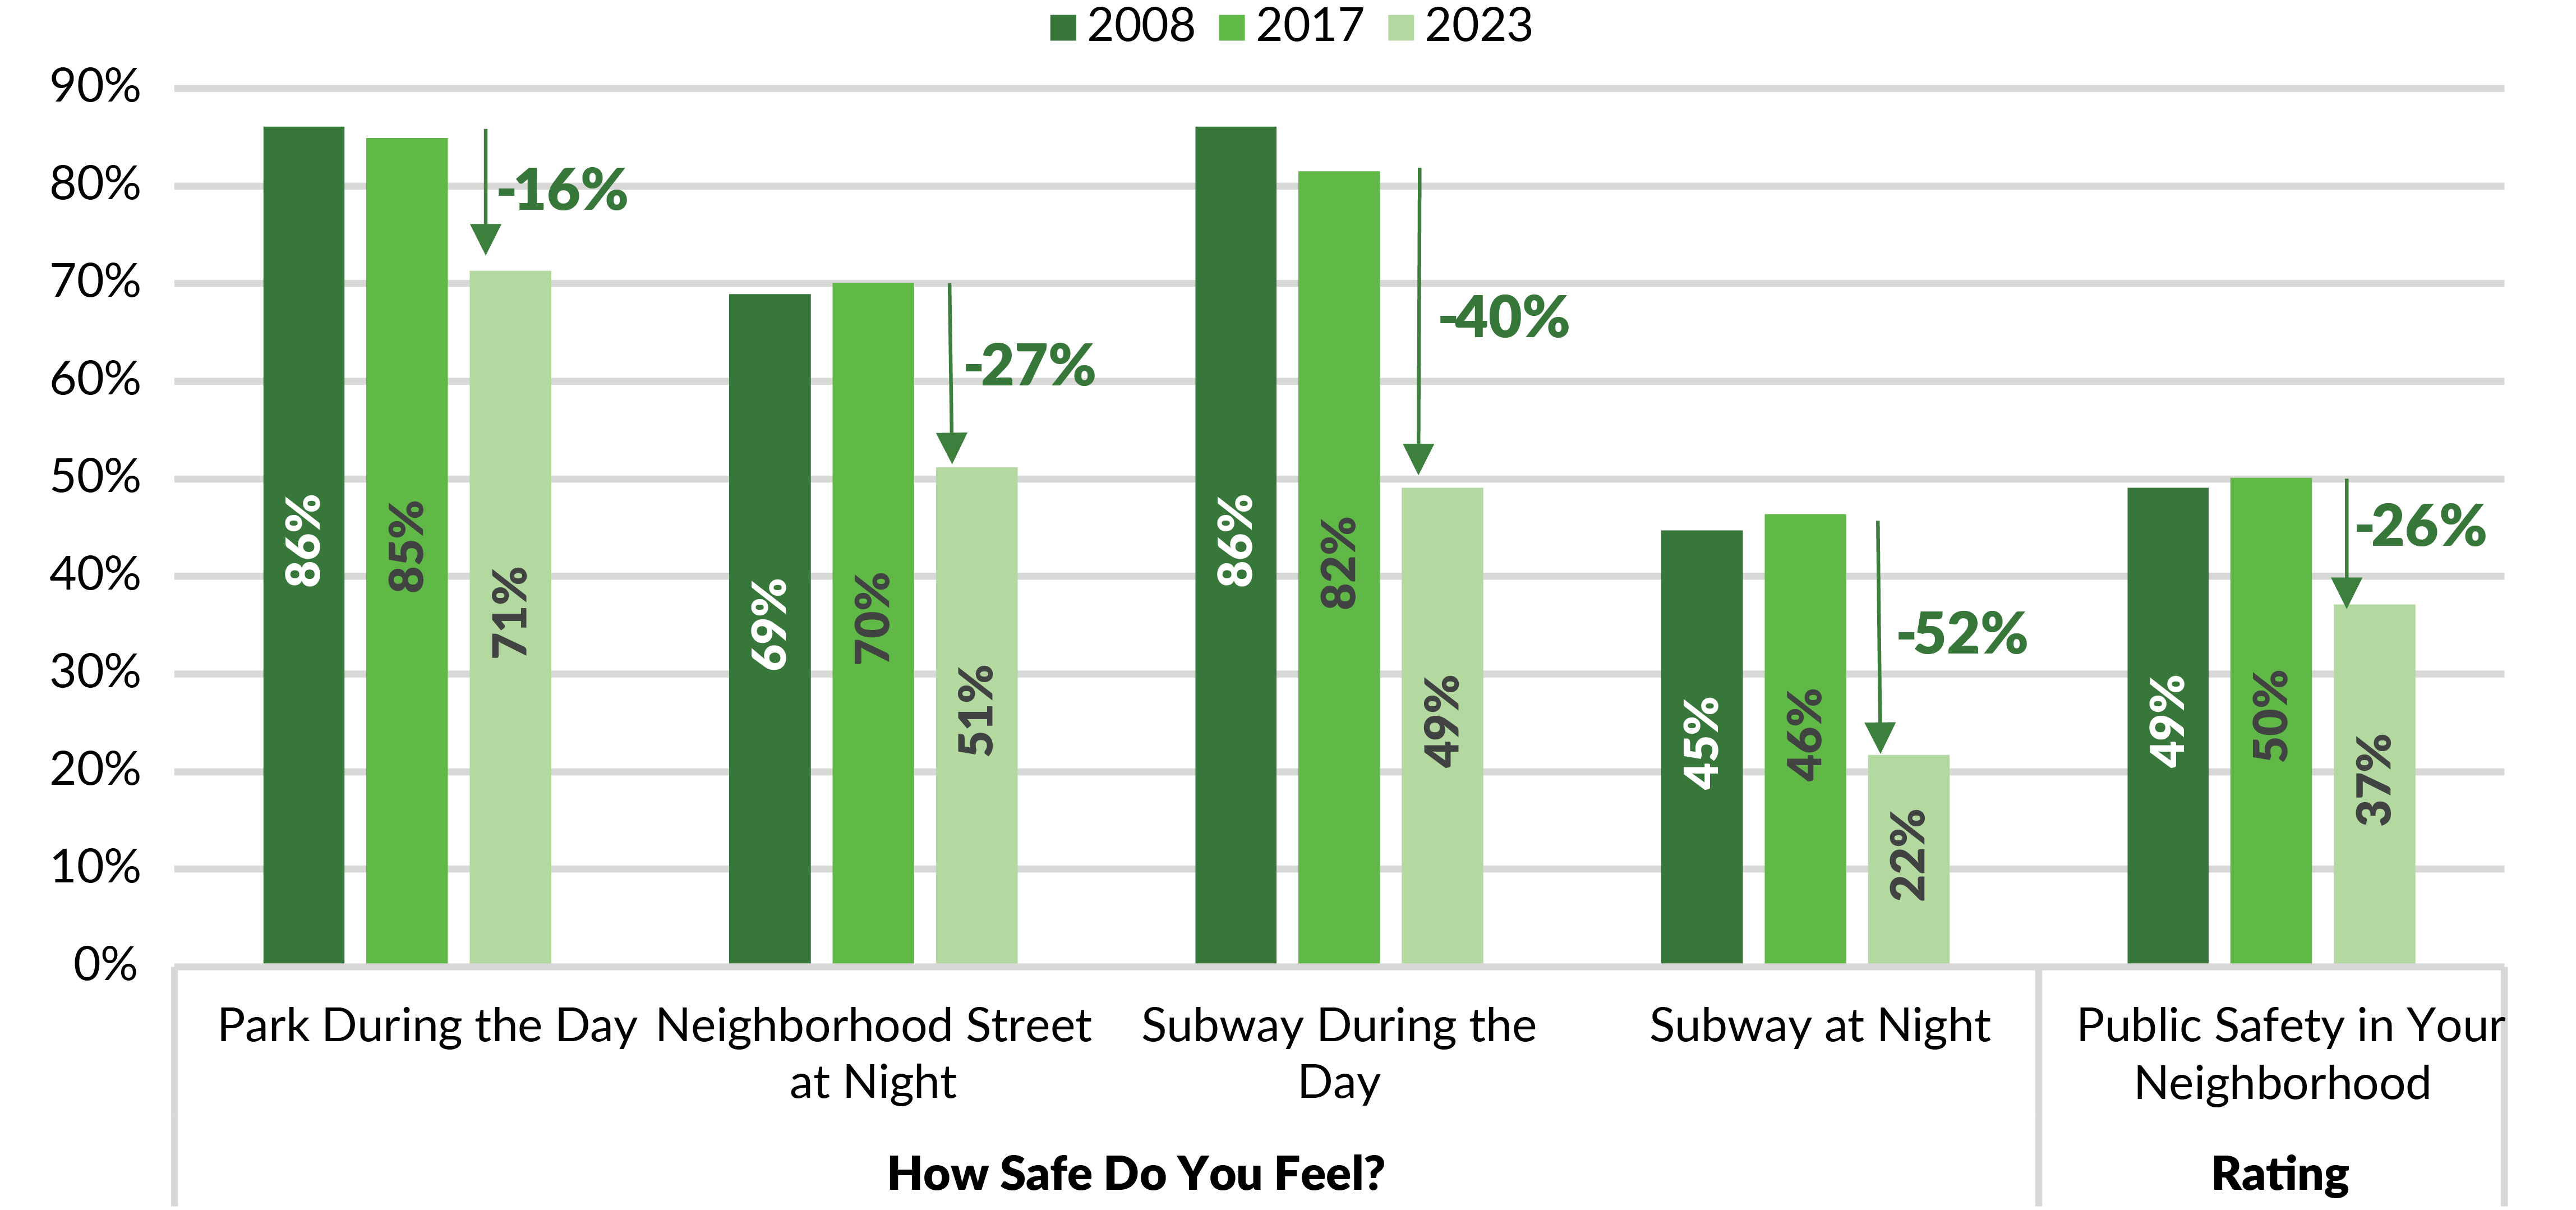
Only 37 percent of New Yorkers rate public safety in their neighborhood as excellent or good, down from 50 percent in 2017.5 (See Figure 6.) New Yorkers in 2023 feel as safe in the park during the day as they felt walking in their neighborhood at night six years ago.
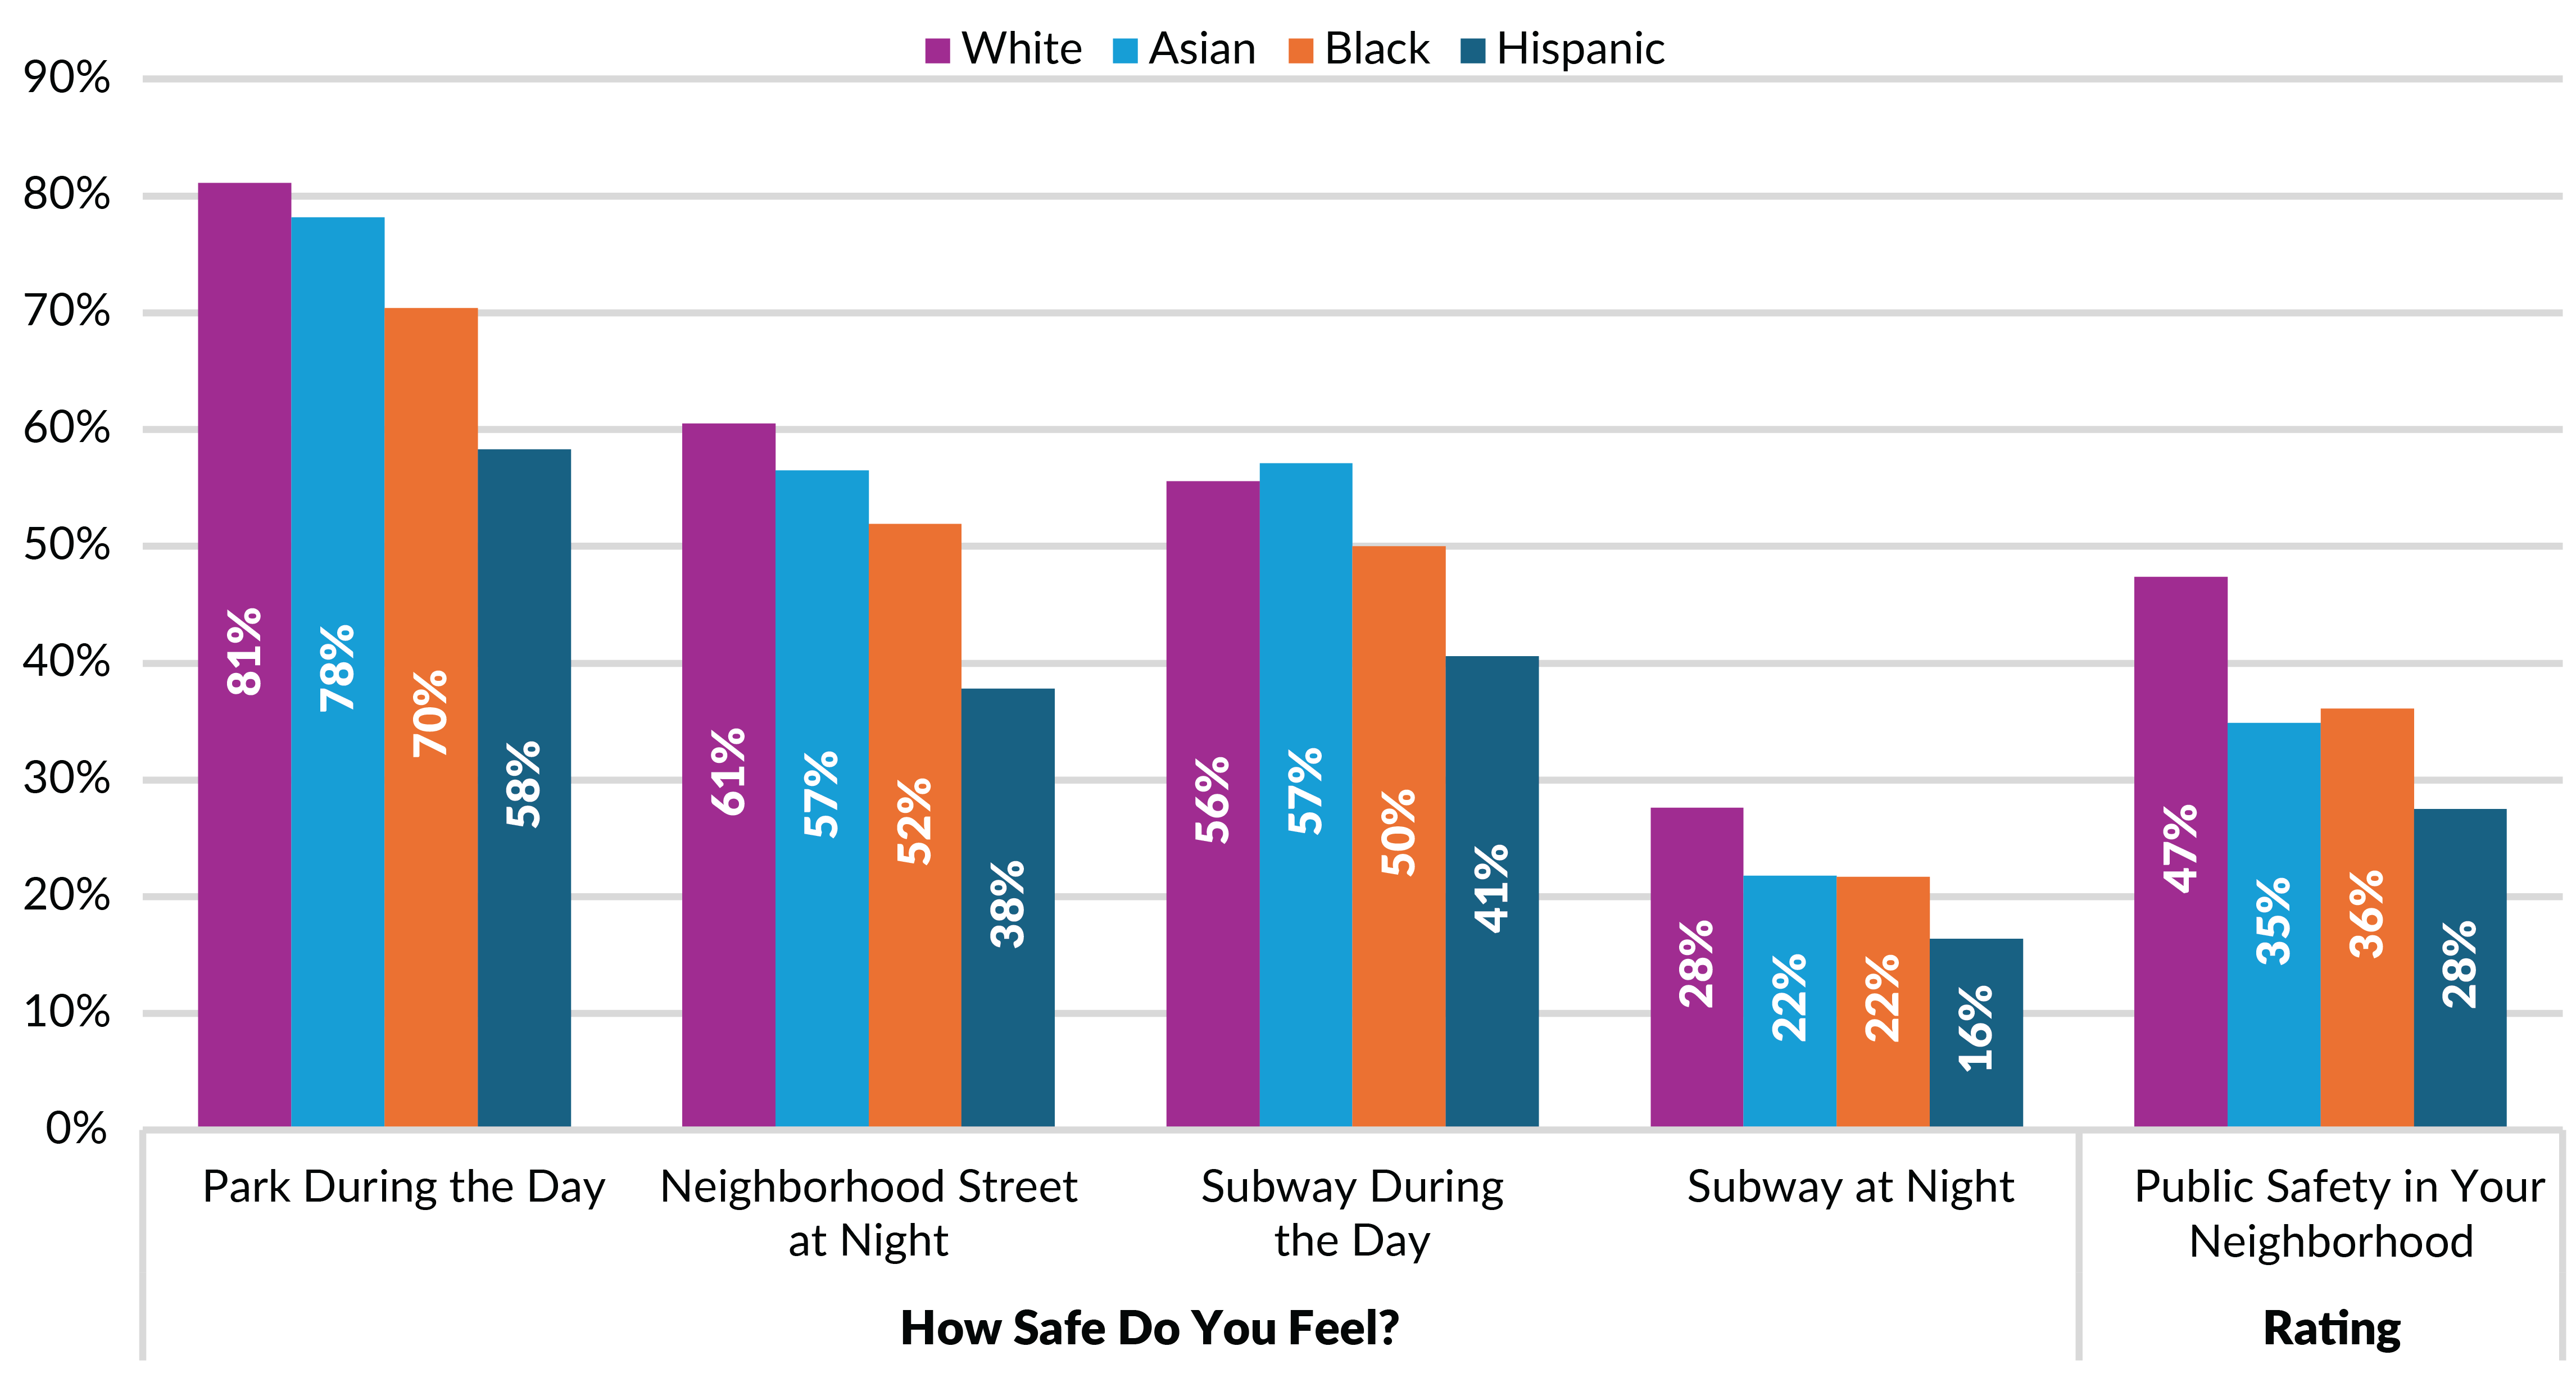
On the positive side, despite the 16 percent decrease in the percent of New Yorkers who feel safe in parks and playgrounds during the daytime, the share is still relatively high, at 70 percent. In fact, this is the survey item with the largest share responding positively. White and Asian New Yorkers were even more positive, 81 percent and 78 percent, respectively, while 70 percent of Black respondents feel safe or very safe in parks during the daytime; the rate is 58 percent for Hispanic New Yorkers. (See Figure 7.)
There is a larger relative decrease in the percent reporting they feel very safe or somewhat safe walking alone on their neighborhood streets at night, down 27 percent, from 71 percent in 2017 to 51 percent in 2023. As above, Hispanic New Yorkers feel the least safe—just 38 percent—and it is the only race/ethnicity group below 50 percent.
Subway safety ratings decline more sharply, with a 40 percent decrease in the daytime subway safety and a 52 percent decrease in nighttime subway safety. In 2023, fewer than half of all New Yorkers report feeling very safe or somewhat safe on the subway, and that falls to just 22 percent for nighttime subway safety.
While Asian New Yorkers’ feelings of safety largely mirrored White New Yorkers, nighttime subway safety is the exception—just 22 percent of Asian New Yorkers feel safe. This is the same rate as Black New Yorkers. On all safety questions, Hispanic New Yorkers are the least likely to report feeling safe, and it is between 6 and 14 percentage points lower than Black New Yorkers.
Figure 6: Percent Rating Public Safety Items Excellent or Good Over Time
Public safety in your neighborhood question was phrased as crime control in your neighborhood in 2017.
CBC Analysis of CBC NYC Resident Feedback Survey 2017 and 2023 editions; and City of New York, Mayor's Office of Operations, "NYC Feedback: Citywide Customer Survey Results" (March 2009), https://www.nyc.gov/site/operations/performance/nycfeedback-citywide-customer-service-results.page.
Figure 7: Percent Rating Public Safety Items Excellent or Good by Race/Ethnicity
Public safety in your neighborhood question was phrased as crime control in your neighborhood in 2017. Race/ethnicity is a combination of two survey questions. Any respondent selecting Hispanic or Latino/a is coded as Hispanic. Among those who are non-Hispanic, if a respondent only selects White, Black or Asian/Pacific Islander, he/she is coded as White, non-Hispanic; Black, non-Hispanic; or Asian, non-Hispanic; respectively. Any respondent selecting American Indian, Eskimo, or Aleut; or two-plus races was coded as Other.
CBC Analysis of CBC NYC Resident Feedback Survey, 2023.
New Yorkers Generally Dissatisfied with City Government and City Services, with Important Exceptions
Just 24 percent of New Yorkers rate NYC government services as excellent or good, compared to 44 percent in 2017. (See Figure 8.) There are also significant declines in the percent responding favorably about whether the City promotes economic growth (24 percent, down from 41 percent), prepares the City for an emergency (23 percent, down from 48 percent) and spends tax dollars wisely (11 percent, down from 21 percent). Just 1 in 10 New Yorkers are positive about how the City is addressing all New Yorker’s housing needs, a new question added in 2023.
Figure 8: Percent of New Yorkers Rating City Government as Excellent or Good
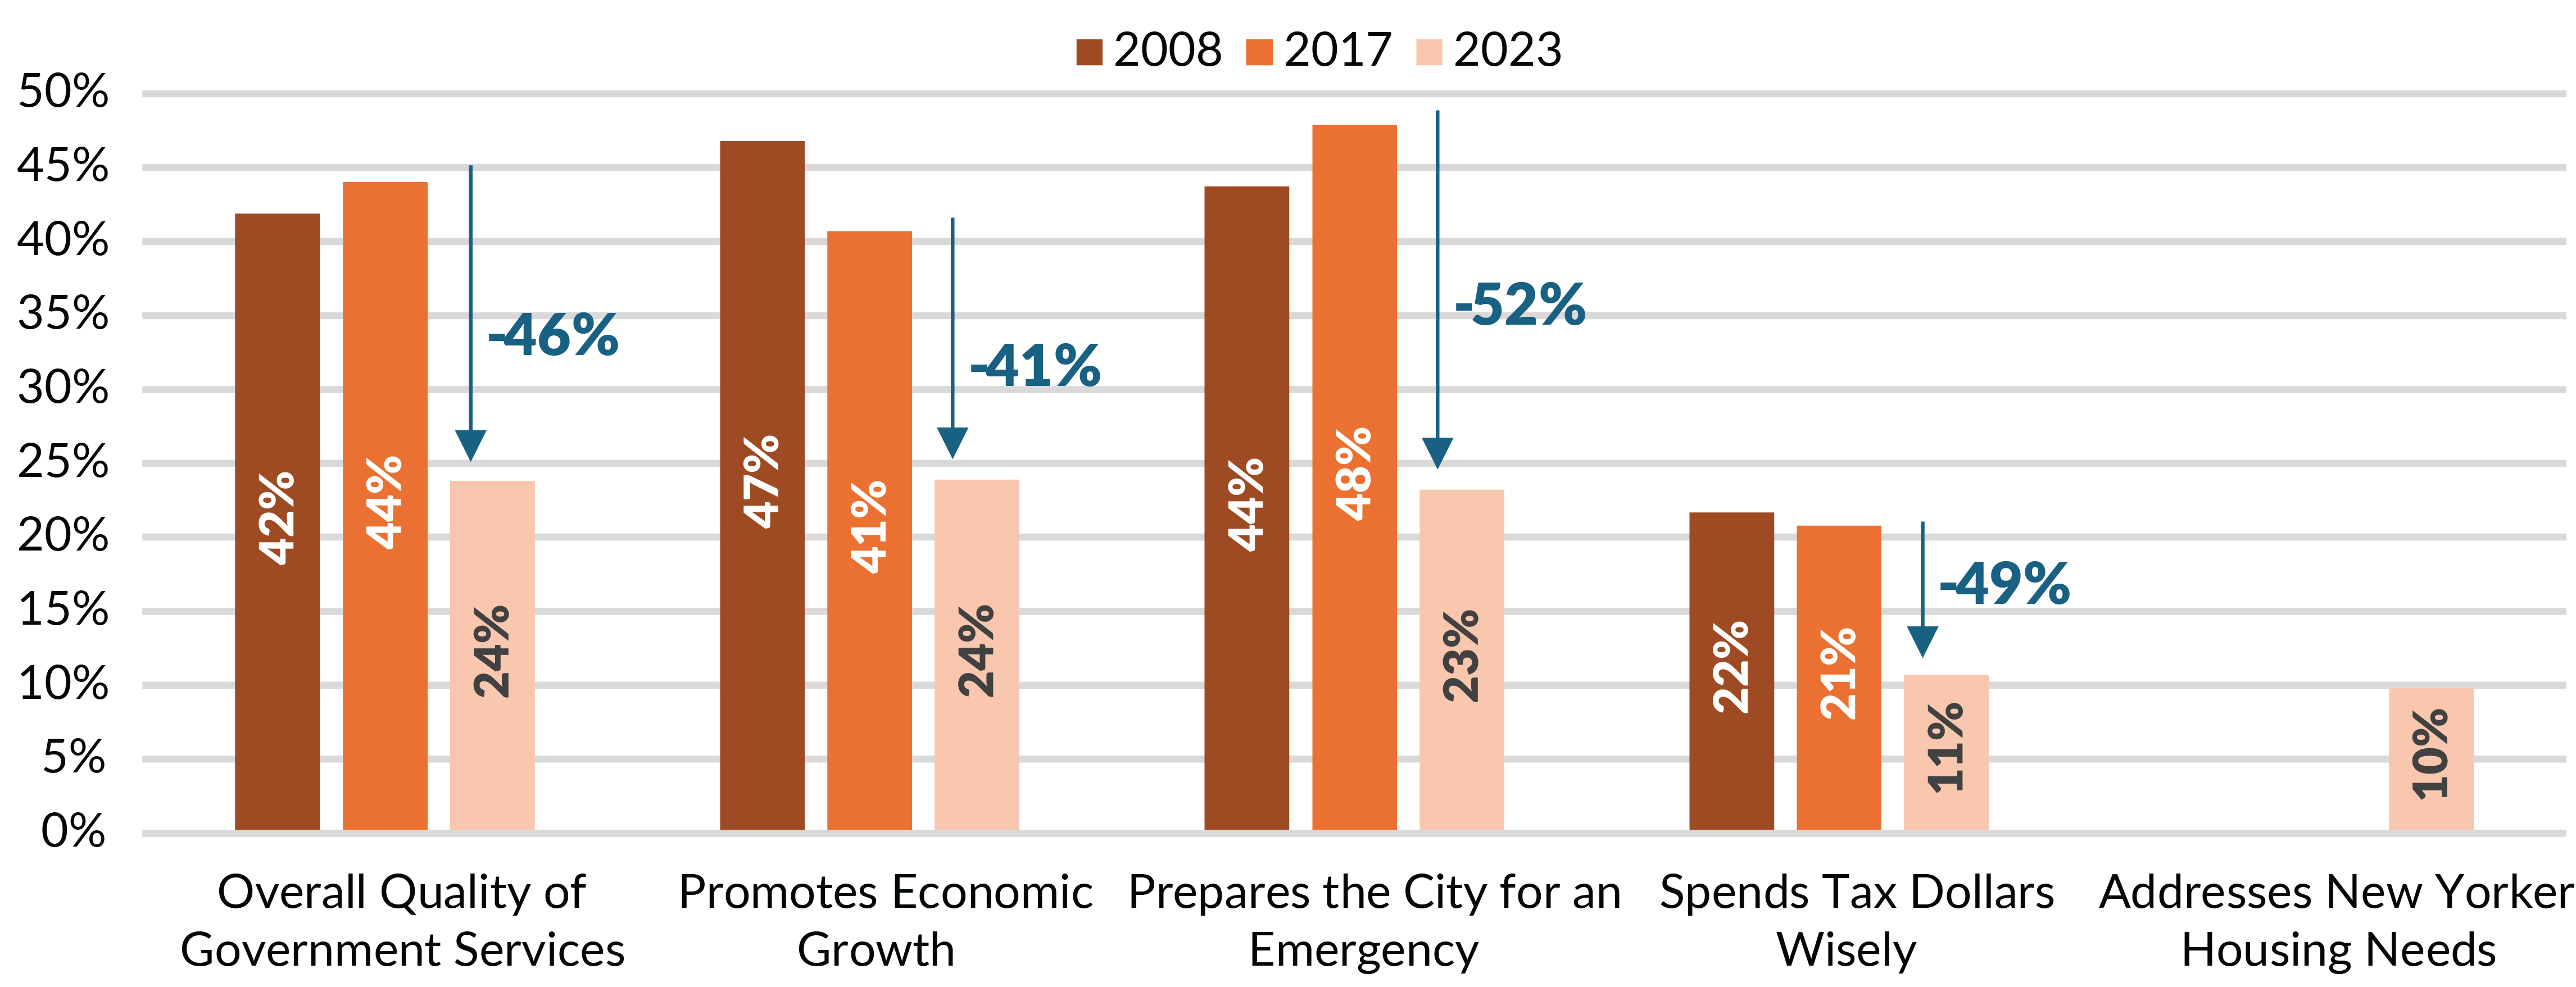
CBC Analysis of CBC NYC Resident Feedback Survey 2017 and 2023 editions; and City of New York, Mayor's Office of Operations, "NYC Feedback: Citywide Customer Survey Results" (March 2009), https://www.nyc.gov/site/operations/performance/nycfeedback-citywide-customer-service-results.page.
Of the 32 services and programs on the survey, New Yorkers are happy with just two services and satisfied with a handful of services; they are dissatisfied or unhappy with the majority. (Happy is defined as over 65 percent rating excellent or good; satisfied as 50 percent to 65 percent; dissatisfied as 35 percent to 50 percent, and unhappy as less than 35 percent.)
White New Yorkers are more satisfied with services and are the only group to be happy with any of the City’s services; nonetheless, even White New Yorkers are dissatisfied or unhappy with most services. Asian New Yorkers’ ratings are similar to White New Yorkers’, except that they are not happy with any services; instead Asian New Yorkers are satisfied or dissatisfied with slightly more services.
Black New Yorkers are dissatisfied or unhappy with nearly 80 percent of the services, while Hispanic New Yorkers are dissatisfied or unhappy with nearly 90 percent of services.
Figure 9: Satisfaction with Government Services by Race/Ethnicity
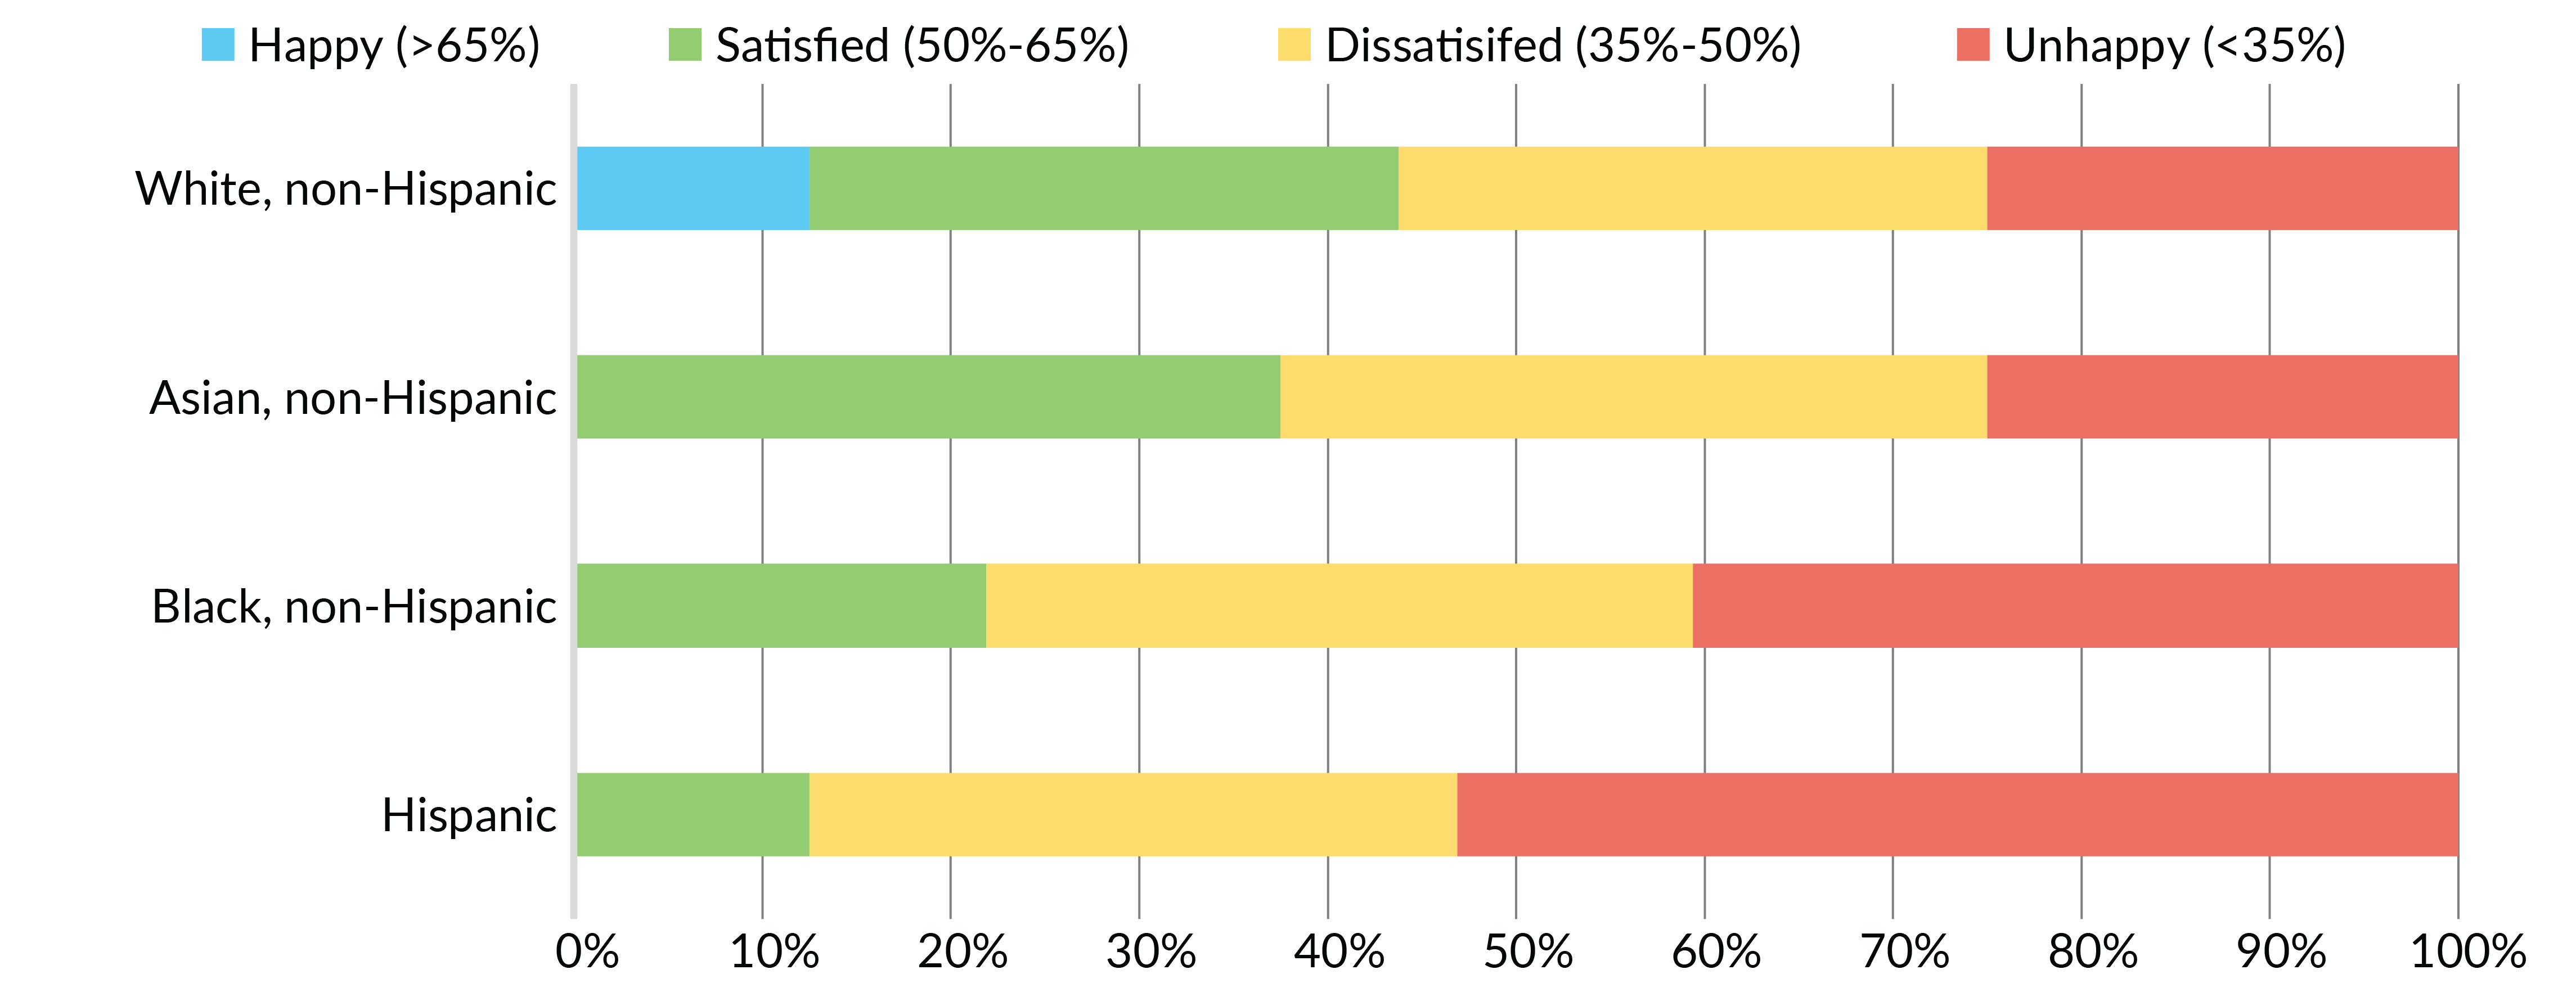
Race/ethnicity is a combination of two survey questions. Any respondent selecting Hispanic or Latino/a is coded as Hispanic. Among those who are non-Hispanic, if a respondent only selects White, Black or Asian/Pacific Islander, he/she is coded as White, non-Hispanic; Black, non-Hispanic; or Asian, non-Hispanic; respectively. Any respondent selecting American Indian, Eskimo, or Aleut; or two-plus races was coded as Other.
CBC Analysis of CBC NYC Resident Feedback Survey 2017 and 2023 editions; and City of New York, Mayor's Office of Operations, "NYC Feedback: Citywide Customer Survey Results" (March 2009), https://www.nyc.gov/site/operations/performance/nycfeedback-citywide-customer-service-results.page.
New Yorkers are most satisfied with the Fire Department and Emergency Medical Services, with 68 percent and 65 percent rating as excellent or good, respectively. Libraries, sanitation, health care availability in the neighborhood, parks and playgrounds, 311, and bus services are other services rated favorably by more than half of New Yorkers. New Yorkers were dissatisfied with most education services, with between 35 percent and 50 percent rating them favorably. Cleanliness of the city, ease of travel, noise, rats, public housing, traffic, and homeless services are among the services New Yorkers are unhappy with. (For satisfaction of individual services, please see Table 1 in the appendix.)
Figure 10: Services By Percent of New Yorkers Rating as Excellent or Good, 2023
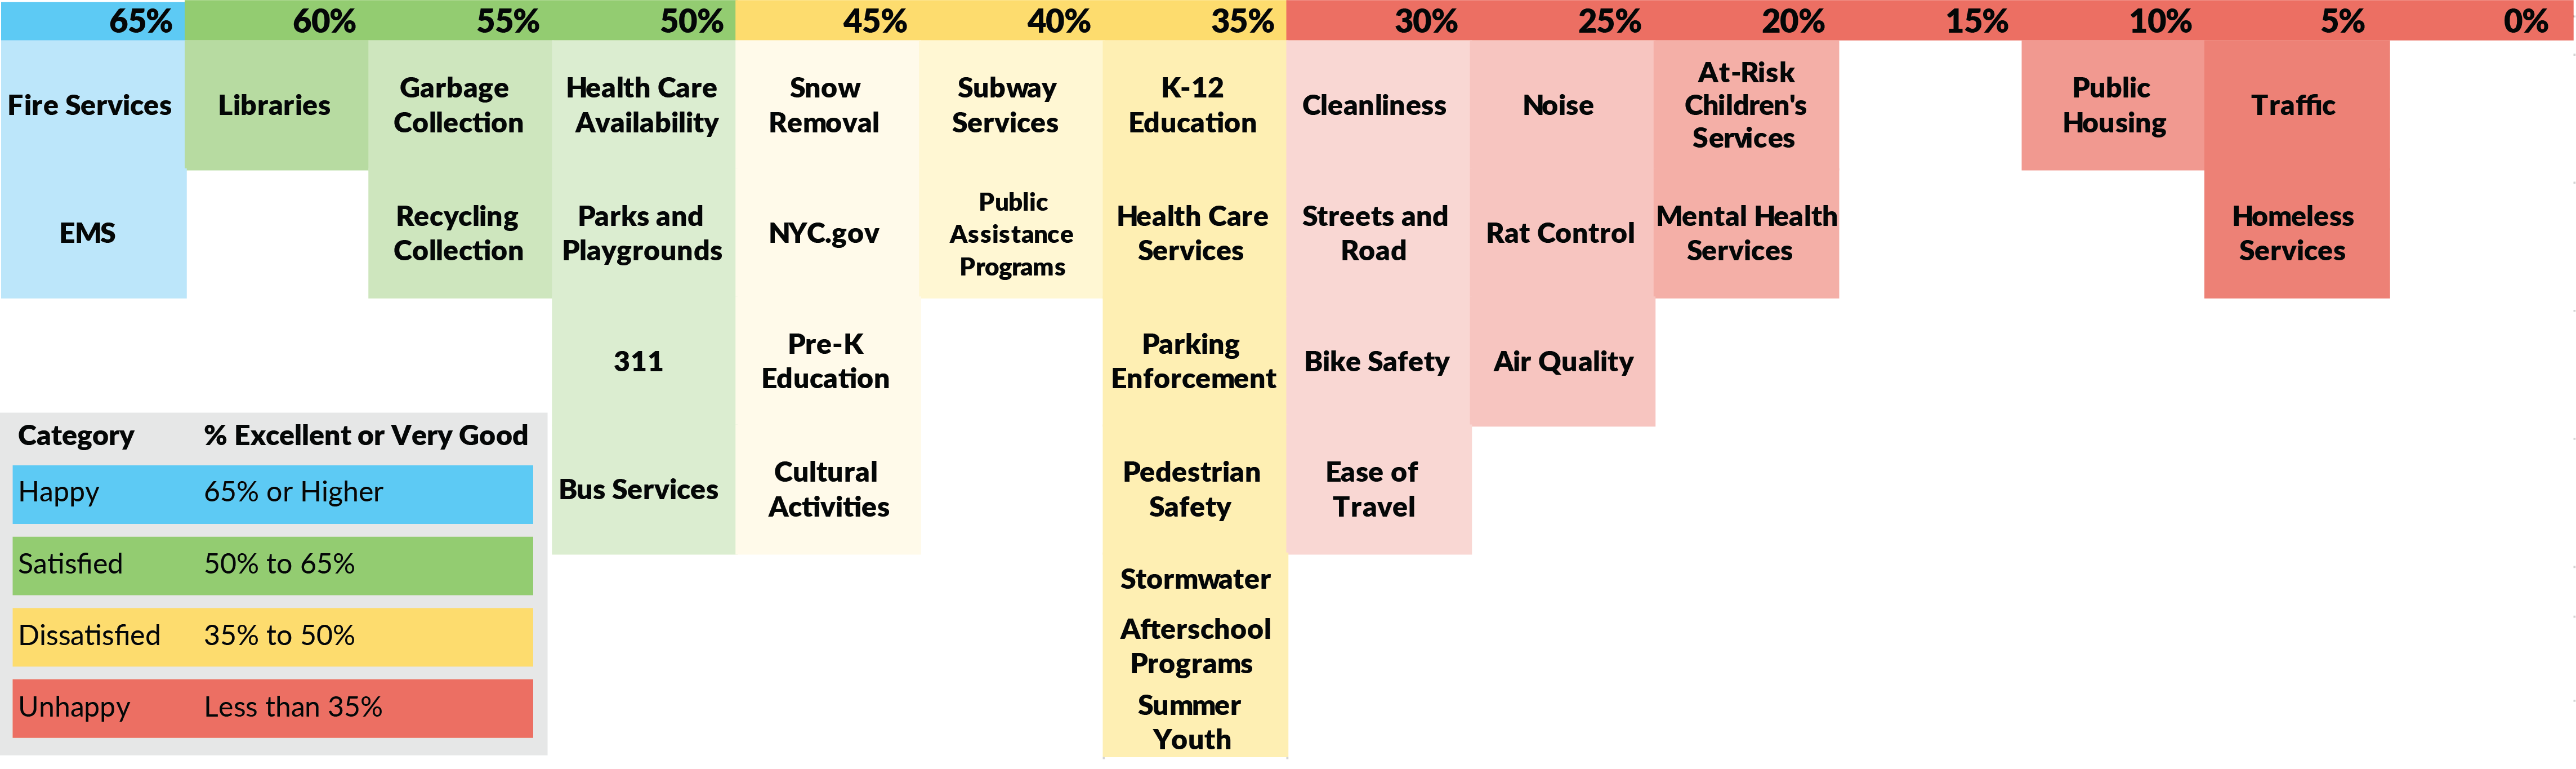
Source: CBC Analysis of CBC NYC Resident Feedback Survey, 2023.
Wealthier New Yorkers Tend to Feel Better about Both Quality of Life and Quality of Services; Those Making between $35,000 and $50,000 Typically the Most Negative
Satisfaction across income categories follows a very slight U-curve; satisfaction is modestly more positive among the lowest income group (less than $35,000) and bottoms out with households between $35,000 and $50,000. Low-income households that are eligible for many government services tend to be modestly more positive, while those with incomes over $100,000 are increasingly more positive, as higher incomes alleviate some of the affordability challenges in NYC. (See Figure 11.)
Figure 11: Satisfaction with Government Services by Income
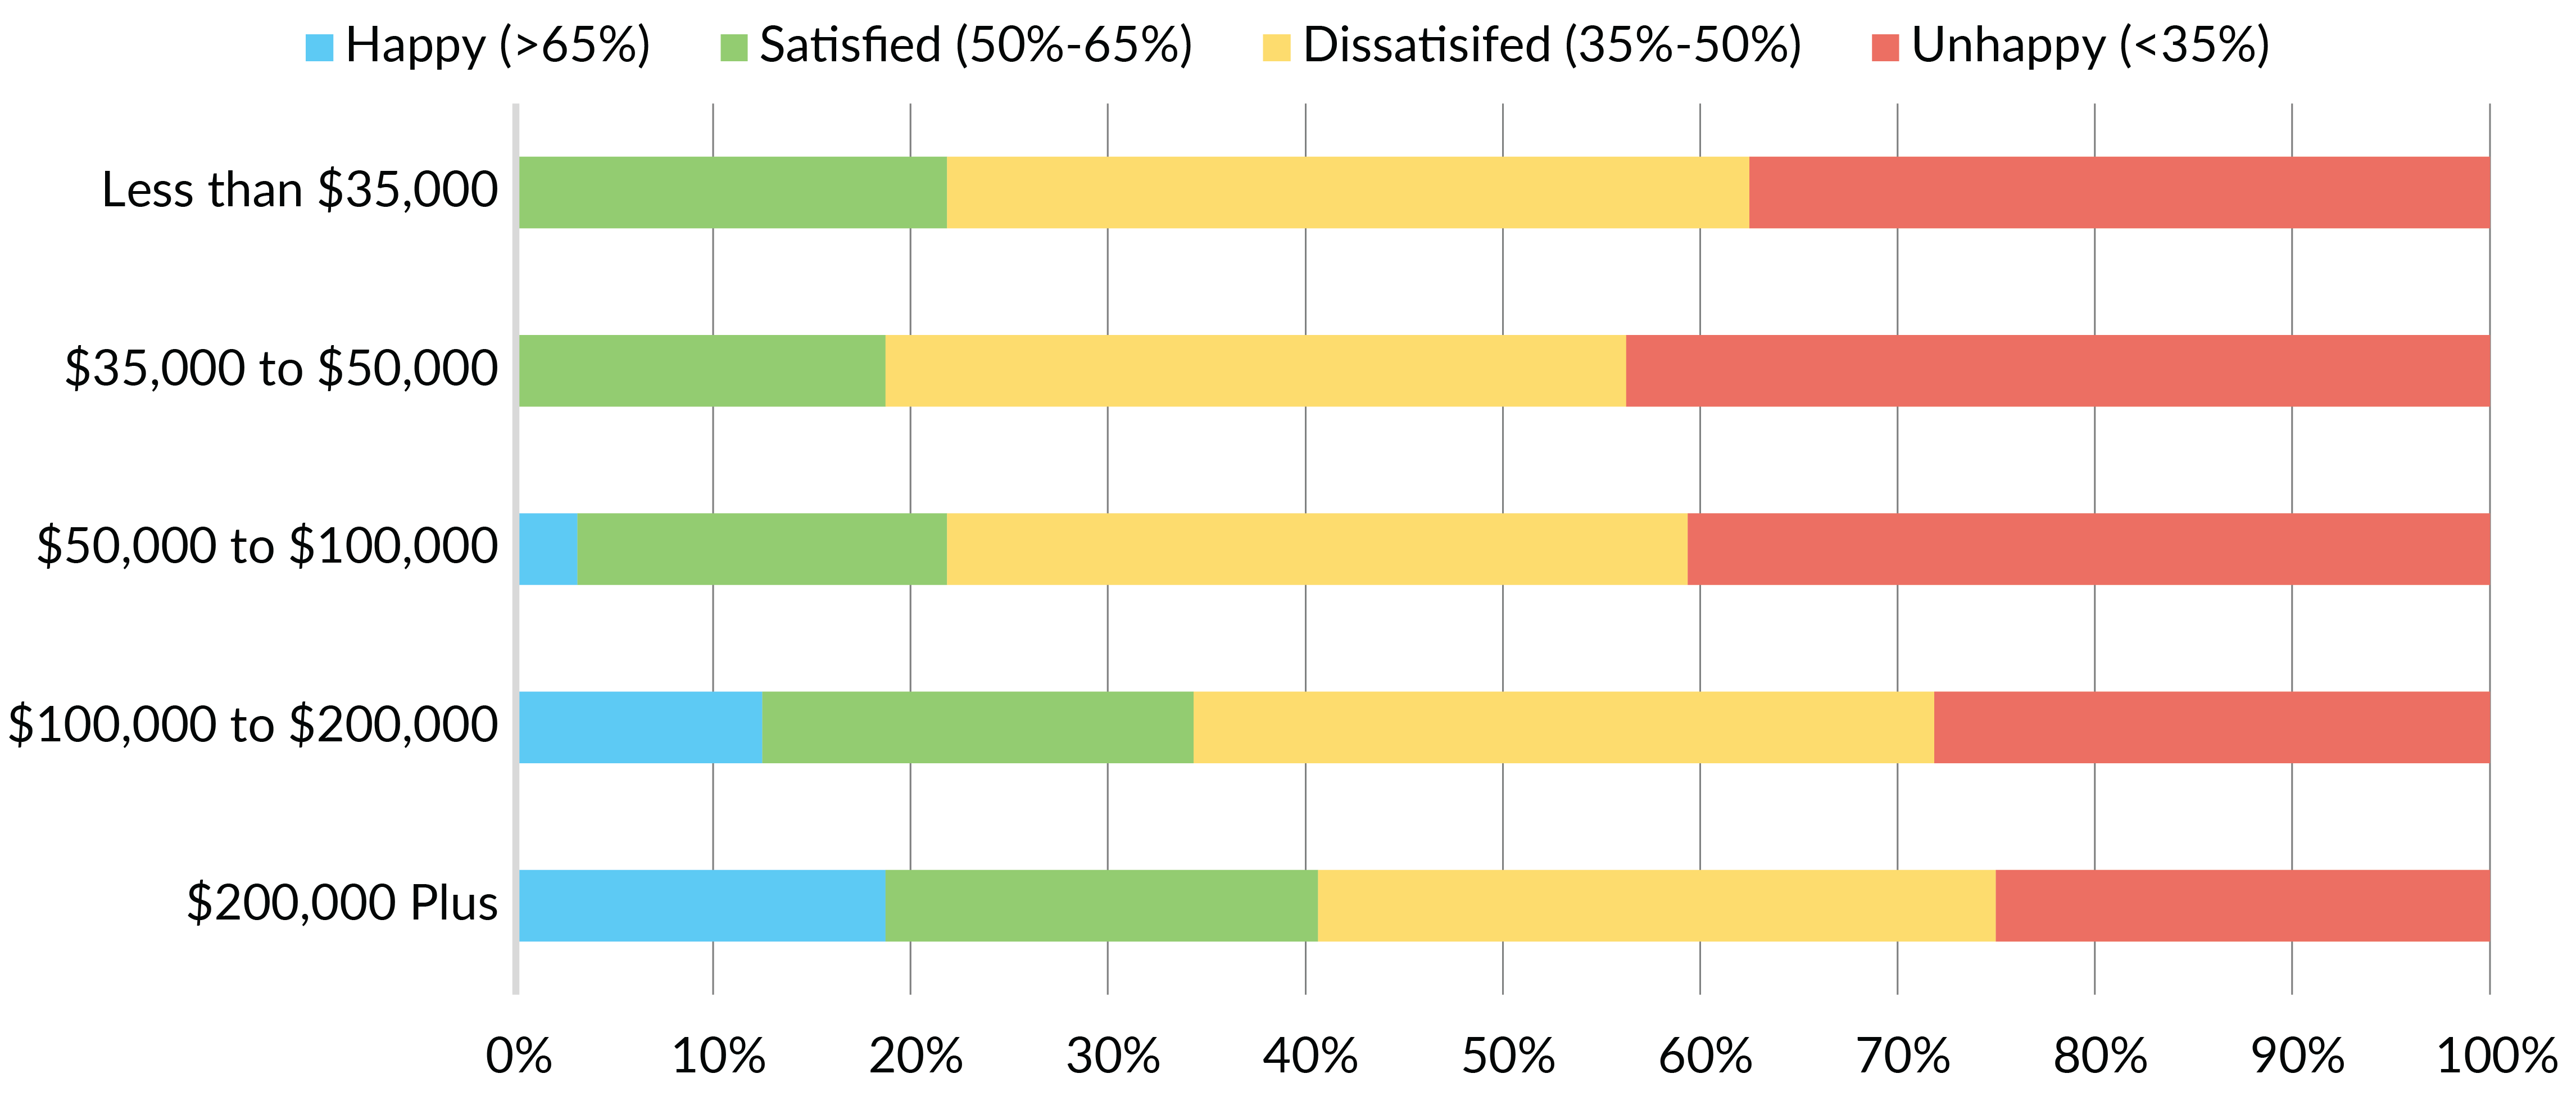
CBC Analysis of CBC NYC Resident Feedback Survey, 2023.
Significant Decline in Ratings for Individual Services/Efforts Much Greater for Hispanic and Asian Households
Hispanic households report the greatest decreases in satisfaction with services. For 15 of the 30 services on both the 2017 and 2023 survey, the share of Hispanic households reporting the service is excellent or good decreased by more than 25 percent. Furthermore, the sharing rating positively did not increase on any items for Hispanic households; the lowest decrease was 12 percent. For Asian households, there were nine items on which the decrease was more than 25 percent. For Black and White households, that level of decline in the share rating excellent or good is recorded for just four of the 30 services.
CITY GOVERNMENT PRIORITIES ARE ON THE RIGHT TRACK, BUT THERE IS A LONG WAY TO GO
Statistically valid, standardized, and consistent resident feedback surveys should be used to manage performance and identify areas that need improvement. The 2023 Resident Survey confirms that the Adams Administration is on the right track, with a focus on public safety, housing, rat mitigation, and mental health services.
These are areas where New Yorkers are the least satisfied with services. Furthermore, respondents named safety and crime (46 percent), housing (32 percent), cleanliness (22 percent), and homelessness and related services (22 percent) as the most important issues requiring more attention from City government. Efforts to fix these and service shortcomings should be continued and possibly intensified.
A large, random sample also provides direction for targeting services, such as place-based interventions; intensive efforts may be especially beneficial in areas such as southern and central Bronx. These findings also demonstrate that in some areas, working and middle-class New Yorkers feel most negatively about pedestrian safety and afterschool programs.
That New Yorkers, by and large, are displeased with the quality of life in New York and the quality of services suggests that a continued focus on the basics, with emphasis on quality over quantity, is in order. New Yorkers have especially unfavorable views about the provision of public housing and services for the homeless. The Administration has rightly been focused on these areas, where partnership from the State and federal governments is critical.
While a 50 percent drop in the share of New Yorkers who believe government is spending money wisely is notable, so is the fact that the share of those who view government spending favorably went from just 20 percent in 2017 to 10 percent in 2023; in other words, New Yorkers have been skeptical about the use of public resources for years. The City should prioritize spending on high-impact programs that deliver positive results and tackle the range of related policy challenges. Beyond that, the City should consider how to reduce spending and offer tax relief to middle-income households, who are feeling the City’s unaffordability acutely.
APPENDIX
Service Satisfaction Ratings by Race/Ethnicity, 2023
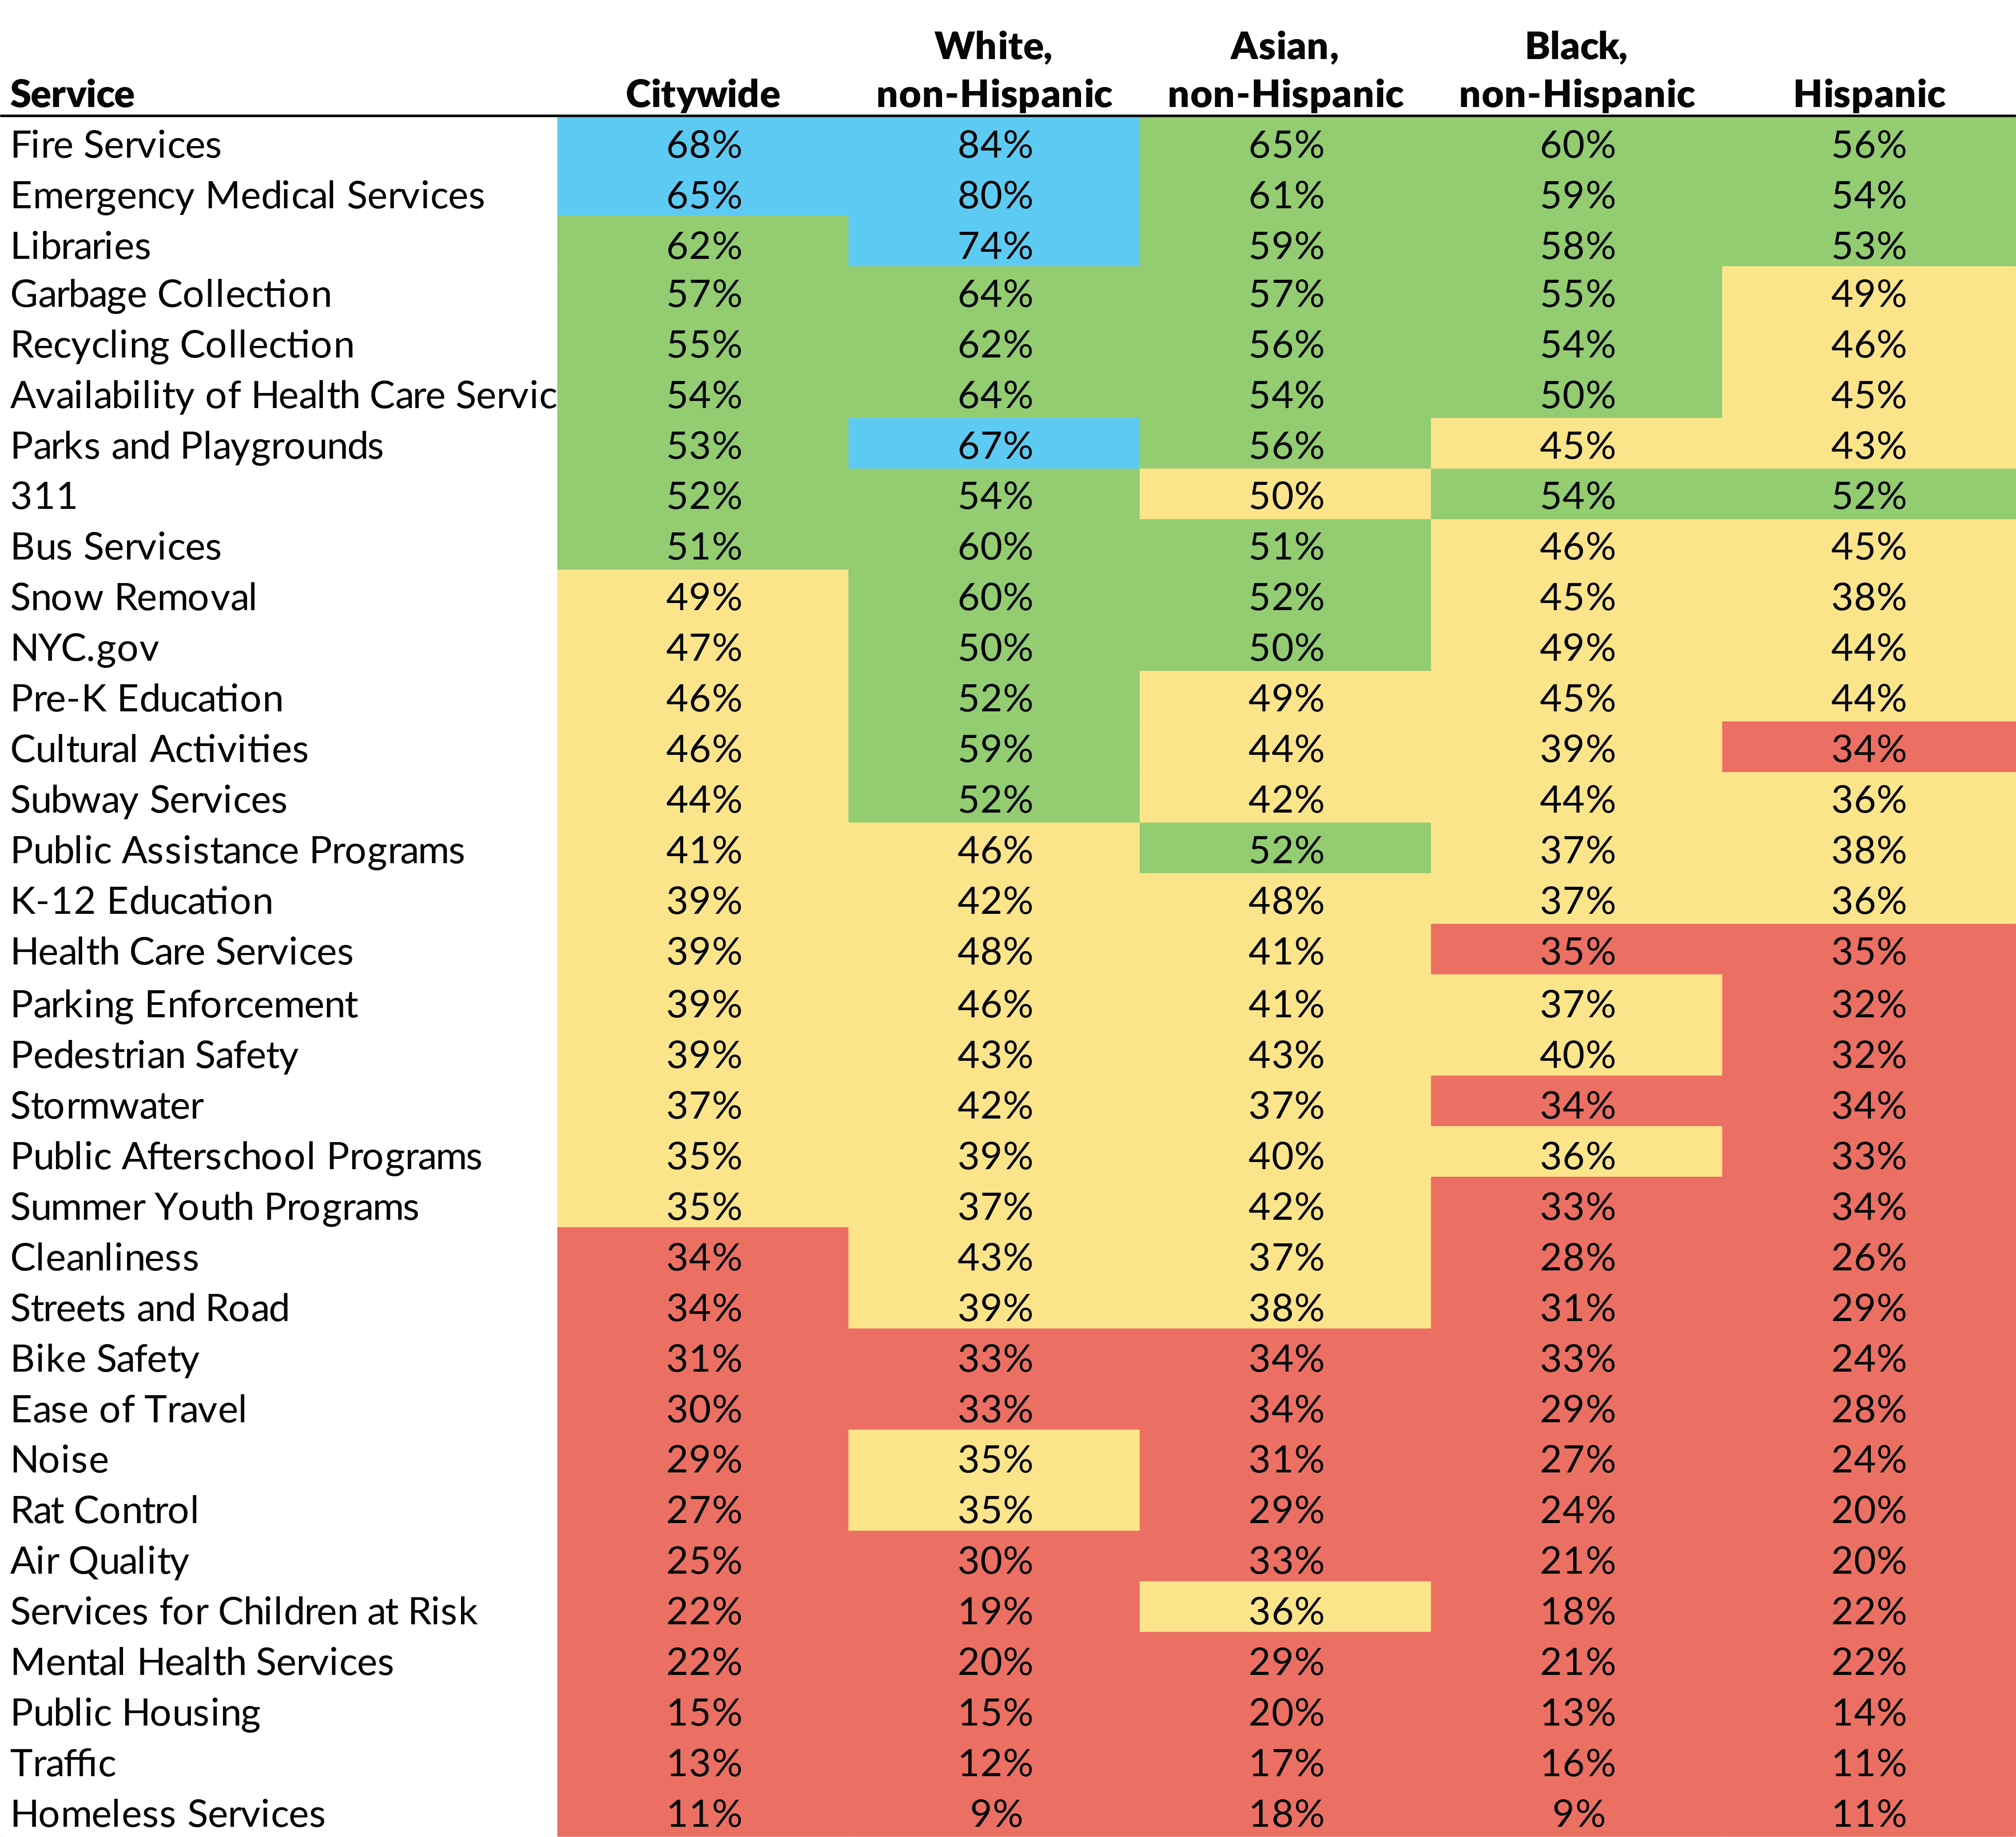
Race/ethnicity is a combination of two survey questions. Any respondent selecting Hispanic or Latino/a is coded as Hispanic. Among those who are non-Hispanic, if a respondent only selects White, Black or Asian/Pacific Islander, he/she is coded as White, non-Hispanic; Black, non-Hispanic; or Asian, non-Hispanic; respectively. Any respondent selecting American Indian, Eskimo, or Aleut; or two-plus races was coded as Other.
CBC Analysis of CBC NYC Resident Feedback Survey, 2023.
Footnotes
- Public safety in your neighborhood question was phrased as crime control in your neighborhood in 2017.
- The response rate was 5.3 percent, lower than the 13.8 percent response rate to the 2017 survey. However, this decrease is reflective of challenges with response rates for mailed surveys and not unique to the NYC Resident Survey. For example, see: Steven Shepard, “Pew: Phone polling in crisis again,” Politico (February 27, 2019), https://www.politico.com/story/2019/02/27/phone-polling-crisis-1191637.
- There were modest differences in the sequence and number of contacts for each administration. In all three surveys, paper surveys were mailed to homes, but the survey could be completed on line or via hard copy. In 2008 and 2017, the surveys guaranteed confidentiality, while the 2023 survey dropped the use of a respondent code and provided full anonymity. There were also some changes in the questions; for a description see: Citizens Budget Commission, 2023 NYC Resident Feedback Survey Report of Results (prepared by Polco, March 19, 2024), LINK.
- The 2008 survey went into the field in June 2008. The recession started December 2007 for the U.S. and April 2008 for NYS. The 2017 survey went into the field in January 2017, following a recovery that started July 2009 for the U.S. and in December 2009 for NYS. Lastly, the 2023 survey was in the field starting in September 2023, roughly three-and-a half years after the start of the COVID pandemic, in March 2020 and the end of the NYS recession in May 2020.
- Public safety in your neighborhood question was phrased as crime control in your neighborhood in 2017.