What Ails Medicaid in New York?
And Does the Medicaid Redesign Team Have a Cure?
Medicaid, the joint federal-state program to finance medical care for low-income people, is important to New Yorkers. It provides access to medical care for 6.3 million residents or nearly one-third of the population; it comprises about one-third of the expenditures of the state’s health care sector, which employs about 1.2 million people; and it is funded by more than $60 billion of taxpayer money per year, half from state and local governments.1
The program has been criticized as unnecessarily costly and as providing low quality care. Not surprisingly it has been the target of recurring efforts at reform. The most recent such initiative, a stakeholder task force titled the Medicaid Redesign Team (MRT), was launched in 2011 and in 2012 presented longer-term strategies for redesign; staff of the New York State Department of Health (NYSDOH) have pursued those strategies and continue to develop and implement promising changes.
This report describes and assesses the strategies of the MRT and the progress of Health Department staff in implementing and refining them. It begins with a description of the Medicaid program and its problems at the time the MRT was established. The second section explains the strategies developed to address these problems. The third section evaluates the progress to date from cost containment efforts, and the final section assesses the potential for future savings from the policy directions being pursued and the possible obstacles to achieving those gains.
The major findings are:
- The goals of the MRT are consistent with what federal officials call the “triple aim” of expanded access to care, higher quality care, and lower costs. The strategies for pursuing these goals are expansion of managed care in terms of scope of services and range of population covered, development of new delivery mechanisms including Health Homes and Performing Provider Systems (PPSs), and shifting from fee-for-service to value-based payments for provider services.
- The federal Affordable Care Act of 2010 and state initiatives to implement it significantly expanded access to care by changing Medicaid enrollment processes and making New York eligible for additional federal matching funds. The enrolled population increased one-third between 2010 and 2015 from 4.7 million to 6.3 million. In future years enrollment is expected to stabilize.
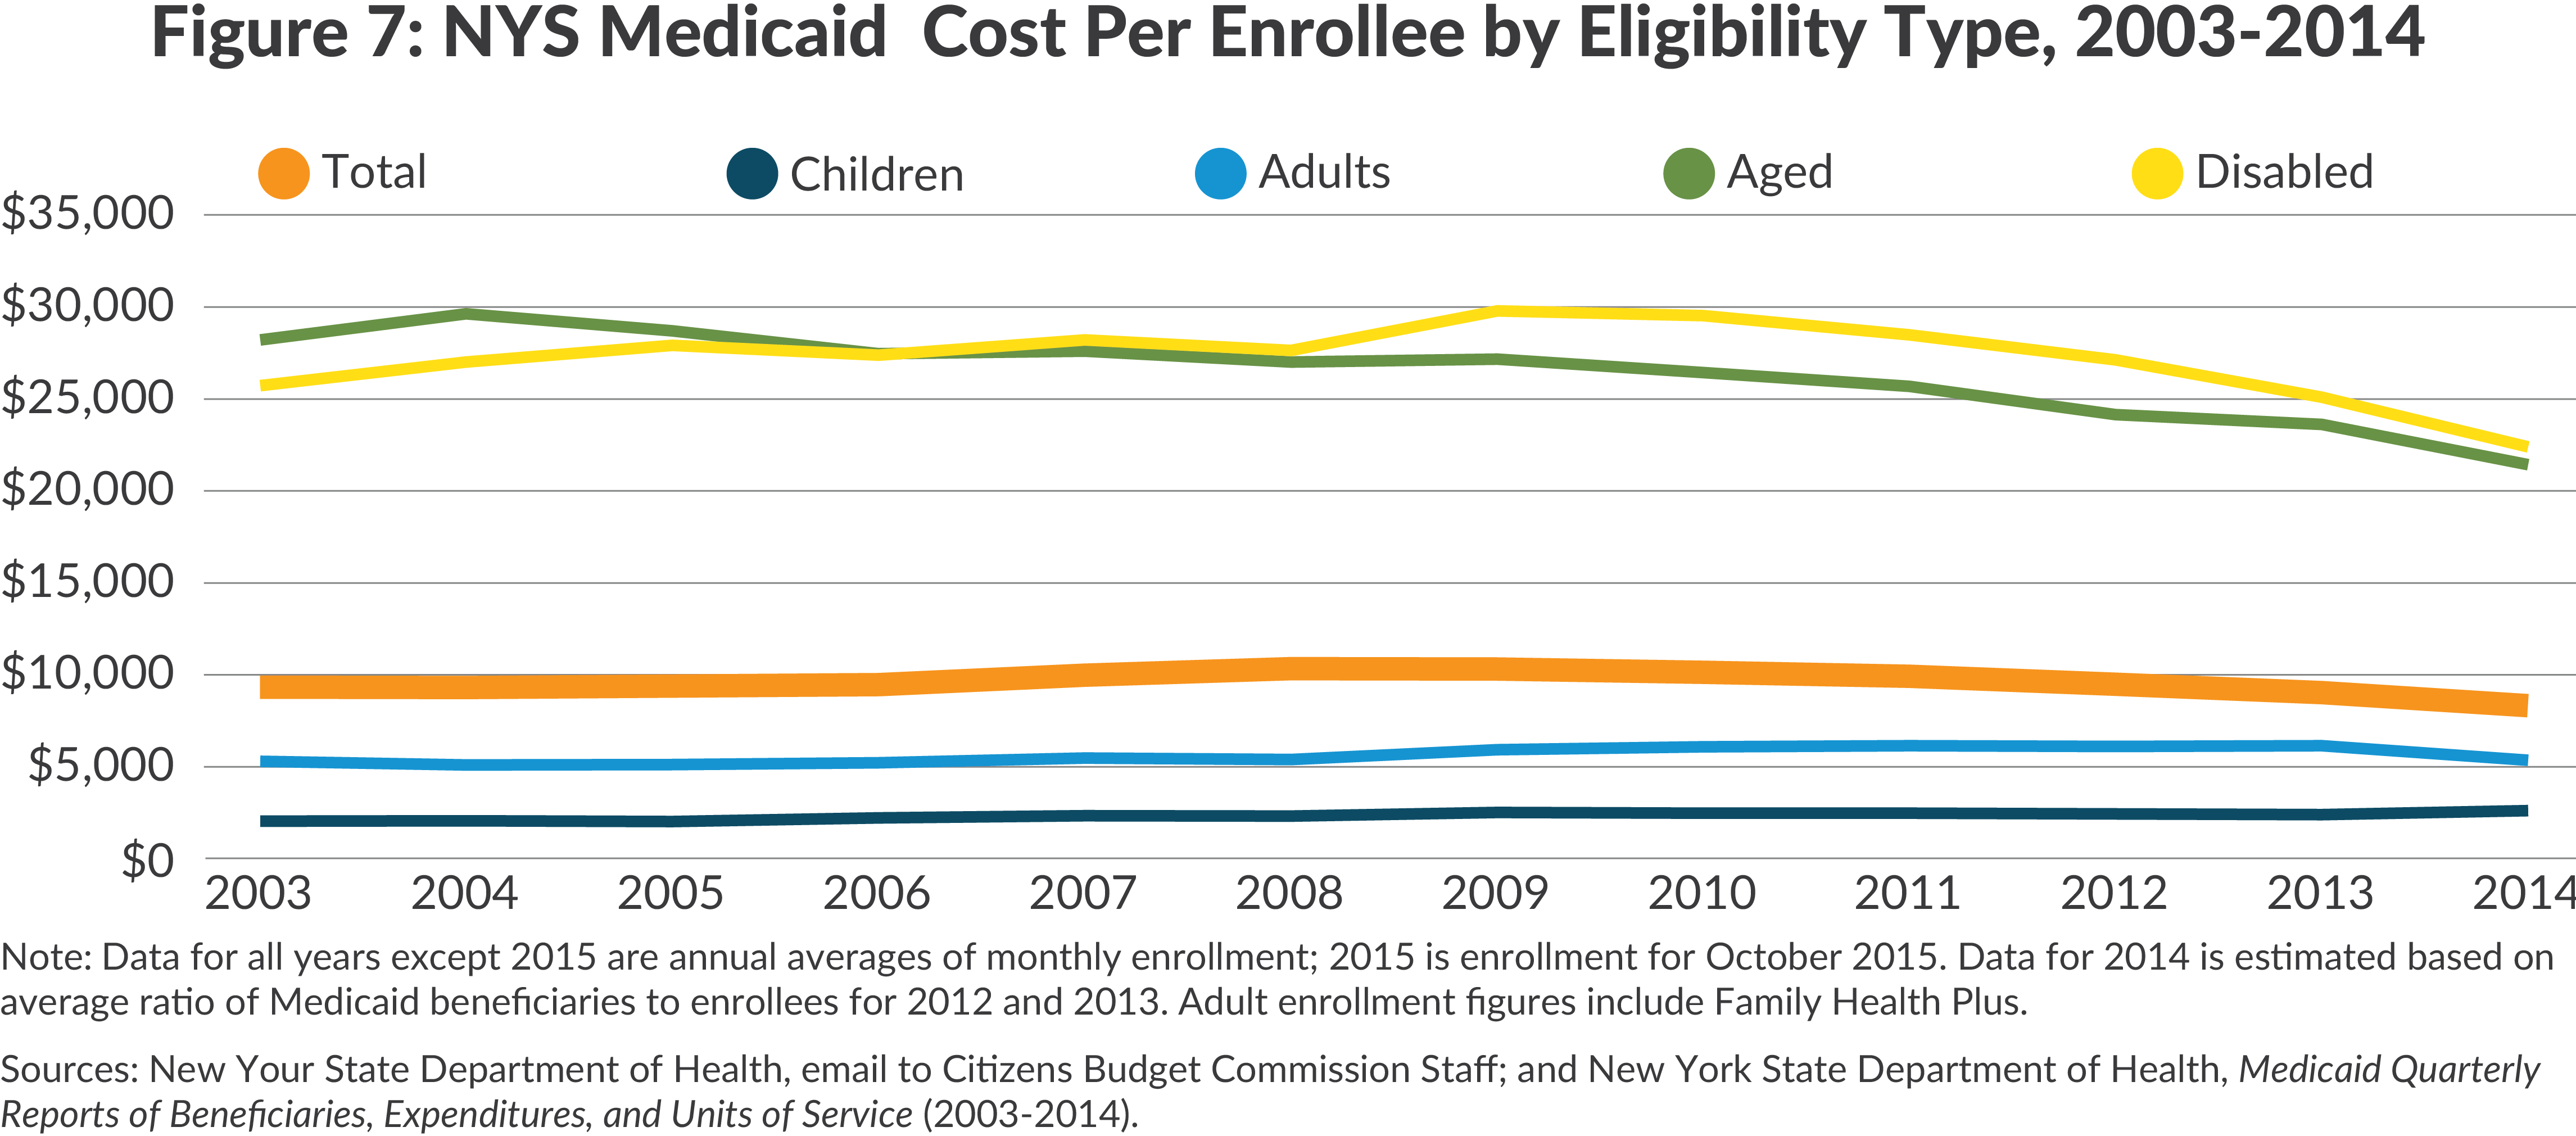
- Implementation of the MRT strategies helped contain growth in program costs. Since 2011 annual statutory target expenditure growth rates linked to trends in medical care inflation for a portion of the program ranging between 3.2 percent and 4.6 percent have been achieved. In addition average cost per enrollee between 2010 and 2014 declined 17 percent from $10,432 to $8,620 including declines in the more expensive categories of enrollees, the aged and disabled, as well for other adults.
- Continued implementation and refinement of the strategies is expected to yield additional substantial recurring savings. The annual savings target for state fiscal year 2020 is between $1.3 billion and $1.9 billion or about 2 to 3 percent of the estimated baseline. Achieving this target requires one-time investments in current and coming years of nearly $8.0 billion in federal funds and about $2.2 billion in non-Medicaid State funds. If the strategies are successfully implemented, the substantial recurring annual savings will be a good return on the investment. Moreover, improvements in quality of care would accompany the future savings.
- Realizing these benefits requires successful implementation of the strategies in coming years. However, full implementation will confront major challenges.
- The goal of enrolling nearly all Medicaid eligible individuals in managed care plans is hampered by the non-mandatory nature of the initiative for many people with extensive service needs including the dually eligible (Medicaid and Medicare) population and those with developmental disabilities. In addition those with developmental disabilities require new models of managed care that are still in development.
- The use of Health Homes to coordinate the care of those with multiple conditions is similarly hampered by the voluntary nature of the program and by the need to improve outreach and enrollment practices and to provide clear guidelines and standards for coordination of care by the organizations.
- The development of PPSs is likely to be slowed by a need for coordination among multiple autonomous entities and the absence of preset policies for distributing funds from the lead agencies to other participating providers.
- The design and implementation of the value-based payment strategy faces complex technical issues in identifying appropriate measures, and requires difficult policy choices about how to structure the at-risk portion of payments.
In sum, current Medicaid reform policies are headed in the right direction and have already achieved notable quality improvements and savings. Significant additional gains are possible, but will require several years and continued refinement in the strategies to realize their full potential.
What Was Wrong with Medicaid?
For many years New York State’s Medicaid program suffered from three persistent problems: it was expensive; its cost increased rapidly consuming a large portion of new revenues; and despite the high costs, it provided medical care of only mediocre quality.
Expensive
In federal fiscal year 2011, which began in October 2010 just before New York elected its current governor, the State Medicaid program spent a total of $53.8 billion. While New York’s total spending was below California’s $54.9 billion, adjusting for population size shows New York’s program to be the most expensive in the nation, $2,768 per resident, well above California’s $1,457 per resident and more than double the national average.2
The high cost in New York was caused by three factors: a high cost per person enrolled; generous eligibility rules leading to a large share of the population enrolled in Medicaid; and extensive use of Medicaid to subsidize hospital care to non-Medicaid enrolled residents through the Disproportionate Share Hospital (DSH) option in the program.3
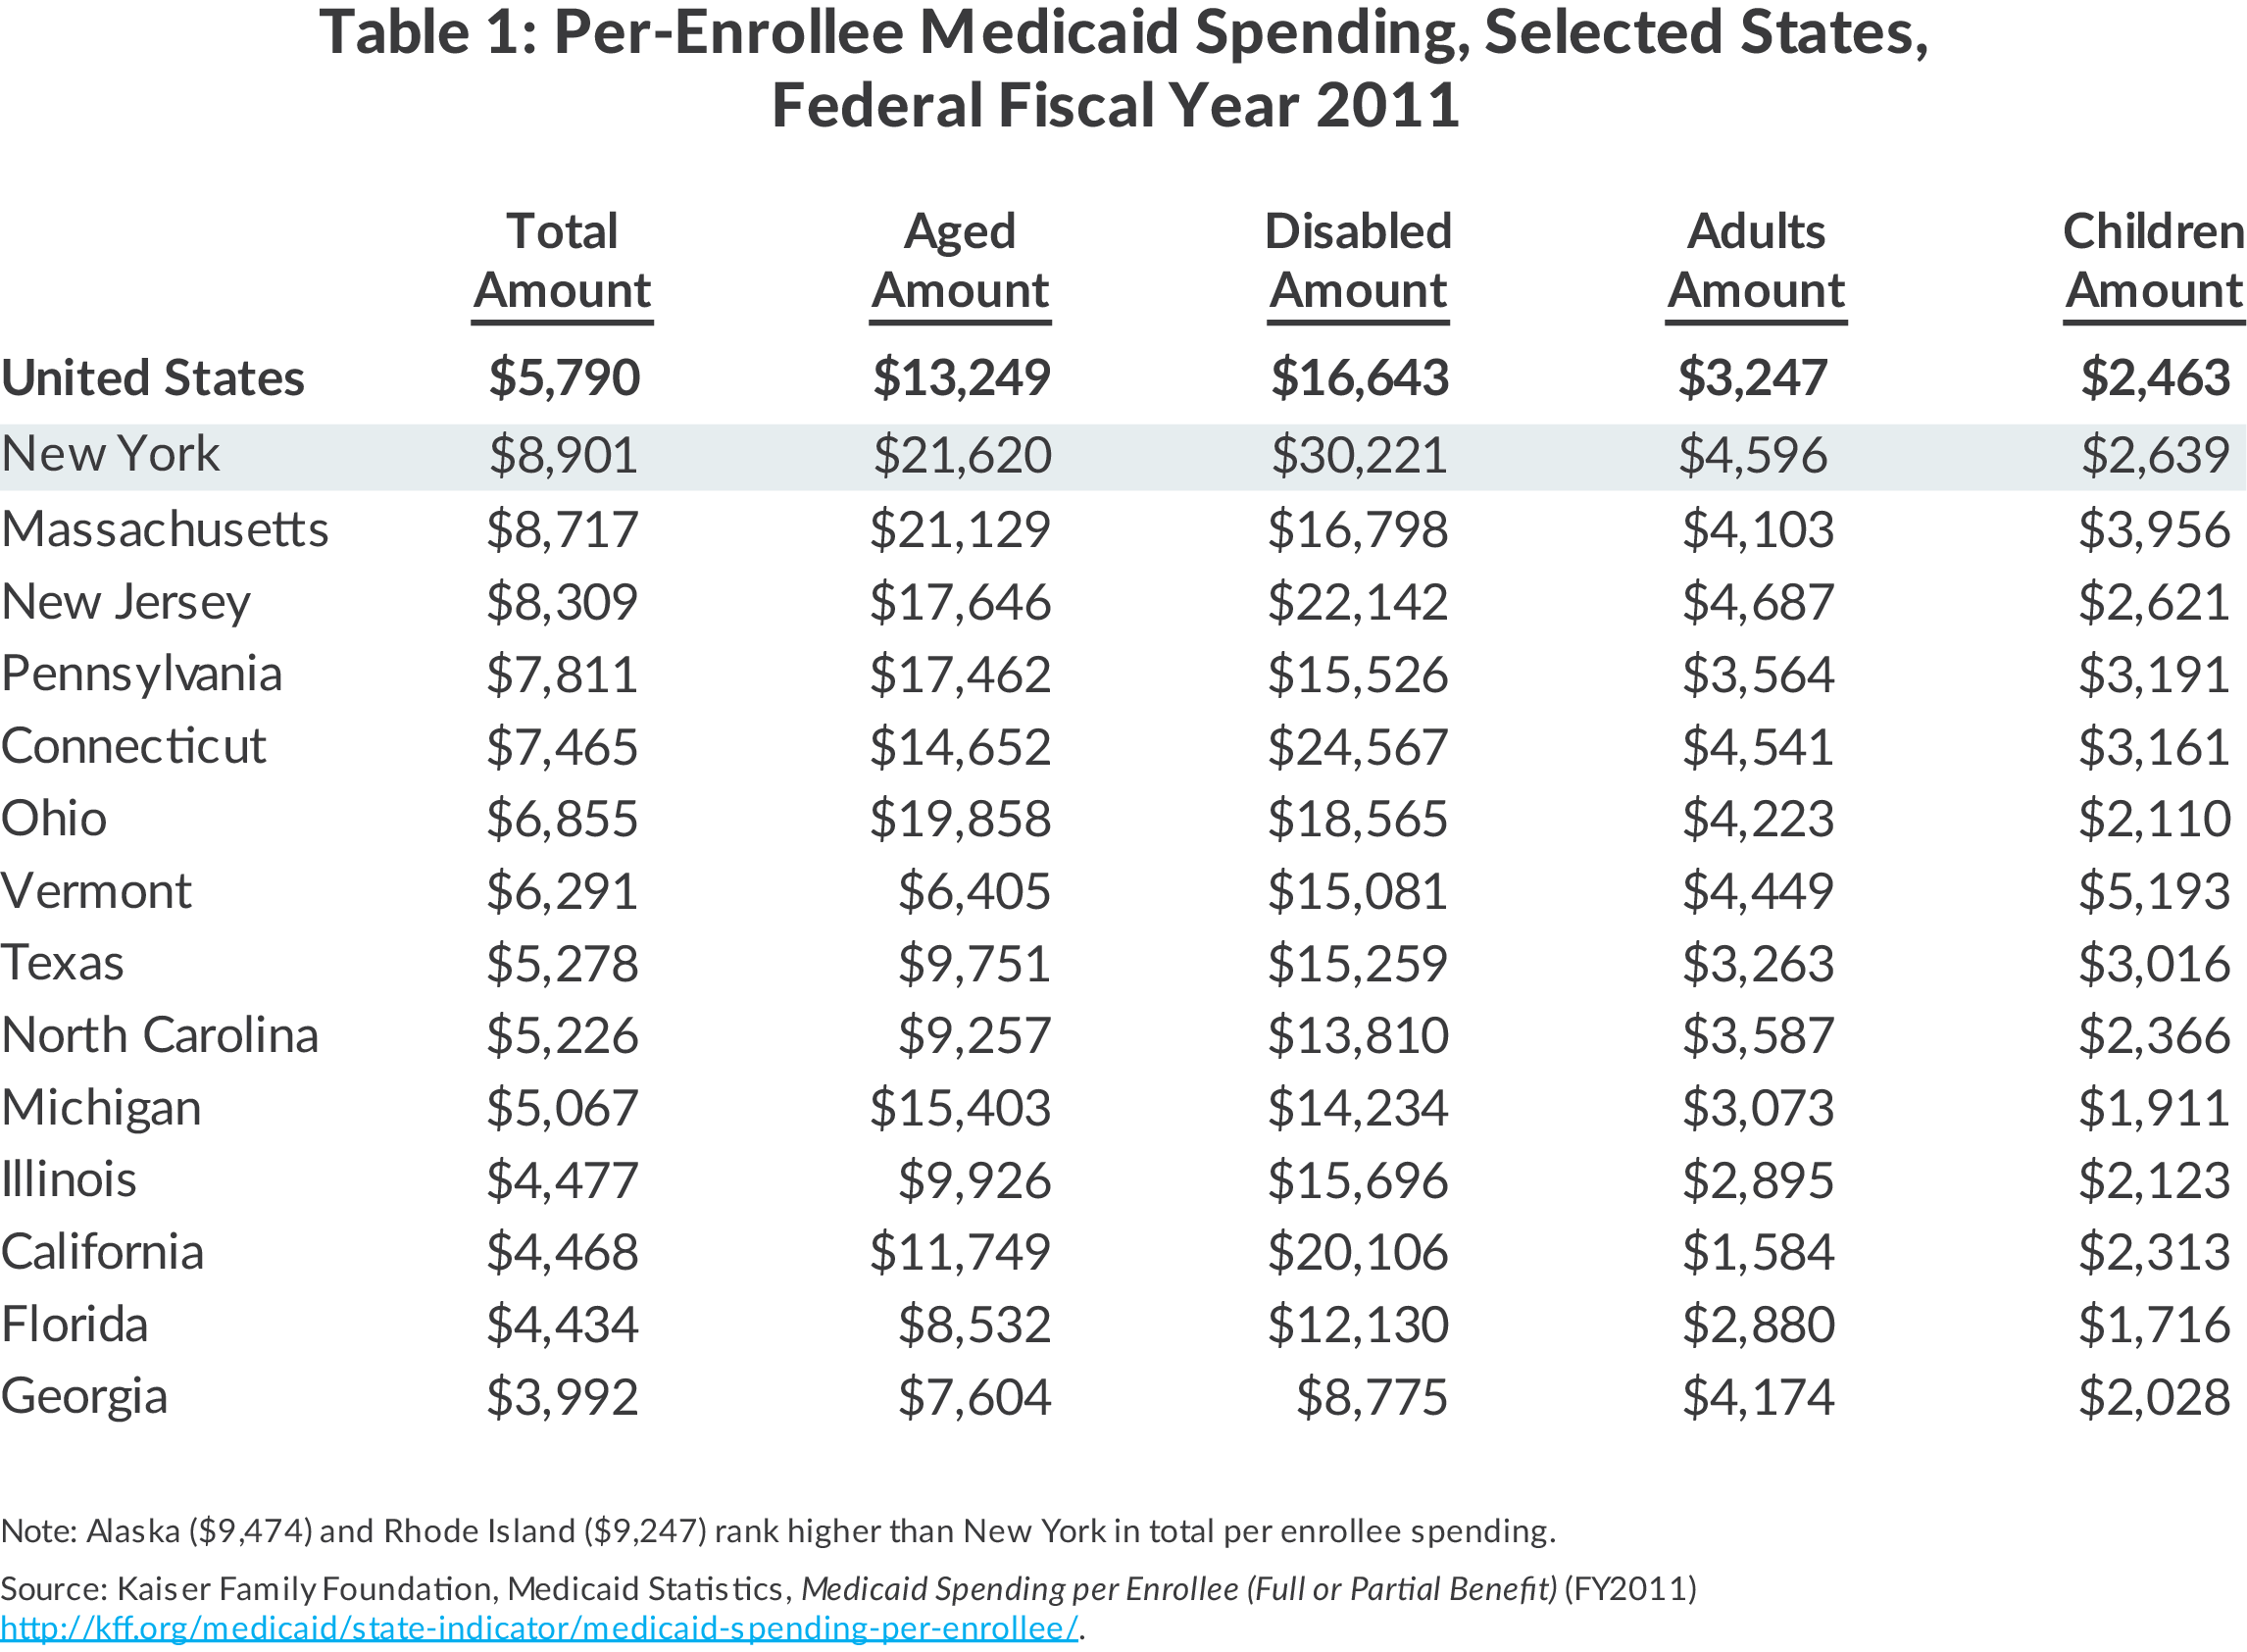
New York’s cost per enrollee was far in excess of that in most other states. Figure 1 shows per enrollee costs in federal fiscal year 2011 for New York and the United States and New York’s rank among the 50 states.4 Spending per New York enrollee averaged $8,901, about 54 percent above the national average and higher than in every state except Alaska and Rhode Island.
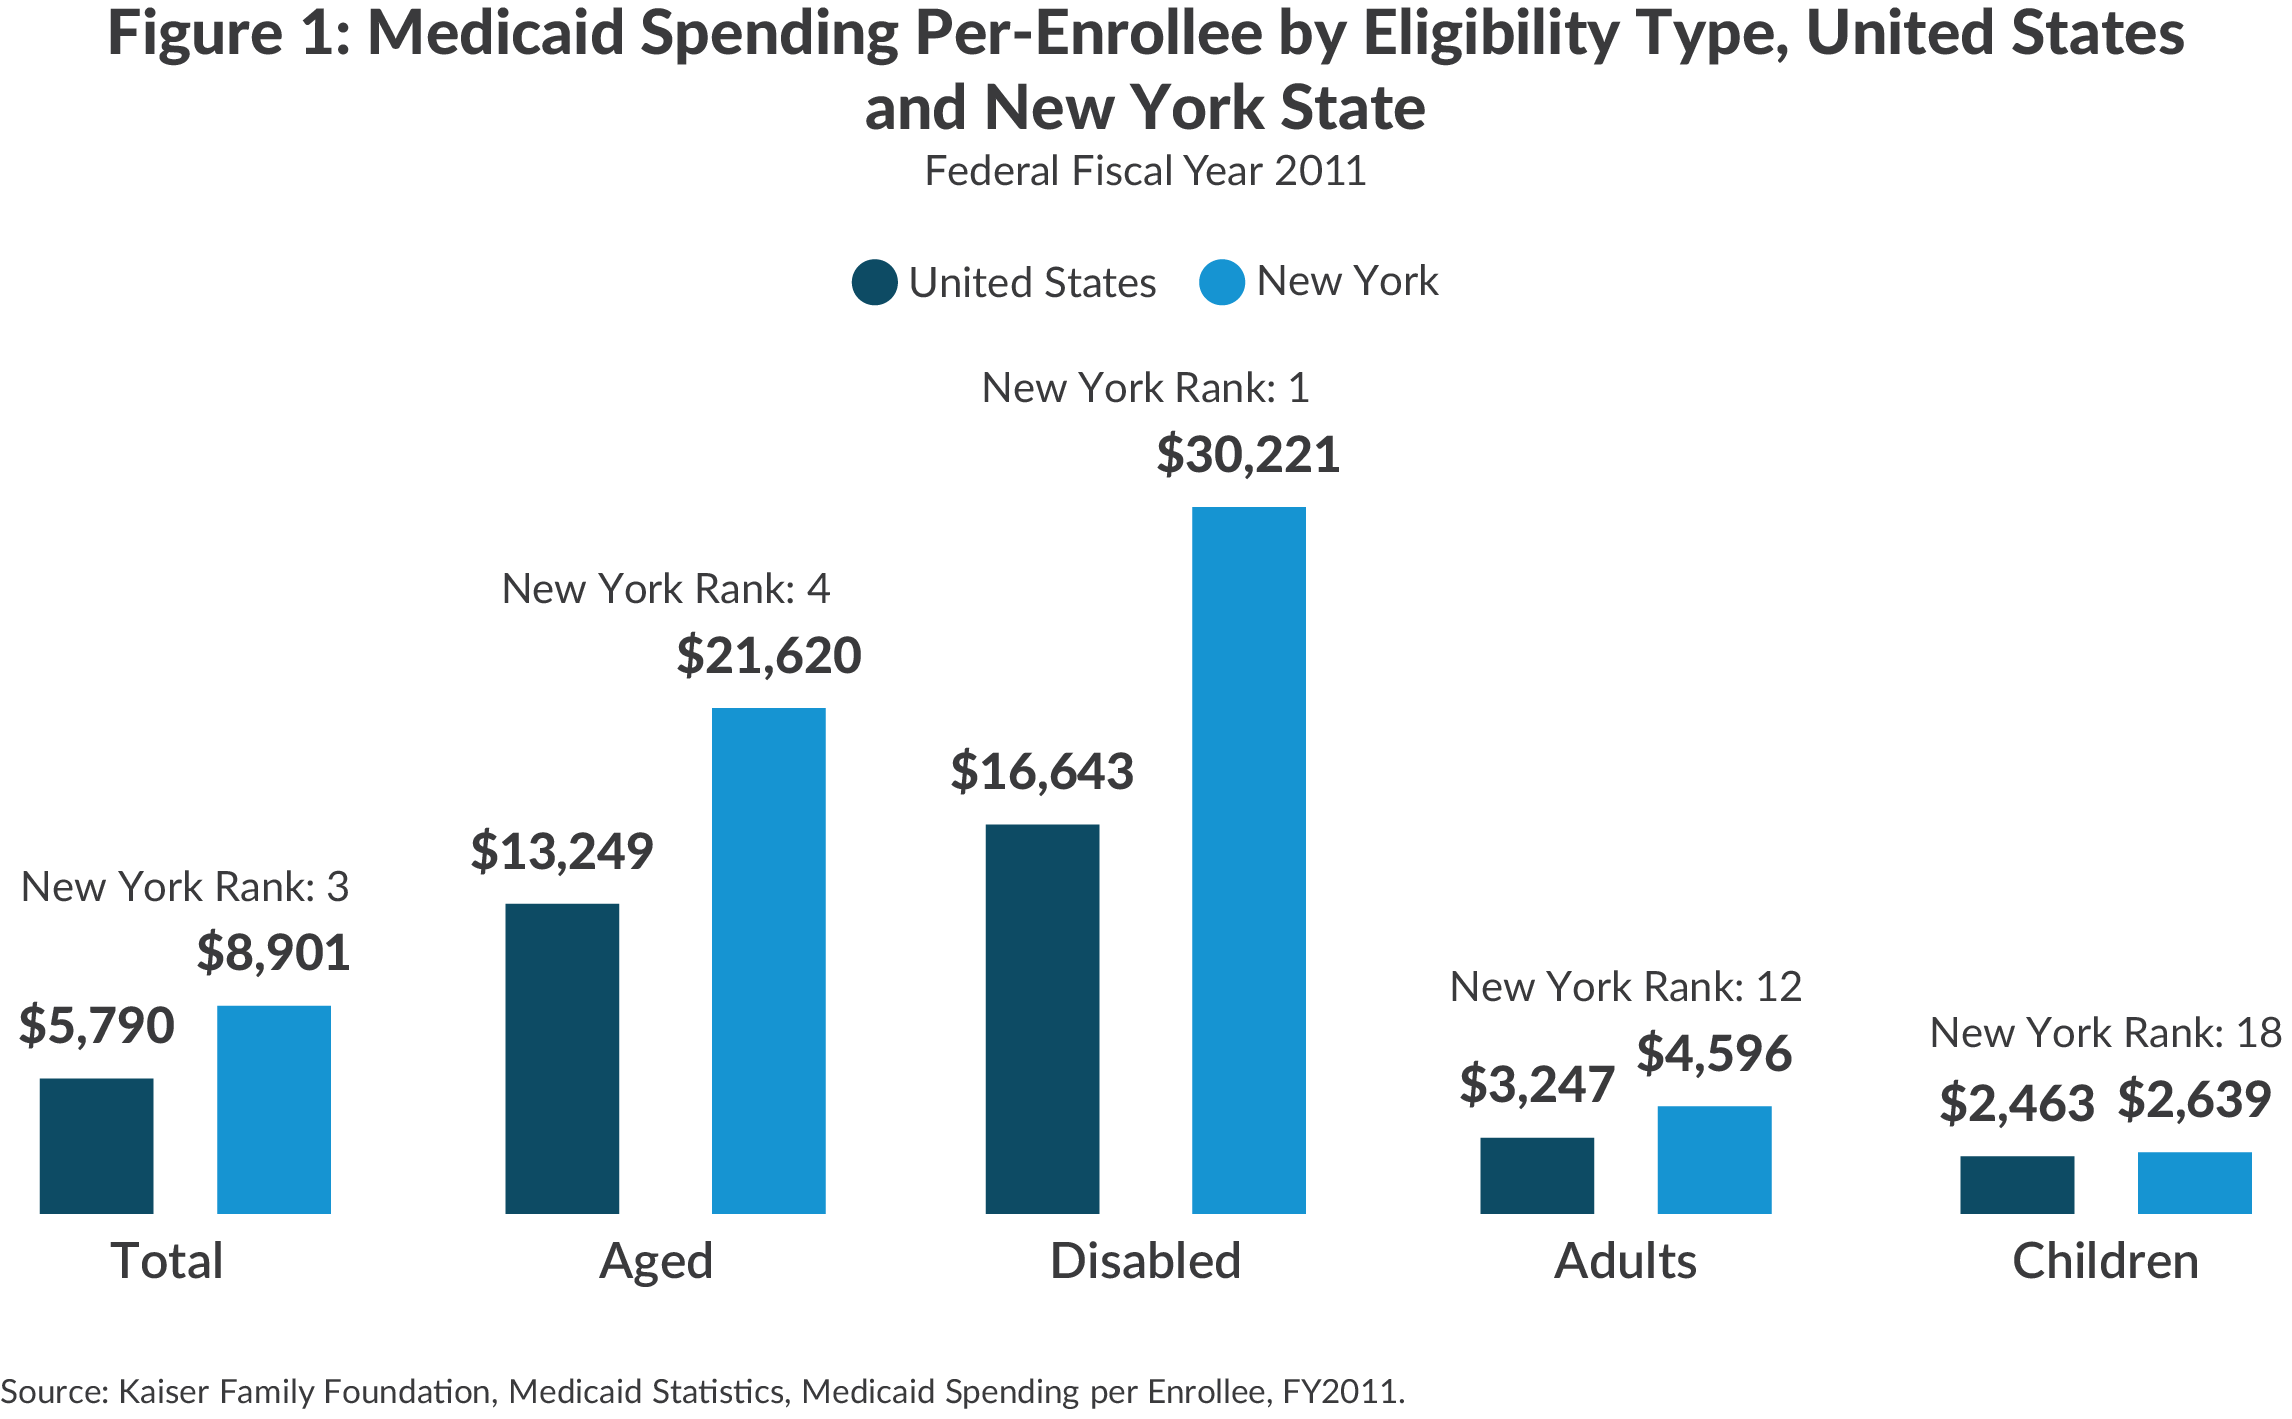
The higher per enrollee spending was most pronounced among the aged and disabled. New York’s cost per disabled enrollee of $30,221 annually was highest among all states and 182 percent of the national average; the equivalent figures for the elderly were $21,620 and 163 percent of the national average. Among other adults and children the per-enrollee costs were also above the national average but not as exceptionally high.
Before passage in 2010 of the federal Affordable Care Act (ACA), which enhanced national standards for Medicaid eligibility, federal law permitted wide variability among the states. In New York one of every four residents was enrolled in Medicaid, the highest proportion in the nation.5
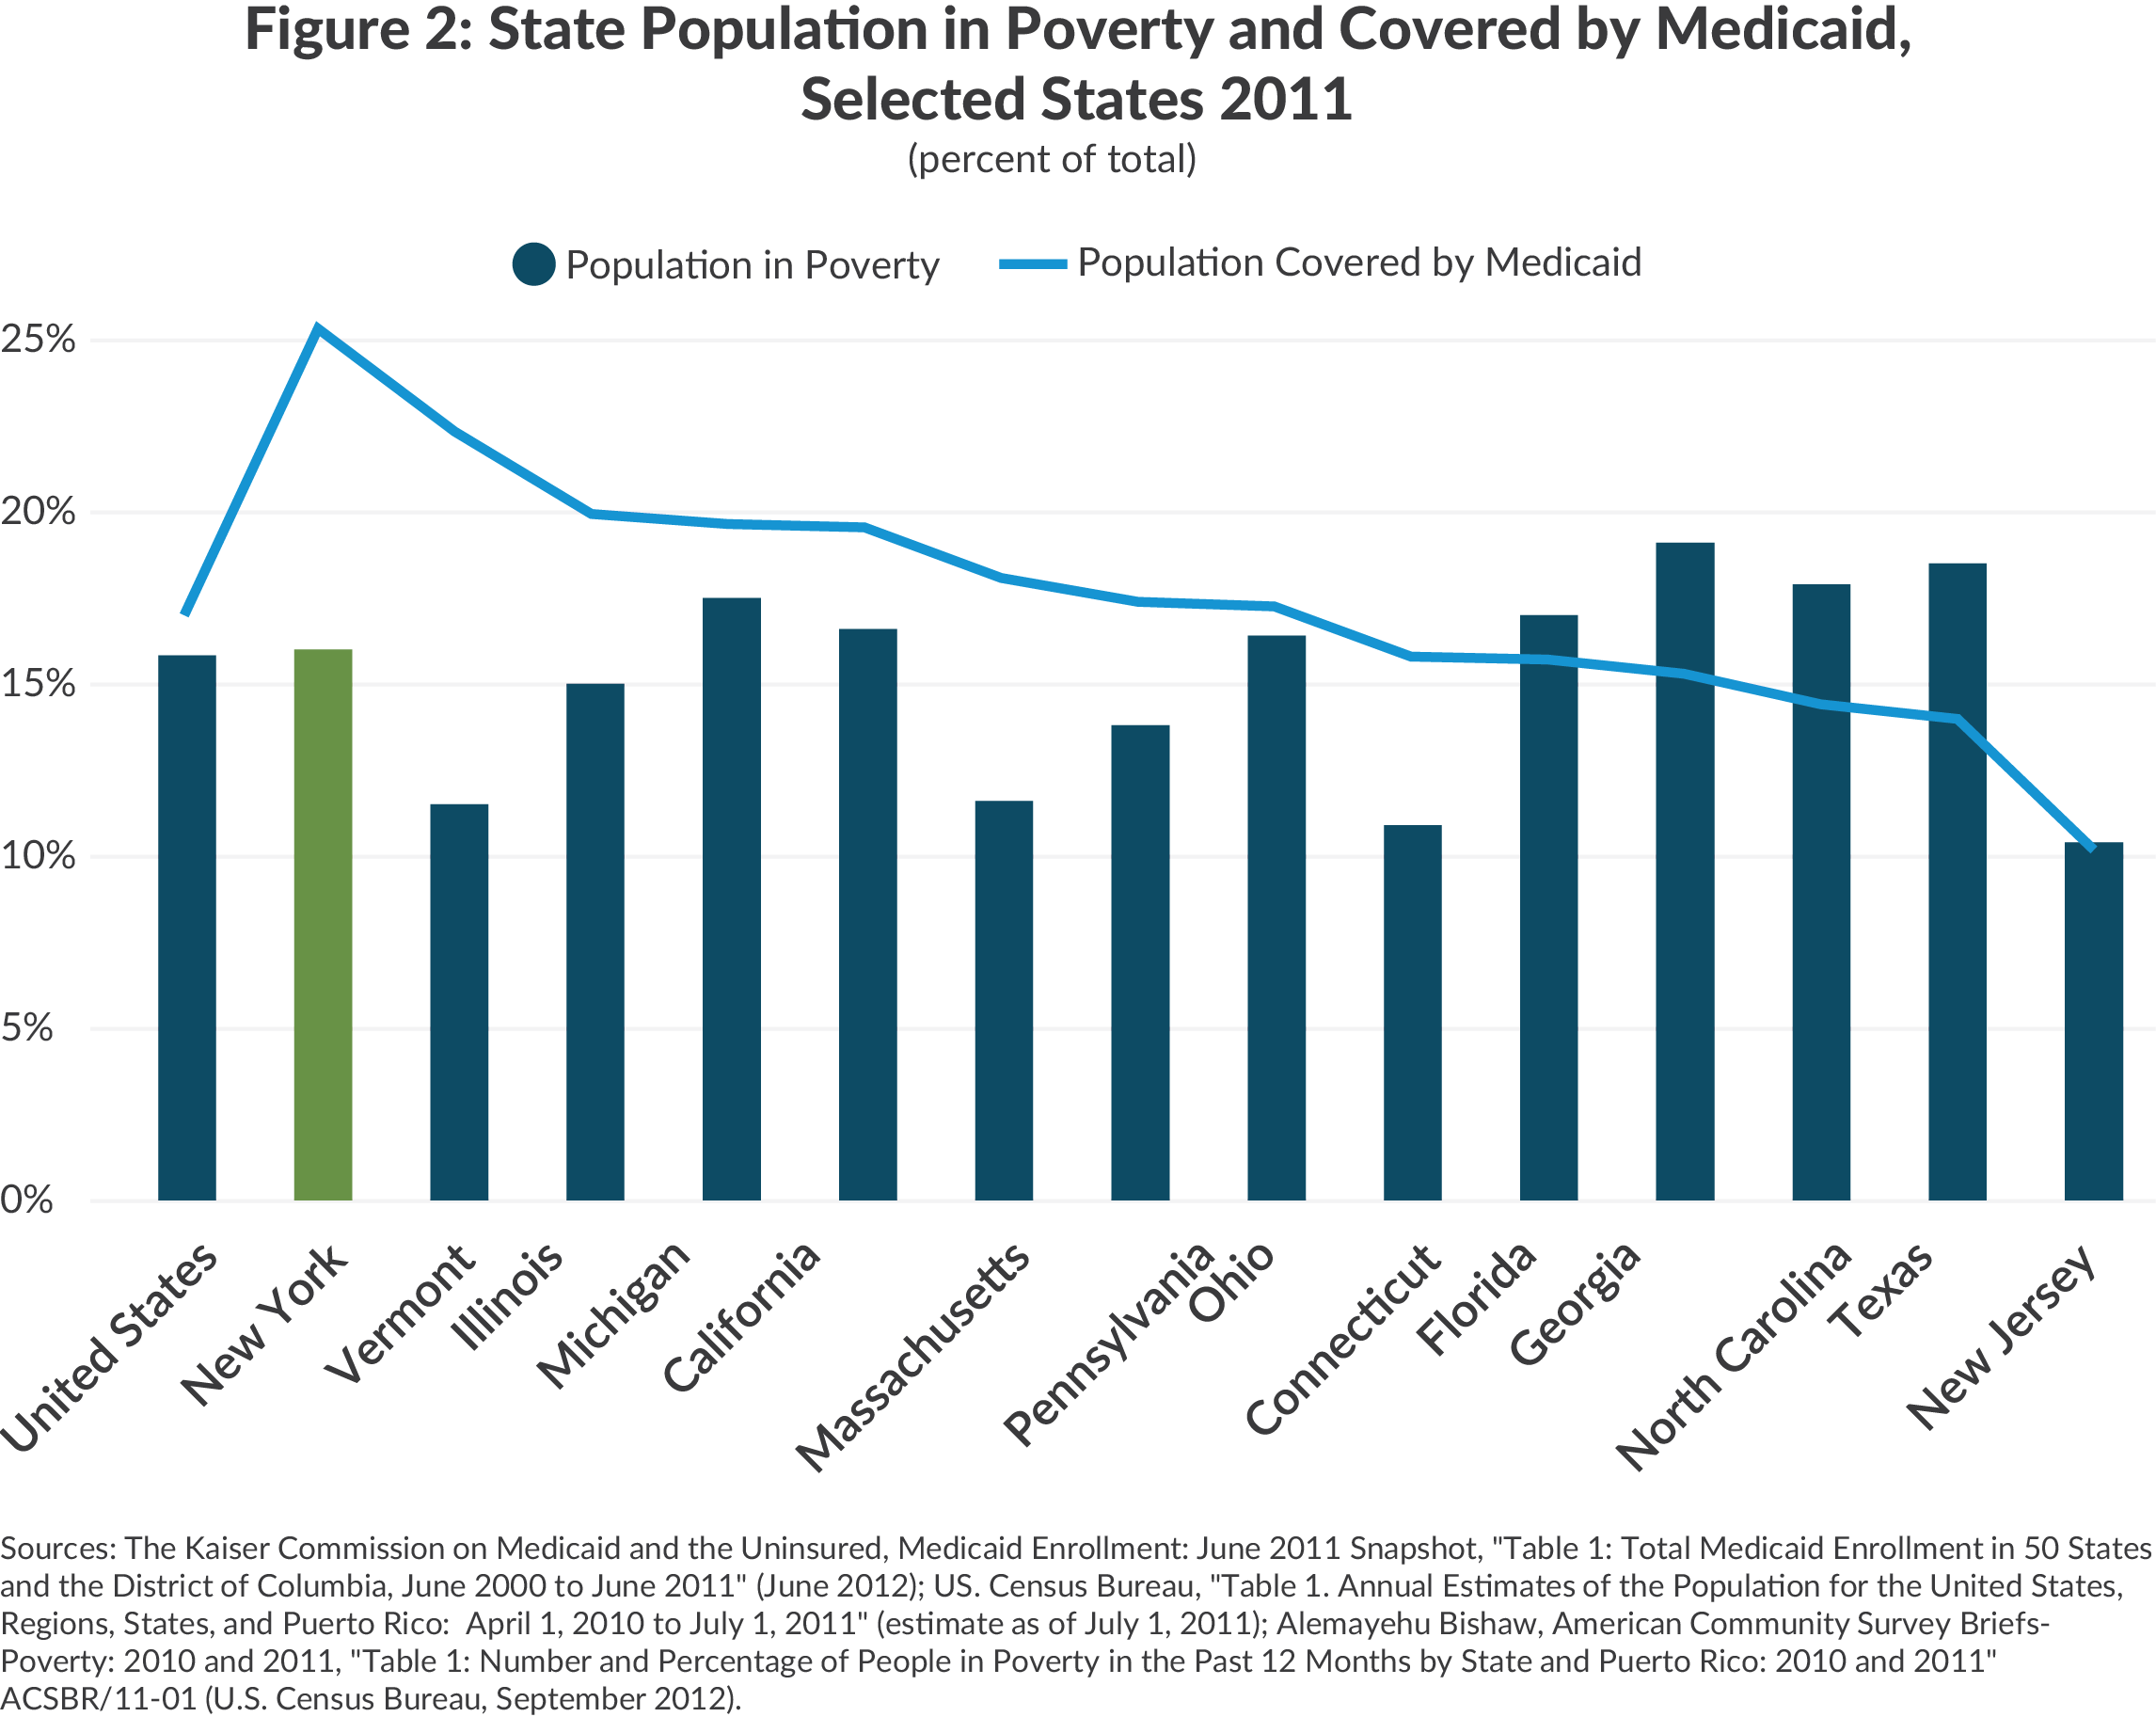
The share of New Yorkers with incomes below the federal poverty level was equal to that in the nation, about 16 percent, but New York was enrolling many more people with incomes above that level. This was widely regarded as a positive feature of the program, giving access to medical care to many near-poor families who otherwise might not receive it and to many elderly individuals who might otherwise become financial burdens on their adult children.
The third factor in New York’s large Medicaid expense was its extensive DSH program. This component of Medicaid does not pay for services provided to specific enrollees; rather, it makes payments to hospitals to offset the cost of providing care to needy persons who do not qualify for Medicaid but cannot afford their medical bills. Often these people are undocumented or insured people with modest incomes who encounter an accident or serious illness that requires expensive hospital care not covered by insurance. In federal fiscal year 2011 New York awarded about $3.2 billion in DSH payments, more than any other state and well above second ranking California’s $2.3 billion.6
Costs Increasing Rapidly
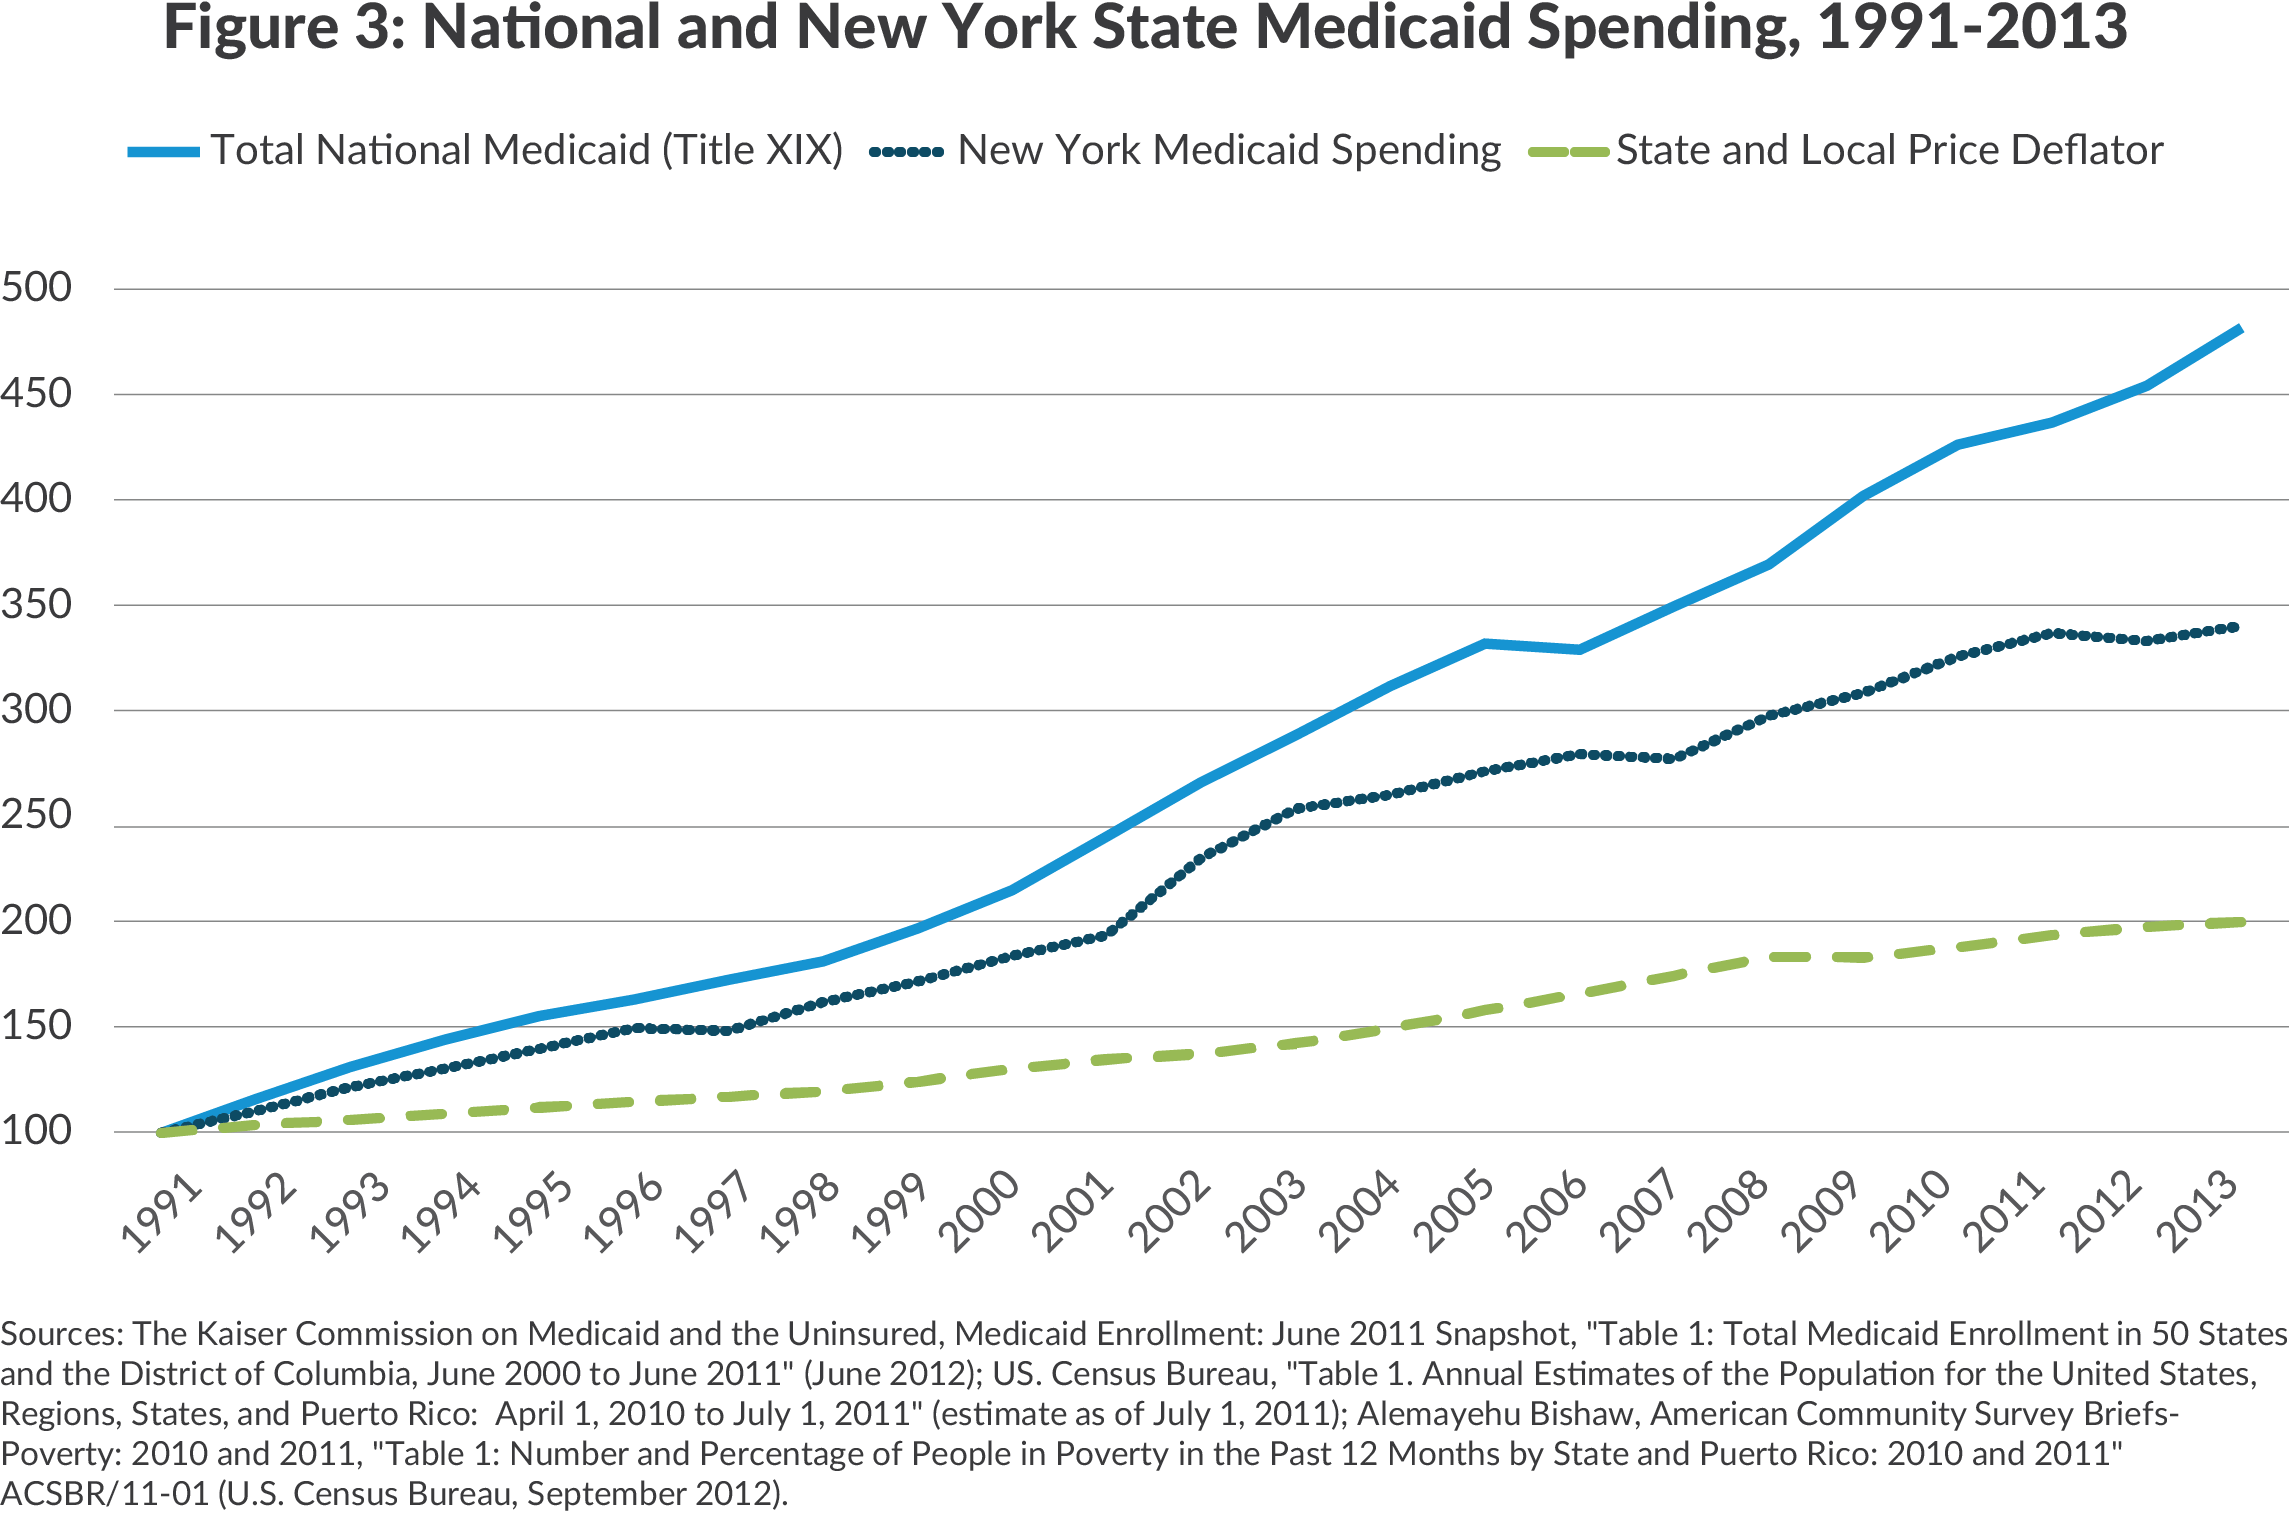
Medicaid costs were not only high, they grew rapidly. As shown in Figure 3, for more than two decades Medicaid spending in New York and nationwide rose at a pace well above the general cost indicator for state and local governments; the near doubling of the price index between 1991 and 2011 was more than matched by the greater than quadrupling of national Medicaid costs and an approximately 350 percent increase in New York’s Medicaid expenses.7 (The more rapid growth in other states likely reflected their expansion of eligibility, which New York had already implemented.) The consequence of this exceptionally rapid growth was pressure on other areas of state budgets such as public education and a constrained ability to devote new resources to other functions.
Mediocre Quality
New York’s high costs were not buying high quality care. A 2009 comparative analysis of state health systems by the Commonwealth Fund found New York ranked 21st of the 50 states overall, 22nd for prevention and treatment and last in avoidable hospital use. The rankings were somewhat better for access, 18th, and equity, 11th, but even these middling scores were not aligned with high costs.8 New York’s Medicaid managed care plans also ranked at or below the middle among the states in ratings for patient satisfaction and other quality indicators.9
The Evolving Strategies
One of Governor Andrew Cuomo’s early actions after taking office in January 2011 was to appoint the MRT to design strategies to restrain Medicaid spending and improve the quality of the program’s services. The MRT is composed of 27 members from health care stakeholder groups and headed by Jason Helgerson, the Governor’s appointee as Deputy Health Commissioner and Medicaid Director. The MRT was active in 2011 and 2012 developing measures for savings in the annual budget cycle. It started with 79 recommendations in its first year and had proposed more than 300 specific initiatives by 2015.10 The MRT’s success in implementing the vast majority of its initiatives is linked to legislation establishing an annual cap, linked to the historical rate of medical care inflation, on the rate of growth in most types of Medicaid spending. If spending growth appears to exceed the cap in a given year, the Health Commissioner is empowered to take actions to lower spending, including reducing provider payment rates; however, the Commissioner has not found it necessary to invoke this power since the MRT was created.
In 2012 the MRT issued a report described as a multiyear action plan that presents longer-term strategies for redesign.11 Subsequently the MRT has been less active as a decision-making body; implementation and refinement of its plans relies on NYSDOH staff with working groups of the MRT providing guidance. The MRT plan incorporates three broad strategies: greater reliance on managed care, development of new service delivery mechanisms, and use of value-based payments. These strategies have evolved over the MRT’s five-year life and are still being refined. Implementation of certain parts of the plan required approval of waivers to federal Medicaid rules, and negotiations with the federal Centers for Medicare & Medicaid Services (CMS) over the next two years led to changes in the plan. Further experience in implementing the plan has informed additional changes and refinements.
Greater Reliance on Managed Care
In New York and nationwide reliance on managed care organizations (MCOs) by a state Medicaid program often has been viewed as a positive measure yielding better care and lower costs. The better care results from the MCOs coordinating care on behalf of enrollees, imposing high standards of care on the providers with whom they contract, and avoiding unnecessary care. The lower cost results from the MCOs’ financial incentive to avoid excess use of services and to bargain for low payment rates to providers while maintaining an adequate network of providers.
Despite the potential benefits of MCOs, Medicaid eligible people generally do not join them voluntarily. Few are willing to trade the possible benefits of an MCO for ability to select and use providers without restrictions set by an MCO. Consequently managed care has been able to achieve large scale Medicaid enrollment only in states that mandate a choice of plans; voluntary participation yields relatively low enrollment.
New York State began a program of mandatory managed care for certain Medicaid enrollees in 1988 and expanded it in 1991 and 1997 to include many of the non-elderly and non-disabled enrollees.12 In 2005 the mandate was extended to many elderly and disabled not enrolled in the Medicare program and receiving cash benefits under the Supplemental Security Income program. By 2010 about two-thirds of all Medicaid eligible people were enrolled in an MCO.13
The vast majority of managed care clients were enrolled in MCOs known as “mainstream” plans. They provided a range of acute care services including physician and hospital services but excluded most long-term care (nursing home and home health and personal care) as well as prescription drugs, some dental care, and treatment of behavioral health problems. The excluded services were paid for directly by the State on a fee-for-service basis.
The other managed care options were a few relatively small MCOs specializing in long-term care services. In 2010 about 40,000 Medicaid eligible people were enrolled in these plans.14 Enrollment was voluntary, and most plans covered only long-term care services with the acute care services their members required paid for directly by the State on a fee-for-service basis. A few plans offered combined acute care and long-term care services with Medicaid and Medicare jointly paying the capitation rates for people eligible for both programs.15
The MRT proposed to expand reliance on managed care by broadening the range of services provided by mainstream MCOs and by increasing the types of people participating in managed care to include more aged and disabled and those with special health care needs.
In 2011 the MRT added prescription drugs, personal care, and some home health care to the mainstream MCO benefit package. In 2012 most dental services were added, and in 2013, hospice care. In 2015 nursing home care was added. A range of mental health services including treatment for substance abuse is being added on a phased-in basis beginning with benefits for adult enrollees in New York City in the last quarter of 2015, then for adult enrollees in the rest of the state in mid-2016, and for child enrollees statewide in 2017. As services have been added, the increment to the MCO capitation rate has been somewhat less than the average per person cost under fee-for-service arrangements based on the assumption that MCOs would do a more effective job of managing utilization.
Beginning in 2011 the mandate for mainstream managed care was extended to many previously exempt, then was applied to most HIV positive individuals. In 2012 homeless individuals, low birth weight infants, and those with end-stage renal disease were included. In 2013 some foster care children were included.16
Adults receiving home or community-based long-term care services for an extended period were required to enroll in a long-term care MCO on a phased-in basis based on location during 2012 and 2013; the enrollment could be with an MCO specializing in long-term care and receiving a “partial capitation” for those services, or with one of a few plans that covered long-term care and other acute care services. In 2015 adults entering a nursing home were required to enroll in a long-term care MCO, and the mandate will be applied to children entering a nursing home in 2017. Persons residing in a nursing home prior to 2015 are not subject to the mandate, but can voluntarily enroll in a managed care plan.
In 2013 CMS authorized a program to provide comprehensive (that is acute and long-term care) services to people eligible for Medicare and Medicaid (“dual eligibles”) and requiring long-term care services. The entities to provide this integrated care, Fully Integrated Duals Advantage (FIDA) plans, receive a combined capitation rate from Medicare and Medicaid. Enrollment in FIDAs is not mandatory, but the appropriate dual eligibles were subject to a “passive enrollment” process in which they would automatically be enrolled in a plan if they did not explicitly opt out of the program. The passive enrollment process was implemented during 2015 and the vast majority of those eligible opted out.
Two groups previously excluded from managed care but with specialized and expensive care needs are those with severe mental illness, including substance abuse, and those with developmental disabilities. Some in each group are treated in residential facilities such as mental hospitals, residential drug treatment programs, and supervised homes for those with developmental disabilities; others require extensive outpatient treatment for specialized conditions as well as other physical illness. Because mainstream MCOs were not required to provide these services, individuals in these groups have been exempt from managed care mandates.
The MRT sought to extend managed care to these groups by authorizing the creation of and capitation payments to two new types of managed care entities. Health and Recovery Plans (HARPs) include a range of behavioral health services as well as mainstream physical health services. An estimated 140,000 individuals with severe mental illnesses will be served by these entities.17 Enrollment in HARPS is taking place on a phased-in basis. Enrollment of adults in New York City took place during the last quarter of 2015; adults in the rest of the state will be enrolled in the last half of 2016.18
For individuals with development disabilities, an initial plan called for the development of distinct managed care entities dubbed Developmental Disabilities Individual Support and Care Coordination Organizations or DISCOs. Their benefit package was to include special services for the developmentally disabled as well as most long-term care and behavioral health services, but not mainstream physical care services generally available to this population through Medicare on a fee-for-service basis.19 Extensive discussions with CMS and other constituencies eventually yielded a federally approved initiative in November 2015 for the Fully Integrated Dual Advantage–Individuals with Developmental Disabilities (FIDA-IDD) program.20 The DISCO approach was dropped, and one result was Partners Health Plan became the sole contractor for the program. Enrollees are assigned a care manager and covered benefits include all Medicare and Medicaid benefits and community and home based support services.21 All enrollment is voluntary with people required to opt in. Enrollment began in April 2016 and is limited to New York City, Long Island, and Westchester and Rockland counties.
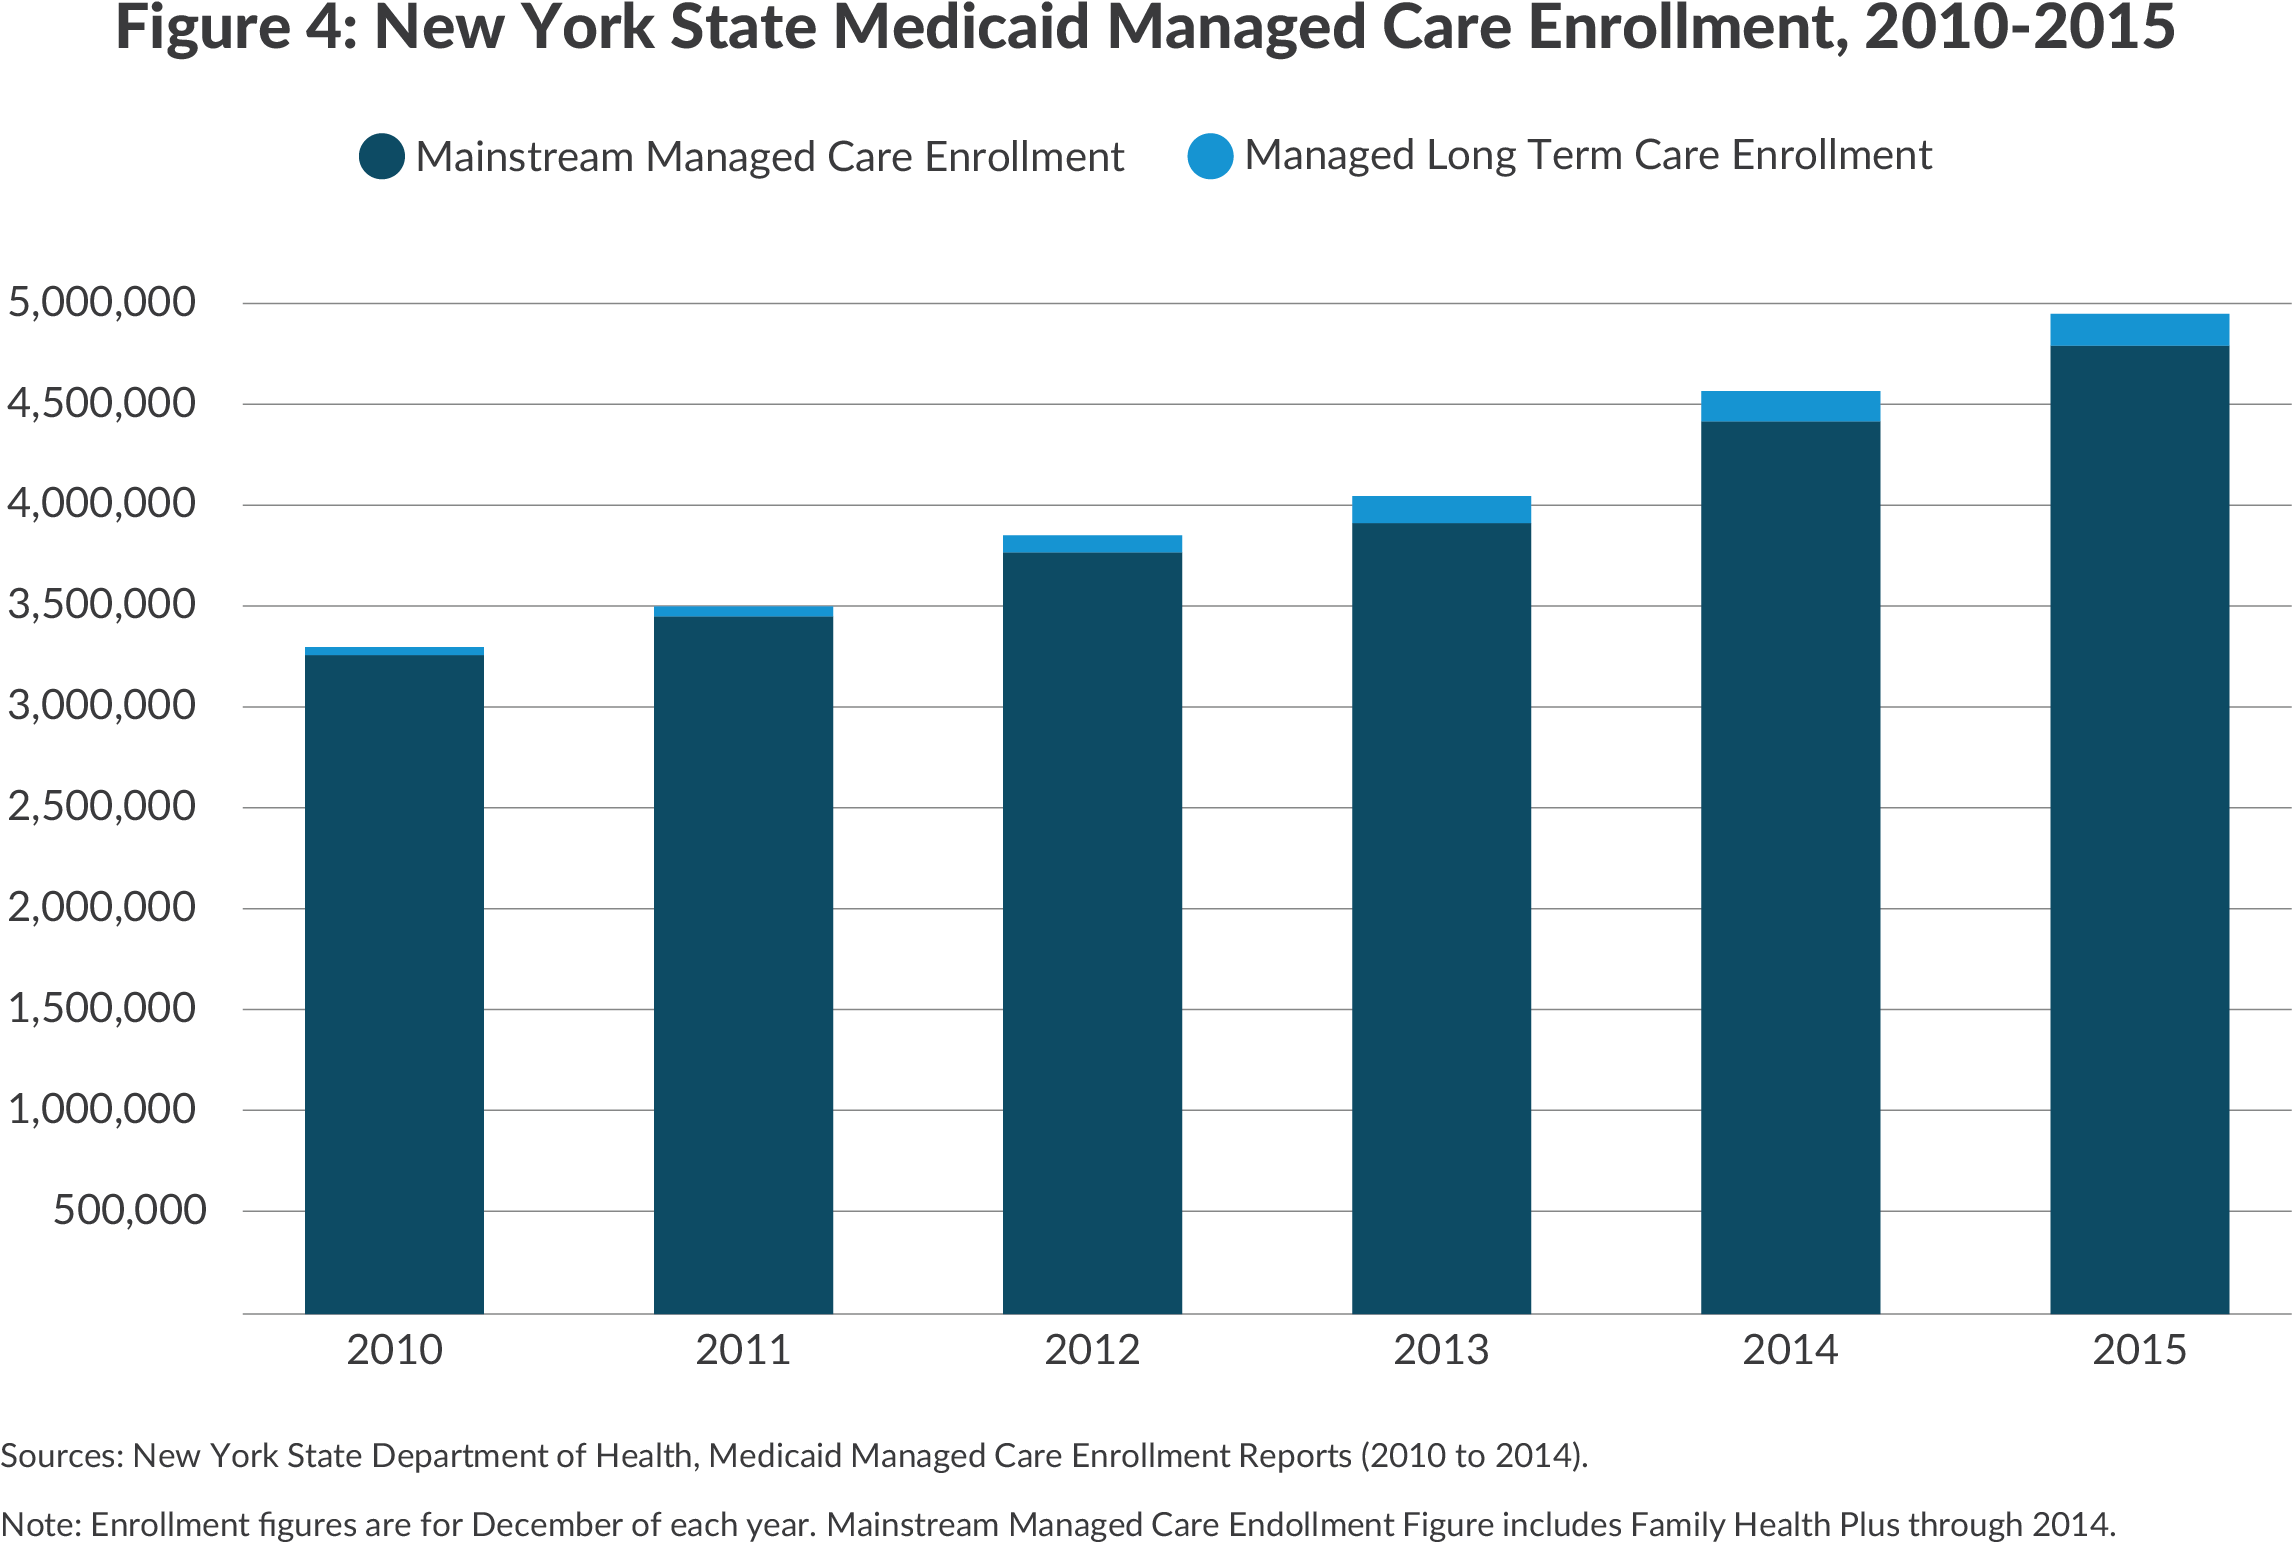
These initiatives have resulted in substantial growth in managed care enrollment and the share of Medicaid spending going to MCOs. From 2010 to the end of 2015 total managed care enrollment in Medicaid increased 46 percent from 3.3 million to 4.8 million.22 This includes a quadrupling of managed long-term care enrollment from 39,297 to 169,286. Mainstream managed care enrollment among the non-elderly and non-disabled rose 68 percent to more than 4.3 million while enrollment among the elderly and disabled grew at a slower 14 percent to reach 338,936.23
The share of Medicaid spending for services going to MCOs also increased notably from 23 percent in 2010 to 54 percent in 2014, the latest year for which the data is available.24 Among the non-elderly and non-disabled the share increased from 48 percent to 76 percent for adults and from 49 to 71 percent for children. For the elderly and disabled managed care spending also grew as a share of the total but remained at lower levels due to the relatively limited enrollment; spending shares for the elderly increased from 12 percent to 44 percent and for the disabled from 9 percent to 36 percent.
New Delivery Mechanisms
The MRT has sought to enhance the coordination of care for Medicaid enrollees by promoting the creation of two new delivery mechanisms – Health Homes and Performing Provider Systems (PPSs).
Health Homes
Health Homes are intended to serve those with a serious mental illness or two chronic conditions. (A plan to include those needing long-term care and the developmentally disabled is being developed.) The goal is to better coordinate the services of multiple providers involved in treating these patients. To qualify as a Health Home the entity must meet six criteria: comprehensive care management, care coordination and health promotion, comprehensive transitional care (such as for an inpatient discharge), patient and family support, referral to community services, and use of health information technology to link services.
Meeting the criteria generally requires assigning the patient to a designated care coordinator. Entities that meet the criteria and enroll a patient receive a monthly capitation rate for the service.
The program was phased in during 2012. Potential Health Home entities applied to the NYSDOH and qualified entities were recognized. Currently 32 organizations are recognized as Health Homes. The NYSDOH identified all current Medicaid-covered adults who met the criteria (approximately 225,000 individuals) and sent their relevant information to the most suitable Health Home.25 It was up to the Health Home to voluntarily enroll members, and the organization received a payment from the Department for up to three months as a fee for outreach and engagement. As of late 2015, 116,485 individuals had signed up as Health Home members.26
Performing Provider Systems
PPSs are a group of providers who agree to cooperate in providing and coordinating services to the Medicaid population (and others) in the counties in which they operate. The objective is to improve the quality of care for this population with an emphasis on reducing unnecessary inpatient and emergency room hospital care. The plan for PPSs evolved in negotiations with the CMS over a waiver including federal funding for MRT initiatives. CMS approved the waiver in 2014 as one of seven it has granted to states as part of its Delivery System Reform Incentive Payment (DSRIP) program. The DSRIP waivers are intended to strengthen the delivery system serving low income populations.27 The NewYork version provides $8.0 billion in federal funds over five years including $6.4 billion to plan and establish PPSs.28
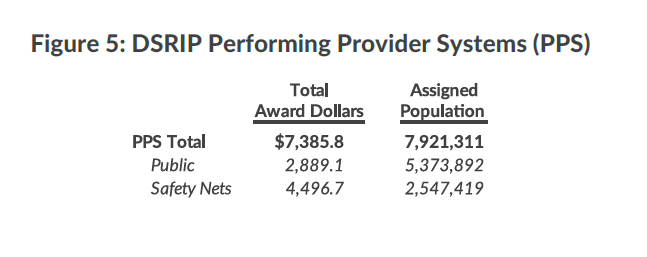
The initiative was launched in 2014 with 25 PPSs receiving planning grants and gaining approval; 10 serve New York City, 3 serve the Mid-Hudson region, 2 each in the Capital region, Long Island and Western New York, and 1 in each of six other regions.29 The number of Medicaid enrollees served by each PPS ranges from nearly 2.8 million for NYC Health + Hospitals to under 13,000 for the New York Hospital PPS in Queens and 27,000 for the Refuah Collaborative in Orange and Rockland counties.
PPSs are coalitions of providers seeking to form new partnerships that will evolve into integrated delivery systems.30 Each PPS has a lead organization that in most cases is a major medical center (the exception is Advocate Community Providers, a physician group). The PPS coalitions include numerous other providers such as community health centers and managed care organizations. PPSs’ size, structure, and composition vary, but the lead organization is responsible for ensuring that the coalition and its partners meet all PPS requirements and has fiduciary responsibility for the support funds.
Each PPS selected between 7 and 11 projects to pursue from a pre-established list of 44 priority activities divided among three domains– system transformation, clinical improvements, and population wide projects. Among the most frequently selected projects are efforts to integrate primary care and behavioral health (all 25 PPSs), integrated delivery systems (22), chronic disease transitions (17), and adult cardiovascular high risk management (15).31
From 2015 to 2019 the PPSs are eligible to receive up to $6.3 billion in federally funded DSRIP incentive payments administered by the state contingent on making progress toward implementing the projects and achieving the reduction in unnecessary care. In 2015 the State authorized an additional $1.1 billion for the PPSs, bringing the total available to nearly $7.4 billion. The payments are made to a lead organization in the PPS (typically a hospital in the area serving a large number of Medicaid patients), which allocates the money among the coalition members. The projected eligible amounts including the State supplements vary from $1.2 billion for NYC Health + Hospitals to $32 million for New York Hospital Queens.
In addition to the $7.4 billion in payments to PPSs, other State and federal funding supports the MRT goals with respect to PPSs. The largest supplements are State grants for capital projects authorized in 2014 and 2015 as the Capital Restructuring Financing Program and the Essential Health Care Provider Support Program. Together they made available more than $1.5 billion in state supported capital grants. In March 2016 the awards were made for 162 projects statewide with $673 million for 73 projects in New York City, $112 million for 16 projects on Long Island, $230 million for 15 projects in the Mid-Hudson region, $156 million for 10 projects in Western New York, $101 million for 6 projects in Central New York, $95 million for 10 projects in the Finger Lakes region, $74 million for 6 projects in the Southern Tier, $55 million for 13 projects in the North Country, $40 million for 4 projects in the Mohawk Valley, and $17 million for 9 projects in the Capital region.32
Additional funding has been available through the Interim Access Assurance Fund (IAAF), the Vital Access Provider Assurance Program (VAPAP) and smaller programs created by the State to support DSRIP goals. The IAAF was one-year funding from federal grants for distressed hospitals during the first year of the DSRIP program (April 1, 2014 to March 31, 2015) to help them sustain themselves in this period. Grants totaling $500 million were made to 7 large public hospitals, including $152.4 million to NYC Health + Hospitals, and 27 private safety-net hospitals with the largest being $68.1 million to Brookdale Hospital.33 The VAPAP is a State funded program that continues the IAAF in the remaining years of the DSRIP program. During fiscal year 2016 about $333 million was awarded through VAPAP and related programs to 28 private hospitals; the largest grants are $82 million to Brookdale Hospital and $47 million to Interfaith Medical Center.34
Want to See All DSRIP PPS?
Download the Full ListValue-based Payments
The most recent redesign strategy was developed as part of the agreement for the federal DSRIP grant. The goal is to shift from payments to providers based on the volume of services (for example, number of physician visits or hospital admissions) to the quality of care provided as reflected in outcomes; for example, number of successful hip replacements or number of patients treated appropriately for diabetes during a year. Since an MRT goal is to have most Medicaid enrollees in an MCO paid with a monthly capitation payment, the value based strategy applies to payments by MCOs to their participating providers.
Planning for conversion to value-based payments began in 2014; in June 2015 the State Health Department submitted a “roadmap” for the transition, and this was approved by CMS in July 2015 with a requirement for annual updates with further details for implementation.35 A draft annual update was released for public comment in March 2016.36
The plan recognizes multiple forms of value-based payments distinguished by the scope of services covered and the nature of risks the providers assume. The scope of services involved can be primary care services linked to chronic condition management, particular bundles of services associated with care for specific conditions with the major example being maternity care, or total care received by a population group. The nature of the risk can be at one of three levels: (1) fee-for-service payments with an “upside only” risk based on sharing any savings from lower than targeted payments; (2) fee-for-service payments with an “upside” and “downside” risk based on bonuses or penalties for costs exceeding targets; (3) capitation payments for a package of services with providers at risk for all gains or losses. In each case the share of savings available to the provider (or share of losses to be made up by the provider) is based on the share of quality indicator targets met.
The timeline for implementing value-based payments requires use of such payments to begin in the third year of the DSRIP program (April 1, 2018 to March 31, 2019). In that year at least 10 percent of MCO payments to providers must be using a level 1 degree of risk or higher. In the fourth year the goal is at least 50 percent of payments at level 1 risk or higher with at least 15 percent at level 2 or higher. In the final year at least 80 percent of payments must use a value-based approach of at least level 1, and at least 35 percent at level 2 or higher.37
Initial Fiscal Impacts
The MRT initiatives have slowed the growth in total Medicaid spending. This has been accomplished despite significant expansion in the number of enrollees, meaning the changes have yielded notable absolute declines in per enrollee costs.
Total Spending
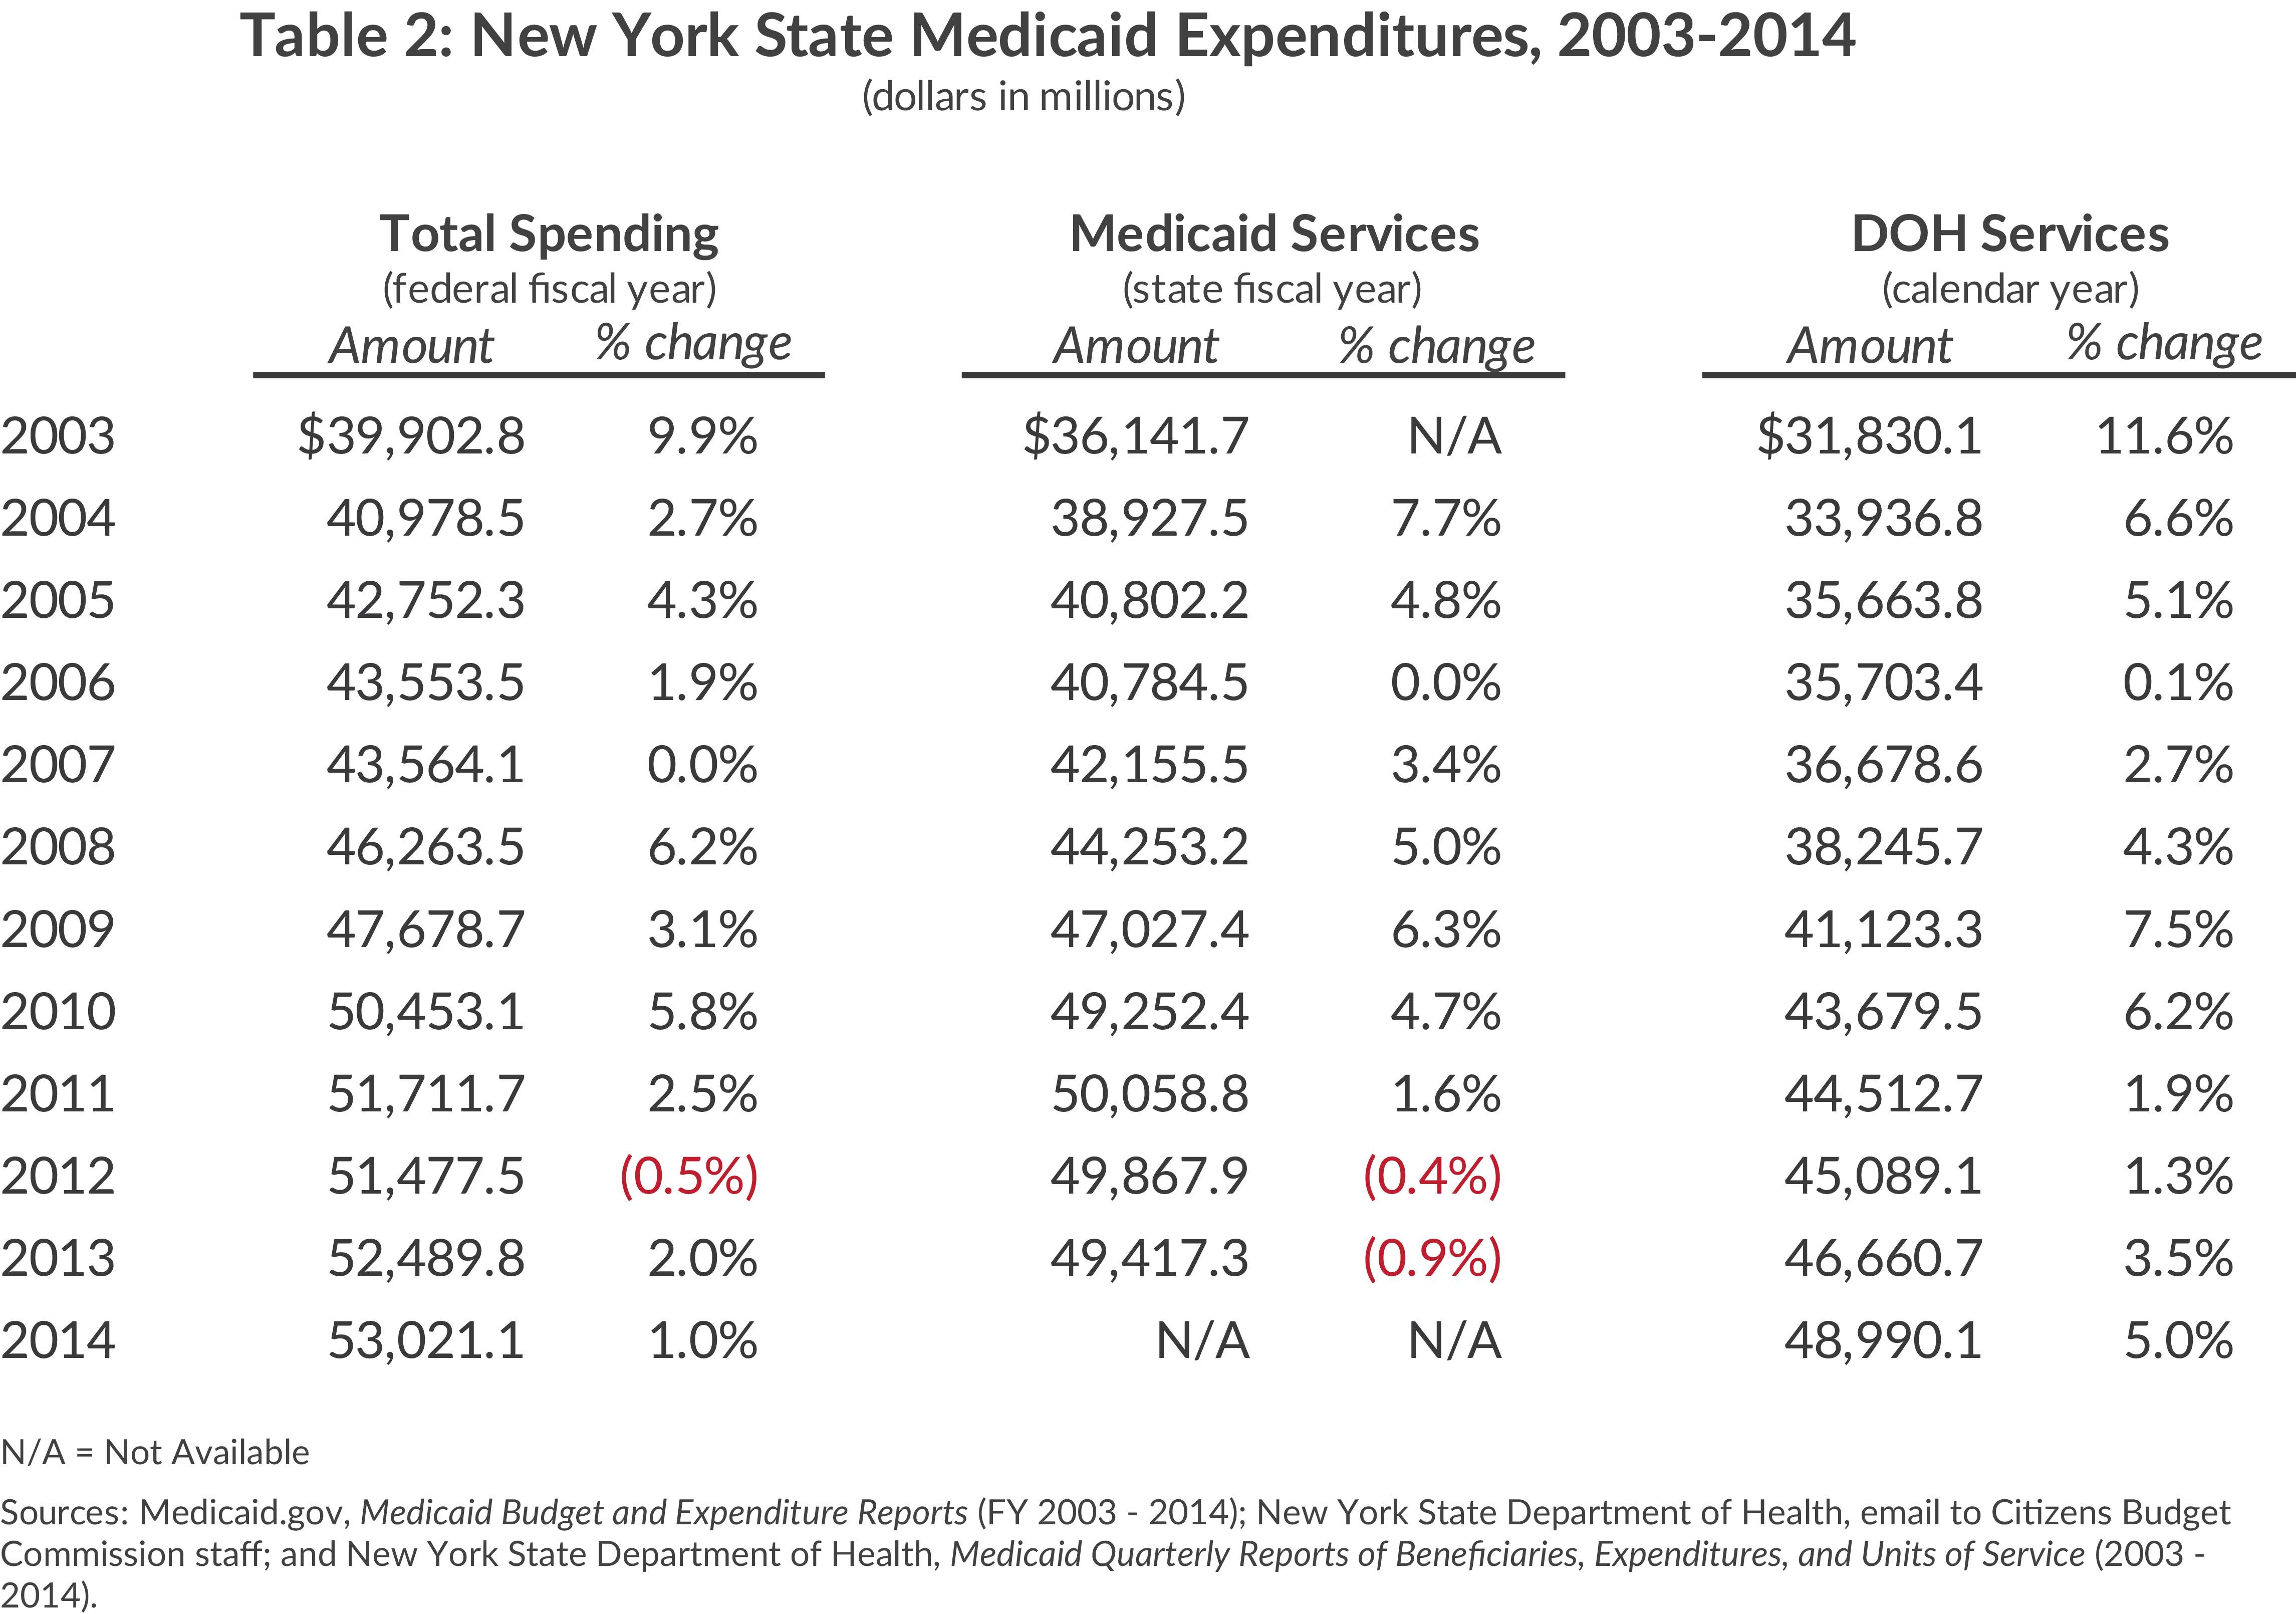
Table 2 presents recent trends in three measures of Medicaid spending: total program expenditures (labeled “Total Spending”), expenditures for most services but excluding administrative and DSH costs (“Medicaid Services”), and a somewhat narrower measure of expenditures for services that excludes certain services not under the jurisdiction of NYSDOH (“DOH Services”).38
The indicators show a slowing of expenditure growth in the most recent years. Total spending increased less than 2.5 percent in each of the four years from 2011 to 2014 and actually declined in 2012. Medicaid Services spending shows modest declines in the two most recent years and an increase of just 1.6 percent in 2011. These figures contrast with notably higher rates of increase in earlier years, although 2006 and 2007 were also years of slowed growth.
Expanded Enrollment
As previously noted, New York has long pursued policies to broaden eligibility for Medicaid. While federal law requires coverage of some groups, New York has taken advantage of federal options to cover additional people with incomes above the poverty level and obtained federal waivers to extend eligibility to some otherwise excluded. It also has given benefits to some not qualifying for federal reimbursement under a “state only” component of the Medicaid program. Moreover, during the past decade the State has changed administrative practices to ease the process of enrollment and recertification by requiring less documentation of income and reducing in-person interviews.
The federal ACA, passed in 2010 and fully effective in 2014, promoted expanded enrollment in three ways. It established new national standards for Medicaid eligibility that extended the program nationally to millions of near-poor people previously excluded. A 2012 Supreme Court decision ruled the new standards could not be mandated on unwilling states, but maintained the provisions of the ACA that provided enhanced federal matching for states that expanded Medicaid eligibility. New York has embraced the increased income limits. Although New York’s previous decisions to cover many non-mandated individuals mitigated the impact of the new federal standards, they were estimated to extend the program to about 77,000 New Yorkers.39 In addition about 450,000 people in a New York Medicaid waiver program known as Family Health Plus either became eligible for more generous regular Medicaid benefits as a result of the ACA’s new income eligibility standards or became eligible for subsidized private insurance under the ACA.
Second, the ACA established new ways for people to enroll in Medicaid that eased access to its benefits. The federal law authorized states to establish web-based mechanisms for enrollment in Medicaid and the new subsidized program of private insurance thereby reducing any stigma that may have been attached to earlier application processes; it also eliminated certain asset tests and standardized definitions of income to streamline the application process. New York successfully launched its statewide web-based exchange in October 2014.
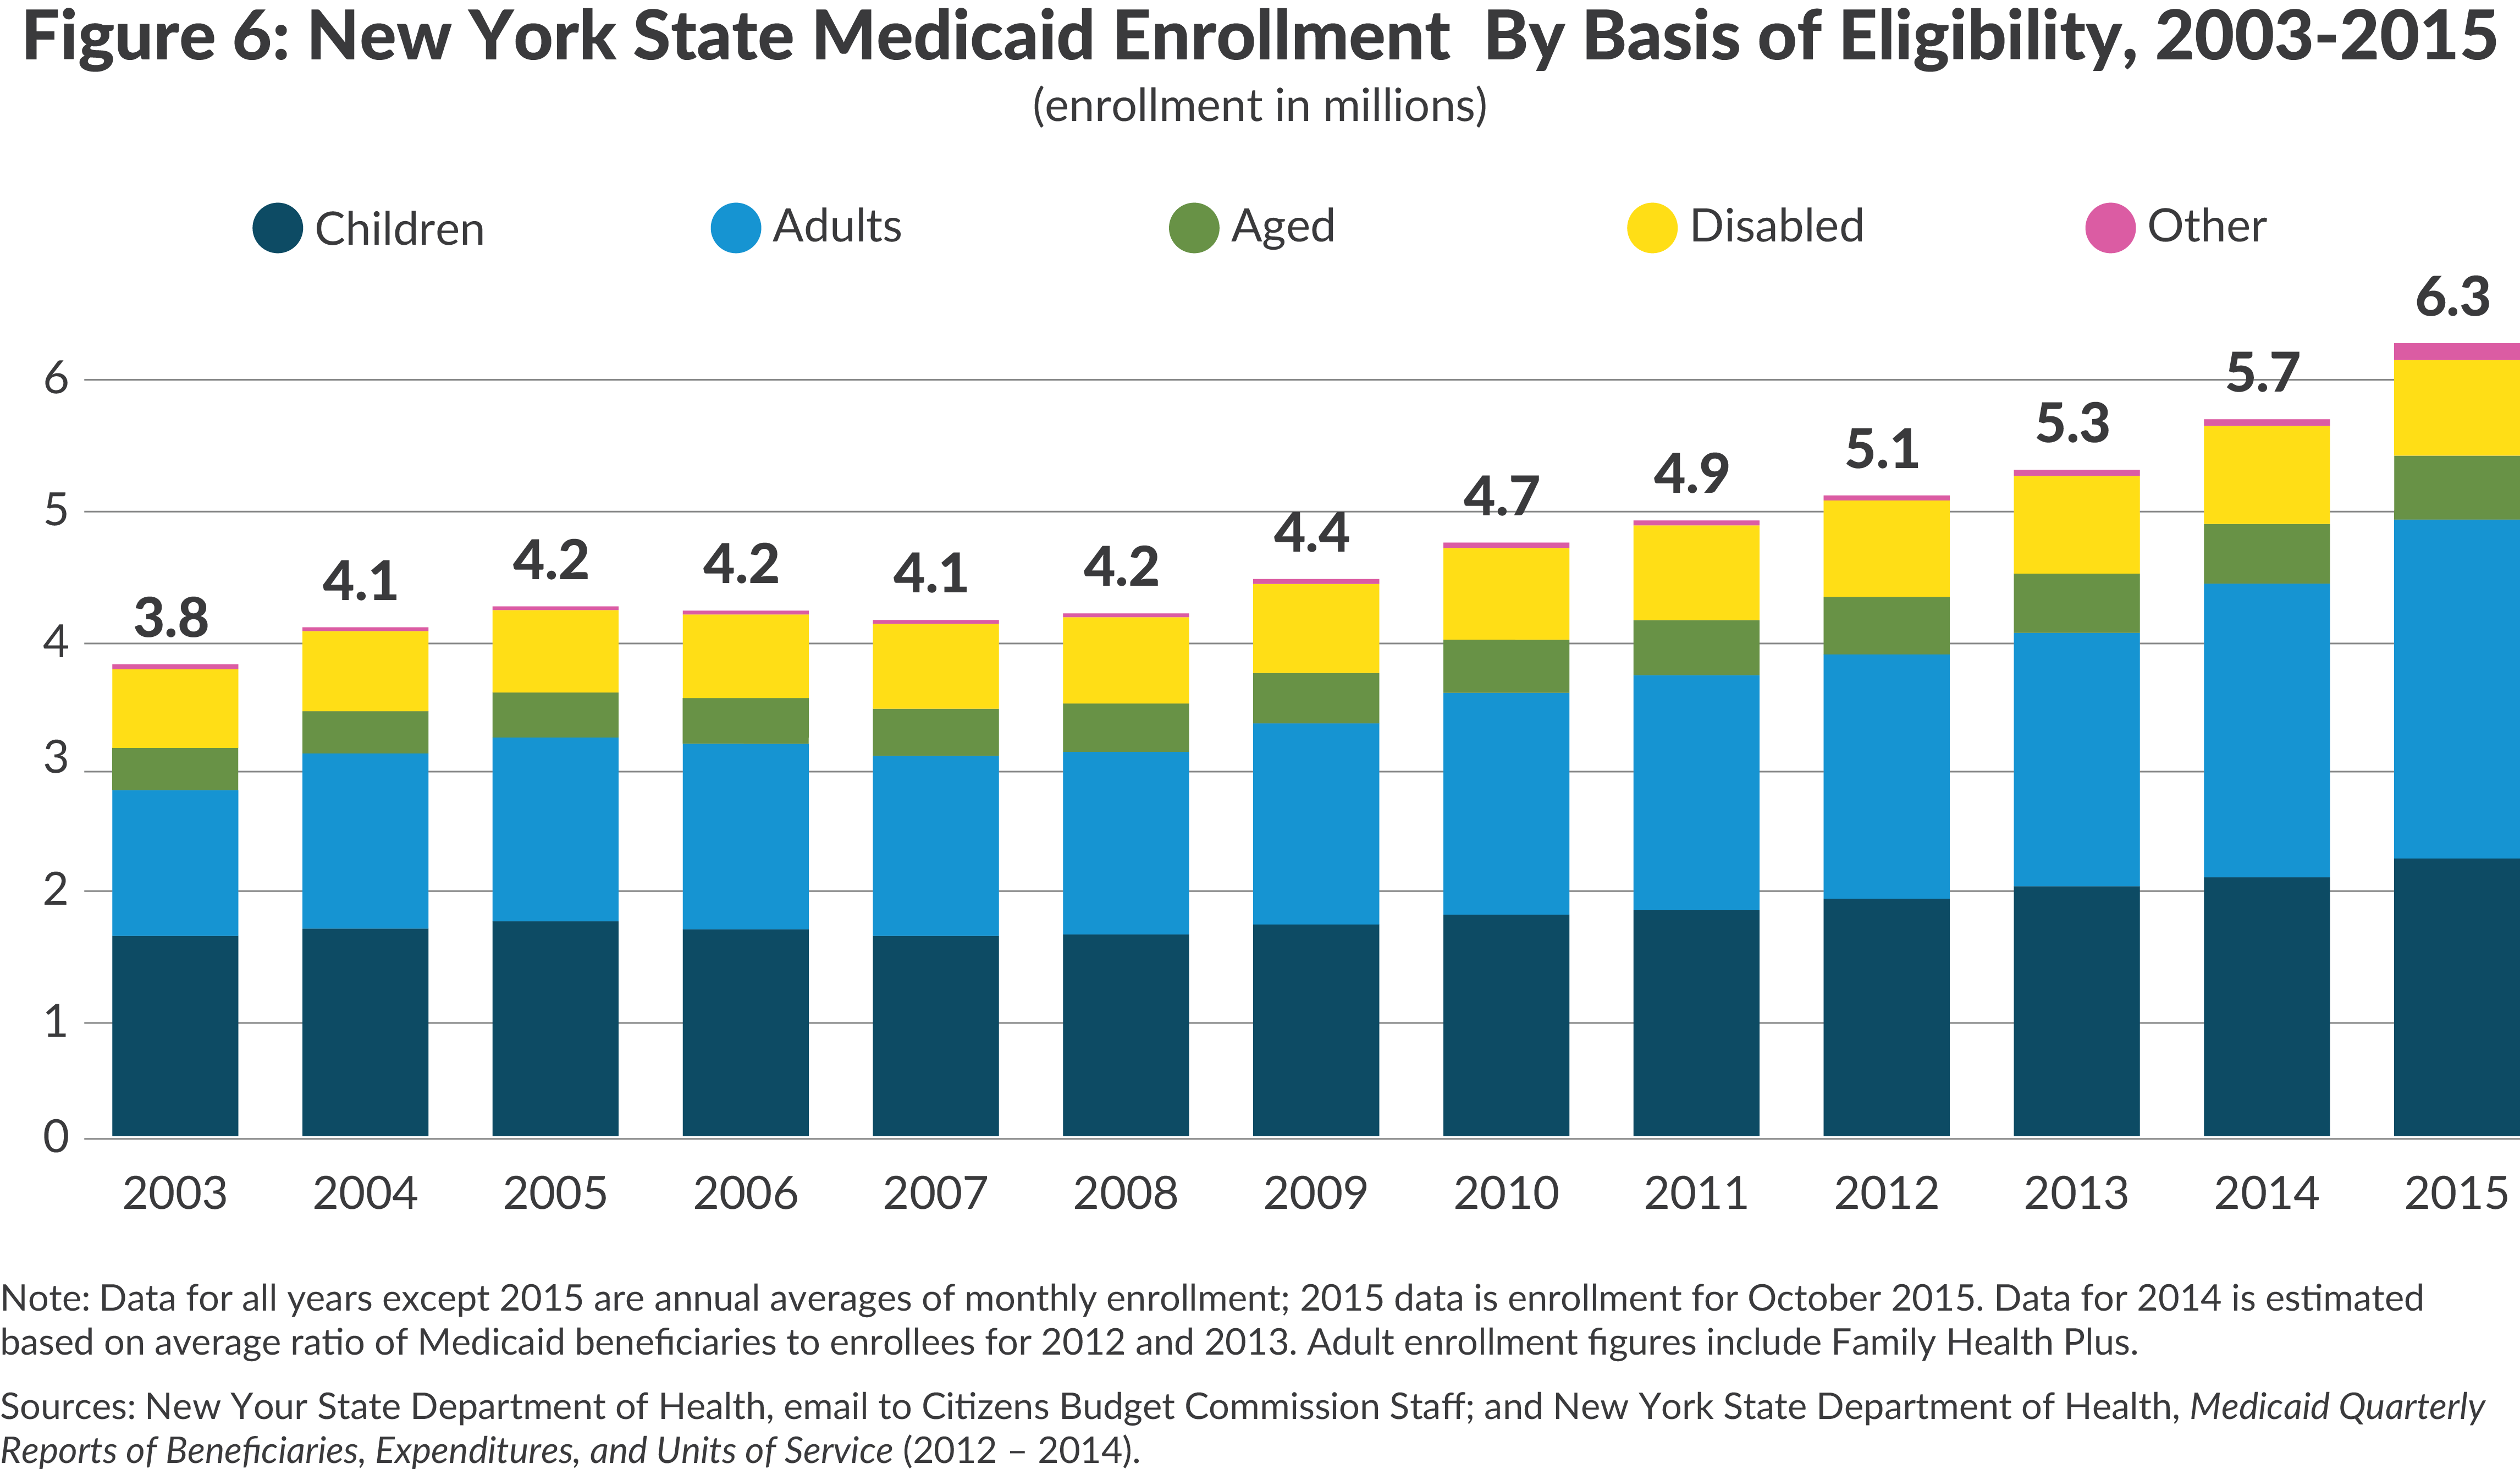
Third, the ACA authorized states to create a “basic option” health plan that New York has called the Essential Plan. The Essential Plan is intended to cover two types of individuals: those with incomes above the Medicaid income level and up to 200 percent of the poverty level who do not have access to employer coverage and low-income lawfully-present immigrants who are not eligible for federal Medicaid subsidies due to immigration status. People qualifying for the Essential Plan can select one of several available managed care plans; the premium and out-of-pocket costs are covered through a combination of federal subsidies and State subsides included in the State’s Medicaid budget. The Essential Plan has been phased in during 2015 and 2016. Many lawfully-present immigrants qualifying for the Essential Plan had previously been covered under a “state only” Medicaid option, making the Essential Plan a less costly mechanism for coverage for the State. The combined effect of these changes in eligibility rules and practices was a significant expansion of Medicaid enrollment.40 (See Figure 6.) From 2010 to 2015 total enrollment increased 1.6 million, a one-third increase, bringing total enrollment in 2015 to 6.3 million. The largest annual increases, 7.2 percent and 11.0 percent, were in 2014 and 2015 respectively, when the expansions under the ACA became effective. Growth in enrollment among the aged and disabled was slower than among the other adults and children, who were most affected by the ACA provisions.
Lower Costs per Enrollee
Given the dramatic recent expansion in enrollment, the constrained growth in total Medicaid spending is attributable to lower costs per enrollee. From 2010 to 2014, the latest year for which data are available, the average annual cost per enrollee declined 17 percent from $10,432 to $8,620.41 A portion of this decline is resultant from the changing mix of enrollees; in 2014 proportionately fewer were the higher cost aged and disabled. But declines in cost per enrollee are evident for three of the four major categories of enrollees. Between 2010 and 2014 the decline was 24 percent for the disabled, 19 percent for the aged, and 18 percent for other adults. Costs for non-disabled children, which are far lower than for the other enrollees, were relatively stable from 2010 to 2013, but rose 8 percent in 2014 to an all-time high.
It is also important to consider two alternative explanations to the favorable fiscal results of the MRT initiatives. One is that the 2010 to 2014 developments were simply a continuation of a pre-existing trend with other causes. The facts do not support this explanation. While costs did not rise steadily in the preceding years, no clear downward trend is evident except among the aged. For the aged the decline after 2004 is related to enactment of the federal Medicare Part D program which transferred much of the cost of prescription drugs for the low-income aged from Medicaid to Medicare.
Another possibility is that in recent years larger national forces have been restraining health care spending, and this is driving the New York Medicaid declines. However, national health care spending per capita has been rising since 2010 at rates between 2.2 percent and 4.2 percent annually; no declines similar to the New York Medicaid trend have occurred.42 The recent growth in national health care spending per capita is slower than in some previous periods, but the trend continues up, not down.
Multiple MRT initiatives in the initial years directly contributed to lower per enrollee costs. Initially a 2 percent across the board reduction was applied to all provider payment rates and MCO premiums, and further reductions were applied to some nursing home and managed care plan rates. The nature of the pharmacy benefit was restricted with more reliance on generic drugs, and limits were placed on home health and personal care services. As pharmacy, behavioral health, and other benefits were folded into the managed care plans, the rate adjustments typically assured savings by incorporating rates that assumed utilization would be reduced from the fee-for-service experience. Hospital payments were excluded for conditions acquired by enrollees while in the hospital. Effective in fiscal year 2014, and in response to disallowances by the federal government, the State lowered its rates for payment for services to individuals with developmental disabilities by more than $1.0 billion annually.43 More rational utilization patterns through reliance on Health Homes and expanded managed care enrollment are also likely reducing costs, but these impacts may be emerging more slowly.
A noteworthy change accompanying the lower cost per enrollee is higher quality services. The Commonwealth Fund’s 2015 scorecard on state health system performance showed New York improving from its weak 2009 ratings.44 New York’s overall ranking rose from 21 to 13 among the 50 states, and its ranking for avoidable hospital use jumped from last to 26. However, its rank for prevention and treatment remained mediocre at 28.
Prospects For and Challenges To Future Savings
Future Savings
What is a reasonable expectation for the nature and magnitude of future savings? Most of the savings are expected to result from lower per enrollee costs among each type of Medicaid eligible person, primarily from more efficient utilization of services (less unnecessary care and more effective primary care). Achieving the lower cost from a more rational mix of services may require a change in the size and skill mix of the workforce; however, increased Medicaid enrollment, broader insurance coverage under the ACA and a more aged population are likely to increase demand sufficiently to continue employment growth in the health care sector. Recent increases in the minimum wage will affect a significant number of workers in health service firms, creating new cost pressures.
Gauging the magnitude of any future savings requires specifying a “baseline” of assumed change in cost per enrollee before the redesign strategies are fully implemented. New York State budget documents do not specify a baseline assumption for cost per enrollee in total or by eligibility category, but estimates by the Congressional Budget Office (CBO) for federal programs provide a useful national context. The CBO projections for 2015 to 2025 assume a baseline growth in federal Medicaid spending of 6 percent annually in federal fiscal years 2015 to 2017 and subsequent growth of 5 percent annually. Since enrollment is projected to increase, the average spending per enrollee increases slightly less, with rates varying among types of enrollees. For example, in the fiscal year 2016 to 2020 period, annual growth rates for children average more than 6 percent annually while the rate for the aged averages about 2.5 percent annually, likely reflecting the role of Medicare in absorbing much of the cost of care for the elderly.45 Based on CBO data an average per enrollee increase of about 4.5 percent annually seems a suitable baseline.
The MRT goals for cost containment are reflected in two indicators – a “global spending cap” in effect since fiscal year 2012 and a target for per enrollee spending growth in future years. Despite its name, the global spending cap does not apply to all Medicaid spending; it applies only to certain state funded expenditures, primarily state funded services administered by NYSDOH. In fiscal year 2015 the cap applied to an estimated $16.5 billion of spending of a total of about $22.0 billion in state funded spending and $58.8 billion in total state, local, and federal spending.46 The cap is linked to the 10-year average annual growth in the medical care component of the consumer price index (CPI), which in recent years has been between 2.4 and 3.7 percent.47 The State Division of the Budget’s projections for the cap for State fiscal years 2017 to 2020 are 3.4 percent, 3.2 percent, 3.0 percent, and 2.8 percent, respectively.48 The cap is a useful tool for budgeting and limiting state funded spending, and comparisons with previous trends in Medicaid spending suggest it has achieved substantial savings. However, its altered scope since enactment, its adjustments for increased federal funding, and its lack of adjustment for enrollment changes make it less useful as a gauge of greater efficiency through reductions in per enrollee costs.49
A target for per enrollee cost is specified in the agreement with the federal government for the PPS payments. The target applies to the last two years of the five-year project (that is, state fiscal years 2019 and 2020) and limits growth in per enrollee spending to the 10-year average growth in the medical care component of the CPI.50 The limit is linked to average spending among all groups of enrollees and is not adjusted for change in the composition of the enrolled population such as changes in the share of elderly and disabled enrollees. An accompanying goal is that per enrollee spending for hospital and emergency room care increase at a rate 2 percentage points below the overall rate in the last two years (with offsetting higher rates for other services).
The magnitude of the anticipated savings from the redesign strategies can be approximated by comparing the target growth rate agreed upon for the PPS demonstration with the previously noted CBO national baseline trend in per enrollee spending. The difference between the CBO’s baseline annual increase of about 4.5 percent and an assumed medical CPI average growth of 3.0 to 3.5 percent is 1.0 to 1.5 percent. Applying a 1.0 to 1.5 percent savings to projected Medicaid services spending in fiscal year 2019 of $63.2 billion yields savings of $632 million to $942 million; for fiscal year 2020 the savings is another 1.0 to 1.5 percent from the projected baseline of $65.2 billion, yielding an additional savings of $652 million to $697 million.51 Restated these calculations suggest that in fiscal year 2020 and each year forward Medicaid spending will be about $1.3 billion to $1.9 billion less than would have been the case without the continuing redesign strategies.
Are savings of this magnitude, that is, about 2.8 percent, a reasonable estimate of what can be achieved from the combined strategies of managed care, new delivery organizations and value-based payments? An extensive literature evaluating Medicaid managed care and coordinated care delivery models provides only a limited answer. Much of the literature focuses on impacts on quality of care rather than costs and generally finds positive results.52 For Medicaid managed care the studies finding the greatest savings—as much as 20 percent—relate the savings primarily to reduced hospital utilization, but the estimates are questioned on grounds that the studies were sponsored by managed care plan organizations and/or were not subject to peer review.53 Several more rigorous studies find little or no savings in most states that have expanded managed care; a few studies find limited savings attributable to lower payment rates more than reduced utilization.54 The implication is that potential savings are greatest in states with a high rate of hospital utilization and high fee-for-service payment rates. This suggests the potential is strong in New York.
The evidence for cost savings from delivery models with greater coordination of care is also mixed. The studies generally relate to models used for Medicare beneficiaries, particularly those with chronic illnesses and extensive service needs. Among this group rigorous studies have indicated savings of about 3 percent in Medicare costs, when well designed staffing models are used.55
In sum, the evidence is limited and mixed, but New York’s goal of about 2.8 percent savings from redesign strategies appears reasonable and perhaps modest. More aggressive goals exceeding 3 percent might be appropriate.
Implementation Challenges
Although the MRT and NYSDOH staff have a five year record of notable accomplishments, their strategies will not be fully implemented for another five years and some of the MRT’s major initiatives are still in an early stage. Elements of the strategies to expand managed care, to create new delivery mechanisms, and to rely on value-based payments have faced and will face serious challenges. In brief, these challenges are:
- The desired enrollment of nearly all Medicaid eligible individuals in managed care plans is hampered by the slow pace of developing managed care models for many people with extensive service needs including the dually eligible population and those with developmental disabilities.
- The use of Health Homes to coordinate the care of those with multiple conditions is similarly hampered by the substantial implementation challenges and voluntary nature of the program.
- The development of PPSs is likely to be slowed by a need for coordination among multiple autonomous entities and the absence of preset policies for distributing funds from the lead agencies to other participating providers.
- The design and implementation of the value-based payment strategy faces complex technical issues in identifying appropriate measures and requires difficult policy choices about how to structure the at-risk portion of payments.
Limited Managed Care for the Dual Eligibles
More than 700,000 Medicaid enrollees are dual eligible; that is, enrolled in Medicaid and Medicare.56 For these aged or disabled individuals Medicaid pays for Medicare premiums and copayment and for services not covered by Medicare (most long-term care services), and Medicare pays for many acute care services. An important MRT objective is to better integrate these two programs and the care they support.
Priority has been given to two subsets of the dual eligible requiring expensive care – the developmentally disabled and those requiring extensive long-term care. As described earlier, beginning in 2012 dual eligible people requiring extensive long-term care have been required to enroll in long-term care managed care plans covering long-term care benefits but not necessarily also covering acute care benefits. As of the end of 2015 about 162,000 of the 170,000 people intended to be reached had enrolled in a managed long-term care program.57 In order to integrate the long-term care and acute care services for this population, the State gained approval in 2013 from CMS to launch a Fully Integrated Duals Advantage (FIDA) program that offers one managed care entity to provide both types of services. However, enrollment is not mandatory, and few people have enrolled. As of late 2015 only about 7,500 people had enrolled, compared to MRT projections of as many as 100,000.58 The State is in the process of redesigning the initiative to achieve better results.
Designing a managed care program for the developmentally disabled required extensive discussions with CMS and eventually yielded a federally approved initiative for the FIDA-IDD program. The initial plan for specially designed DISCOs was revised; the plan being offered has a more narrowly defined target population and includes capitation funding for a full range of Medicare and Medicaid services. Of the more than 100,000 developmentally disabled individuals statewide, about 20,000 in the selected counties are estimated to be eligible for this program.59 All enrollment is voluntary, and it remains to be seen how many will enroll. The Office for People with Developmental Disabilities, the State agency with primary responsibility for this group, created its own Transformation Panel in February 2015, and its recommendations point to a cautious transition to managed care focusing initially on community support services.60
Although the developmentally disabled and those with extensive long-term care needs are the most expensive among the dual eligible, another approximately 470,000 aged and disabled dual eligible individuals could also benefit from managed care. So far the MRT has not developed an initiative aimed at promoting managed care for this group. The lower priority may be related to their lower cost than the other dual eligible groups, and may also be related to the CMS position that Medicare enrollees generally should not be subject to mandatory managed care.
Limited Enrollment in Health Homes
As noted earlier, Health Homes have enrolled only about 116,000 or just over half of the 225,000 people identified as eligible due to their multiple conditions. A large group of people who could benefit from the program have opted not to enroll, and this continues more than three years after the initiative’s launch. Given the potential fiscal and health outcome benefits from the arrangement, renewed efforts to expand enrollment seem warranted.
Independent analyses of the Home Health initiative completed in 2013 and 2014 shed light on the nature of the difficulties in launching and expanding the program.61 Some potential Health Home organizations encountered start-up issues due to lack of standardization in NYSDOH rules regarding qualifications of staff and coordination of care requirements, which the Department allowed in order to provide flexibility. Uncertainty about payment rates and adjustments to rates for the acuity of patient conditions made it difficult to create viable business models, and the standards for sharing of electronic medical record information and measuring quality also were perceived as difficult to meet. Finally, outreach and enrollment of designated patients proved problematic, especially for those with behavioral health conditions who were a major segment of the initial target population. Dealing with these multiple issues requires revision to the initial design and takes considerable time to implement.
Looming Management Challenges for PPSs
PPS initiatives have dealt successfully with early issues. The initial award amounts for each PPS were controversial with some providers complaining that public hospital led PPSs were favored too heavily; the State responded by creating supplementary programs to support DSRIP goals that added funds to the federal grants and increased amounts allocated to the other PPSs.62 The coordination among multiple providers participating in PPSs potentially violates rules limiting restraint of trade or conspiracy among these otherwise competing entities; the resolution of this difficulty is the granting of Certificates of Public Advantage (COPA) to the PPS by the State NYSDOH based on evidence that the coordination has public benefits. In the initial year, three PPSs applied for COPAs.63 The Federal Trade Commission objected to the applications on the grounds they were unnecessary or, if they created inefficiencies, were not justified.64 Subsequently Adirondack Health Institute PPS withdrew its application; applications from Staten Island PPS and Advocate Community Providers PPS are still pending.
Greater challenges are likely to confront PPSs in coming years. Payment of the federal funds in each year is contingent on reporting on and meeting goals that cover both activities and results. In the later years of the five-year project, each PPS must show results that include reducing unnecessary hospital care and gains in other outcome measures for its assigned population. In addition there must be statewide progress in reducing unnecessary care and limiting growth in Medicaid expenditures per enrollee. Failure to meet the goals can result in financial penalties in the last three years of the program of 5 percent, 10 percent and 20 percent of the authorized amounts in the respective years. NYSDOH is responsible for monitoring and adherence to performance measures and issuance of any penalties.
Some PPSs already have had difficulty meeting the reporting and performance standards. In the second quarter of the first year of the project four PPSs were denied full payments due because they had not fully met reporting or other requirements—the Montefiore Hudson Valley Cooperative, the Nassau-Queens PPS, the Staten Island PPS, and the Bronx Lebanon PPS.65 The largest penalty was $1.1 million for the Nassau Queens PPS.
Additional challenges for PPSs include structuring internal arrangements for the distribution of the program funds. Arrangements must be negotiated between the lead organization and many smaller providers. The negotiations were still ongoing during the first year, and many community based organizations were concerned about how fairly they would be treated within the PPS. Mainstream MCOs also are concerned about their role in the PPSs. They participate as partners in the PPSs and their members are allocated to a PPS, but it is not clear how responsibilities for coordination of care and design of payment reforms will be divided between PPS lead agencies and MCOs with respect to participating providers who are members of MCO networks.
A Slow Shift to Value-based Payments
The initiative to promote greater reliance on valuebased payments is still in its design phase. The United Hospital Fund identified legal issues to be addressed if shifting risk from MCOs to providers is a key element.66 The state licenses three different types of health plans with regulation of each divided between the NYSDOH and the Department of Financial Services. The regulations are intended to protect consumers from paying premiums to plans and then having plans fail and shut down without consumers getting services; this is accomplished through reserve requirements for health plans and by limiting the extent to which health plans can shift risk to the providers with whom they contract (who may not be subject to reserve requirements). If the value-based payment strategy increases the shifting of risk from plans to providers, then changes in the state regulations about the permissible extent of such risk shifting and related reserve requirements may need revision to better protect consumers. The March 2016 revision to the value-based payment plan addressed these issues with recommended statutory and regulatory changes, but appropriate arrangements in contracts between the State and MCOs may still need to be developed.
In addition to these regulatory challenges, the value-based payment strategy faces difficult technical and policy choices. Suitable and practical quality outcome measures must be identified and collected and weights assigned to the quality dimension of payments. The application of this approach to a comprehensive set of services for diverse populations is a complex task which the MRT stakeholders and NYSDOH staff are in the early stage of pursuing.
Conclusion
By pursuing the MRT’s recommended strategies the State has made significant progress in imposing fiscal discipline on New York’s Medicaid program. It has already reduced per enrollee spending, and it has identified longerterm strategies for improving the quality of care and restraining growth in future cost per enrollee. Its strategies of more reliance on managed care, promotion of delivery models with greater coordination of care, and use of value-based payments have potential to benefit New York’s Medicaid population and taxpayers.
However, successful implementation of these strategies faces serious challenges. The greatest barrier is federal limitations on the state’s ability to mandate enrollment in managed care plans and Health Homes. Many of those with the most severe medical care needs and who are most likely to benefit most from these arrangements are not yet participating. New efforts should be made to work with federal officials to develop procedures that encourage and perhaps require such enrollment in the future.
New PPSs have been created, but their success will be tested in future years by their ability to meet clearly set performance goals in terms of new patterns of care and constraints on per enrollee expenditure growth. Another uncertainty is whether PPSs will be sustainable after the substantial federal incentive payments end. Continued strong monitoring of the evolution of these organizations and their action plans is essential, and their ability to achieve measurable improvements is still to be tested.
The design of value-based payments is in an early stage, and many technical and policy issues remain to be resolved. Movement to the most desired forms of payment involving more provider risk for a wide range of services is likely to be slow with substantial progress likely only after the end of the DSRIP period in 2020.
If obstacles to implementation can be overcome, the MRT strategies should serve the triple aim of expanding access, improving quality, and reducing costs. The strategies warrant support and have the potential to yield substantial savings.
Download Report
What Ails Medicaid in New York?Footnotes
- New York State Division of the Budget, FY 2017 Executive Budget Financial Plan Updates for Governor’s Amendments and Forecast Revisions (February 2016), p. 74, www.budget.ny.gov/pubs/executive/eBudget1617/financialPlan/FinPlanUpdated.pdf; New York State Department of Labor, Employment in New York State (December 2015), p. 2, http://labor.ny.gov/stats/PDFs/enys1215.pdf; Diana Rodin and Jack Meyer, Health Care Costs and Spending in New York State (prepared for New York State Health Foundation, February 2014), p. 27, http://nyshealthfoundation.org/uploads/resources/health-care-costs-in-NYS-chart-book.pdf; New York State Division of the Budget, FY 2017 Executive Budget Briefing Book (January 2016), p. 84, www.budget.ny.gov/pubs/executive/eBudget1617/fy1617littlebook/BriefingBook.pdf.
- The Kaiser Commission on Medicaid and the Uninsured, Medicaid - A Primer (Kaiser Family Foundation, March 2013), Table 5: Medicaid Expenditures by Type of Service, FY2011, p. 44, https://kaiserfamilyfoundation.files.wordpress.com/2010/06/7334-05.pdf.
- For earlier analyses of these factors see: Citizens Budget Commission, Medicaid in New York: Why New York’s Program is the Most Expensive in the Nation and What to Do About It (April 2006), www.cbcny.org/sites/default/files/reportsummary_medicaid_04202006.pdf, and No Easy Solution: Effective Medicaid Cost Control Must Focus on the Elderly and Disabled (November 2010), www.cbcny.org/sites/default/files/REPORT_Medicaid_11182010.pdf.
- Kaiser Family Foundation, Medicaid Statistics, "Medicaid Spending per Enrollee (Full or Partial Benefit) FY2011," http://kff.org/medicaid/state-indicator/medicaid-spending-per-enrollee.
- Laura Snyder and others, Medicaid Enrollment: June 2011 Data Snapshot (Kaiser Commission on Medicaid and the Uninsured, June 2012), https://kaiserfamilyfoundation.files.wordpress.com/2013/01/8050-05.pdf; U.S. Census Bureau, "Table 1. Annual Estimates of the Resident Population for the United States, Regions, States, and Puerto Rico: April 1, 2010 to July 1, 2011," www.census.gov/popest/data/historical/2010s/vintage_2011; Alemayehu Bishaw, American Community Survey Briefs - Poverty: 2010 and 2011, Table 1: Number and Percentage of People in Poverty in the Past 12 Months by State and Puerto Rico: 2010 and 2011, ACSBR/11-01 (U.S. Census Bureau, September 2012) p. 3, www.census.gov/prod/2012pubs/acsbr11-01.pdf.
- Alison Mitchell, Medicaid Disproportionate Share Hospital Payments, R42865 (Congressional Research Service, December 2, 2013), pp. 44- 45, www.fas.org/sgp/crs/misc/R42865.pdf.
- Centers for Medicare & Medicaid Services, "Medicaid State Estimates by State of Provider- Personal Health Care” (accessed June 3, 2015), p. 25, www.cms.gov/Research-Statistics-Data-and-Systems/Statistics-Trends-and-Reports/NationalHealthExpendData/Downloads/prov-tables.pdf; Medicaid.gov, Expenditure Reports from MBES/CBES, Financial Management Reports FY 2002-FY2011 and FY2012 through FY2013 (accessed June 3, 2015), http://medicaid.gov/Medicaid-CHIP-Program-Information/By-Topics/Data-and-Systems/MBES/CMS-64-Quarterly-Expense-Report.html; Centers for Medicare & Medicaid Services, "National Health Expenditures by type of service and source of funds CY 1960-2013" (accessed June 3, 2015), www.cms.gov/Research-Statistics-Data-and-Systems/Statistics-Trends-and-Reports/NationalHealthExpendData/NationalHealthAccountsHistorical.html; U.S. Bureau of Economic Analysis, “Government consumption expenditures and gross investment: State and local (implicit price deflator),” https://research.stlouisfed.org/fred2/series/A829RD3A086NBEA.
- Douglas McCarthy and others, Aiming Higher: Results from a State Scorecard on Health System Performance, 2009 (The Commonwealth Fund, October 8, 2009), www.commonwealthfund.org/publications/fund-reports/2009/oct/2009-state-scorecard.
- New York State Department of Health, eQUARR – An Online Report on Managed Care Plans Performance in New York State (September 2010), www.health.ny.gov/health_care/managed_care/reports/eqarr/2010.
- New York State Department of Health, Medicaid Redesign Team Projects Compilation Table Updates (accessed February 10, 2016), www.health.ny.gov/health_care/medicaid/redesign/projects_compilation_table.htm.
- New York State Department of Health, A Plan to Transform the Empire State’s Medicaid Program: Multi-year Action Plan, www.health.ny.gov/health_care/medicaid/redesign/docs/mrtfinalreport.pdf.
- Office of the New York State Comptroller, Office of Budget and Policy Analysis, Medicaid in New York: The Continuing Challenge to Improve Care and Control Costs (March 2015), pp. 17-18, www.osc.state.ny.us/reports/health/medicaid_2015.pdf.
- Office of the New York State Comptroller, Office of Budget and Policy Analysis, Medicaid in New York: The Continuing Challenge to Improve Care and Control Costs (March 2015), p. 18, www.osc.state.ny.us/reports/health/medicaid_2015.pdf.
- New York State Department of Health, 2012 Managed Long-Term Care Report, p. 9, www.health.ny.gov/publications/3391.pdf.
- Medicare is a federally administered and financed program covering acute health care and available to most residents age 65 or over.
- New York State Department of Health, Managed Care for All Transition Timeline (updated September 15, 2015), www.health.ny.gov/health_care/medicaid/redesign/managed_care_trns_dates.htm.
- Elizabeth M. Patchias and Sarah K. L. Samis, New York’s Medicaid in Transition: A New Primer for 2014 (United Hospital Fund, July 2014), p. 38, www.uhfnyc.org/publications/880994.
- New York State Department of Health, “Behavioral Health Transition to Managed Care” (accessed March 21, 2016), www.health.ny.gov/health_care/medicaid/redesign/behavioral_health.
- Elizabeth M. Patchias and Sarah K. L. Samis, New York’s Medicaid in Transition: A New Primer for 2014 (United Hospital Fund, July 2014), pp. 34-35, www.uhfnyc.org/publications/880994.
- Centers for Medicare and Medicaid Services, “CMS and New York State Partner to Coordinate Care for Medicare-Medicaid Enrollees with Intellectual and Developmental Disabilities” (press release, November 5, 2015), www.cms.gov/Newsroom/MediaReleaseDatabase/Press-releases/2015-Press-releases-items/2015-11-05.html.
- Crain’s Health Pulse, “State launches $2 billion coordinated care plan for people with disabilities,” (April 28, 2016).
- Enrollment figures are for December of each year. Mainstream Managed Care Enrollment Figure includes Family Health Plus through 2014. New York State Department of Health, Medicaid Managed Care Enrollment Reports, 2010-2015, www.health.ny.gov/health_care/managed_care/reports/enrollment/monthly.
- Data by eligibility category not shown in figure. New York State Department of Health, Medicaid Managed Care Report (December 2015), www.health.ny.gov/health_care/managed_care/reports/enrollment/monthly/2015/docs/en12_15.pdf, and Medicaid Managed Care Report (December 2010), www.health.ny.gov/health_care/managed_care/reports/enrollment/monthly/2010/docs/en12_10.pdf.
- New York State Department of Health, email to Citizens Budget Commission staff; and New York State Department of Health, "Medicaid Expenditures for Selected Categories of Service by Category of Eligibility - Calendar Year 2014," www.health.ny.gov/statistics/health_care/medicaid/quarterly/aid/2014/cy/expenditures.htm.
- New York State Department of Health, New York State Medicaid Update Special Edition, vol. 28, no. 12, (November 2012), p. 7, www.health.ny.gov/health_care/medicaid/program/update/2012/nov12sped.pdf.
- DSRIP Dashboard, B9 Health Home Enrollment, “Unique Members Enrolled by Current Health Home," dsripdashboards.health.ny.gov/SDM/Publish.aspx?dashboard=DSRIP%20-%20B9%20Health%20Home%20Enrollment&categoryId=0&hideTopBar=true#SID=e929e5baf1c94234a55fa0c8fe299c51.
- Alexandra Gates, Robin Rudowitz, and Jocelyn Guyer, An Overview of Delivery System Reform Incentive Payment (DSRIP) Waivers (Kaiser Commission on Medicaid and the Uninsured, Issue Brief, October 2014), http://kff.org/medicaid/issue-brief/an-overview-of-delivery-system-reform-incentive-payment-waivers; and Jocelyn Guyerand others, Key Themes from Delivery System Reform Incentive Payment (DSRIP) Waivers in 4 States, (Kaiser Commission on Medicaid and the Uninsured, Issue Brief, April 2015), http://kff.org/medicaid/issue-brief/key-themes-from-delivery-system-reform-incentive-payment-dsrip-waivers-in-4-states.
- The waiver also provides $500 million for an Interim Access Assurance Fund available to providers in the short run to prevent deterioration of current access and $1.0 billion for non-DSRIP MRT purposes. Centers for Medicare and Medicaid Services, “Partnership Plan – Approval Period August 1, 2011 – December 31, 2024” (amended April 14, 2014), p. 45, www.health.ny.gov/health_care/medicaid/redesign/docs/special_terms_and_conditions.pdf.
- New York State Department of Health, “DSRIP Final Valuation Overview,” www.health.ny.gov/health_care/medicaid/redesign/dsrip/final_valuation_overview.htm; and New York State Department of Health, “DSRIP Performing Provider Systems (PPS): PPS By County,” www.health.ny.gov/health_care/medicaid/redesign/dsrip/pps_map/index.htm.
- New York State Department of Health, Domain 1 DSRIP Project Requirements Milestones and Metrics (June 18, 2015) p. 2-7, www.health.ny.gov/health_care/medicaid/redesign/dsrip/docs/domain_1_project_requirements_milestones_metrics_6-18-2015.pdf.
- Chad Shearer, Lee Kennedy-Shaffer, and Nathan Myers, Performing Provider System Projects: Tackling the Health Needs of Communities (United Hospital Fund, Medicaid Institute, January 2015), www.uhfnyc.org/publications/881032.
- New York State Office of the Governor, “Governor Cuomo Announces More Than $672 Million in Funding to Strengthen and Improve Health Care in New York City” (press release, March 4, 2016), www.governor.ny.gov/news/governor-cuomo-announces-more-672-million-funding-strengthen-and-improve-health-care-new-york. Separate press releases were issued on the same day for each area listed in the text.
- New York State Department of Health, “IAFF Awards” (accessed March 31, 2016), www.health.ny.gov/health_care/medicaid/redesign/iaaf/iaaf_awards.htm; and New York State Division of the Budget, email to Citizens Budget Commission staff (May 11, 2016).
- New York State Department of Health, Announcement of Availability of Funding, Vital Access Provider Assurance Program (VAPAP) Safety Net Hospitals (accessed March 31, 2016), www.health.ny.gov/health_care/medicaid/redesign/dsrip/vapap/docs/application_instructions_certification.pdf; VAPAP April 2015 – February 2016 Payment Allocation (accessed March 31, 2016), www.health.ny.gov/health_care/medicaid/redesign/dsrip/vapap/april-2015-feb-2016_payment_allocation.htm; and New York State Division of the Budget, email to Citizens Budget Commission staff (May 11, 2016).
- New York State Department of Health, Medicaid Redesign Team, A Path toward Value Based Payment: New York State Roadmap for Medicaid Payment Reform (June 2015), www.health.ny.gov/health_care/medicaid/redesign/dsrip/docs/vbp_roadmap_final.pdf; and Eliot Fishman, Director, State Demonstration Group, Centers for Medicare & Medicaid Services, letter to Jason Helgerson, Director, New York State Medicaid Program (July 22, 2015), www.health.ny.gov/health_care/medicaid/redesign/docs/2015-09-30_temp_ext_amend_cms_approval.pdf.
- New York State Department of Health, Medicaid Redesign Team, A Path toward Value Based Payment: Annual Update (March 2016), www.health.ny.gov/health_care/medicaid/redesign/dsrip/docs/1st_annual_update_nystate_roadmap.pdf.
- New York State Department of Health, Medicaid Redesign Team, A Path toward Value Based Payment: Annual Update (March 2016), p. 60, www.health.ny.gov/health_care/medicaid/redesign/dsrip/docs/readers_guide_vbp_update_2016.pdf.
- The DOH Services spending figure excludes mental health and other services that were not traditionally under DOH’s jurisdiction. Some of these services are now within NYSDOH’s jurisdiction, but the Department continues to report the DOH Services figure in addition to the more inclusive Medicaid Services number. See Medicaid.gov, Medicaid Budget and Expenditure Reports, FY 2003 - 2014, www.medicaid.gov/medicaid-chip-program-information/by-topics/financing-and-reimbursement/expenditure-reports-mbes-cbes.html; New York State Department of Health, email to Citizens Budget Commission staff; and New York State Department of Health, Medicaid Quarterly Reports of Beneficiaries, Expenditures, and Units of Service, 2003 - 2014 https://www.health.ny.gov/statistics/health_care/medicaid/quarterly/aid.
- Elizabeth M. Patchias and Sarah K. L. Samis, New York’s Medicaid in Transition: A New Primer for 2014 (United Hospital Fund, Medicaid Institute, July 2014), p. 7, www.uhfnyc.org/publications/880994.
- New Your State Department of Health, email to Citizens Budget Commission Staff; and New York State Department of Health, Medicaid Quarterly Reports of Beneficiaries, Expenditures, and Units of Service, 2012 – 2014, https://www.health.ny.gov/statistics/health_care/medicaid/quarterly/aid. Data for all years except 2015 are annual averages of monthly enrollment; 2015 is enrollment for October 2015. Data for 2014 are authors’ estimates based on average ratio of Medicaid beneficiaries to enrollees for 2012 and 2013 from New York State Department of Health, Medicaid Quarterly Reports of Beneficiaries, Expenditures, and Units of Service, 2012 – 2014, www.health.ny.gov/statistics/health_care/medicaid/quarterly/aid/. Adult enrollment figures include Family Health Plus.
- New Your State Department of Health, email to Citizens Budget Commission Staff; and New York State Department of Health, Medicaid Quarterly Reports of Beneficiaries, Expenditures, and Units of Service, 2003-2014, www.health.ny.gov/statistics/health_care/medicaid/quarterly/aid. Data for all years except 2015 are annual averages of monthly enrollment; 2015 is enrollment for October 2015. Data for 2014 is estimated based on average ratio of Medicaid beneficiaries to enrollees for 2012 and 2013. Adult enrollment figures include Family Health Plus.
- Centers for Medicare & Medicaid Services, “National Health Expenditure Accounts” (accessed June 3, 2015), www.cms.gov/Research-Statistics-Data-and-Systems/Statistics-Trends-and-Reports/NationalHealthExpendData/NationalHealthAccountsHistorical.html.
- New York State Division of the Budget, New York State FY 2016 Executive Budget Financial Plan, pp. 43-44, www.budget.ny.gov/pubs/executive/eBudget1617/financialPlan/FinPlan.pdf.
- Douglas McCarthy, David C. Radley, and Susan Hayes, Aiming Higher: Results from a Scorecard on State Health System Performance, 2015 edition (Commonwealth Fund, December 2015), www.commonwealthfund.org/~/media/files/publications/fund-report/2015/dec/2015_scorecard_v5.pdf.
- Congressional Budget Office, “Detail of Spending and Enrollment for Medicaid for CBO’s March 2016 Baseline” (March 2016), www.cbo.gov/sites/default/files/51301-2016-03-Medicaid.pdf.
- New York State Division of the Budget , FY 2016 Midyear Update (November 2015), p. 76, www.budget.ny.gov/pubs/archive/fy1516archive/enacted1516/FY2016FPMidYear.pdf; and Office of the New York State Comptroller, Medicaid in New York: The Continuing Challenge to Improve Care and Control Costs (March 2015), p. 15, www.osc.state.ny.us/reports/health/medicaid_2015.pdf.
- U.S. Bureau of Labor Statistics, Consumer Price Index Detailed Reports, 2004-2015, www.bls.gov/cpi/cpi_dr.htm#2005.
- New York State Division of the Budget, FY 2017 Executive Budget Financial Plan Updates for Governor’s Amendments and Forecast Revisions, p. 83, www.budget.ny.gov/pubs/executive/eBudget1617/financialPlan/FinPlanUpdated.pdf.
- For example, the February 2016 Global Spending Cap Report notes that Office of Health Insurance Programs State Operations costs were included in the cap and that annual growth of $779 million over 2015 includes costs associated with price and enrollment increases, offset by a net change in one-time revenue and spending actions. See: New York State Department of Health, Medicaid Global Spending Cap Report (February 2016), p. 2, www.health.ny.gov/health_care/medicaid/regulations/global_cap/monthly/sfy_2015-2016/docs/february_2016_report.pdf.
- Centers for Medicare & Medicaid Services, New York State Medicaid Redesign Special Terms and Conditions (as amended April 14, 2014), pp. 66-67, www.health.ny.gov/health_care/medicaid/redesign/docs/special_terms_and_conditions.pdf.
- Total excludes spending for administration and DHS. New York State Division of the Budget, email to Citizens Budget Commission staff (May 13, 2016).
- Michael Sparer, “Medicaid Managed Care: Costs, Access and Quality of Care” (Robert Wood Johnson Foundation, The Synthesis Project , September 2013), www.rwjf.org/en/library/research/2012/09/medicaid-managed-care.html; Academy Health, “Evidence Roadmap: Medicaid Managed Care” (July 2015), www.academyhealth.org/files/FileDownloads/AH_Evidence%20Roadmap11%20v3.pdf; and Douglas McCarthy, Jamie Ryan, and Sarah Klein, “Models of Care for High-Need, High-Cost Patients: An Evidence Synthesis” (The Commonwealth Fund, Issue Brief, October 2015), www.commonwealthfund.org/~/media/files/publications/issue-brief/2015/oct/1843_mccarthy_models_care_high_need_high_cost_patients_ib.pdf.
- The Lewin Group, “An Evaluation of Medicaid Savings from Pennsylvania’s HealthChoices Program” (May 2011), www.lewin.com/content/dam/Lewin/Resources/Site_Sections/Publications/MedicaidSavingsPAHealthChoices.pdf, “Projected Impacts of Adopting a Pharmacy Carve-In Approach Within Medicaid Capitation Programs” (January 2011), www.mhpa.org/_upload/MHPAPaperPharmacyCarve-In.pdf, “Medicaid Managed Care Cost Savings: A Synthesis of 24 Studies” (Updated March 2009), http://thehill.com/images/stories/blogs/ahipcostsavings.pdf; James Verdier and others, “SoonerCare 1115 Waiver Evaluation Final Report” (Mathematica Policy Research, Inc., January 2009), www.chcs.org/media/6492_SoonerCare_Report_-_Final_-_January_20091.pdf.
- Mark Duggan and Tamara Hayford, “Has the Shift to Managed Care Reduced Medicaid Expenditures? Evidence from State and Local-Level Mandates,” NBER Working Paper No. 17236 (July 2011), www.nber.org/papers/w17236; J. Holahan and others, “Medicaid Managed Care in Thirteen States” Health Affairs, vol. 17, no. 3 (May 1998), pp. 43-63, http://content.healthaffairs.org/content/17/3/43.full.pdf+html.
- Kenneth E. Thorpe, “Estimated Federal Savings Associated With Care Coordination Models for Medicare-Medicaid Dual Eligibles” (America’s Health Insurance Plans, September 2011), www.ahipcoverage.com/wp-content/uploads/2011/09/Dual-Eligible-Study-September-2011.pdf, and “Building Evidence-Based Interventions to Avert Disease and Reduce Health Care Spending” (unpublished, November 2011), www.fightchronicdisease.org/sites/default/files/docs/Thorpe%20-%20Care%20Coord%20Savings%20-%20Final-1.pdf.
- New York State Department of Health, A Plan to Transform the Empire State’s Medicaid Program (2012), p. 10, www.health.ny.gov/health_care/medicaid/redesign/docs/mrtfinalreport.pdf.
- Centers for Medicare & Medicaid Services, “CMS and New York Partner to Coordinate Care for Medicare-Medicaid Enrollees” (press release, August 26, 2013), www.cms.gov/Newsroom/MediaReleaseDatabase/Press-releases/2015-Press-releases-items/2015-11-05.html; and Crain’s Health Pulse, “More Managed-Long-Term Care Plans to Leave the Market?” (January 15, 2016).
- Dan Goldberg, “FIDA Rules Change, State Suspends Passive Enrollment,” POLITICO New York Pro (December 10, 2015), www.capitalnewyork.com/article/albany/2015/12/8585221/fida-rules-change-state-suspends-passive-enrollment.
- Centers for Medicare & Medicaid Services, “CMS and New York State Partner to Coordinate Care for Medicare-Medicaid Enrollees with Intellectual and Developmental Disabilities” (press release, November 5, 2015), www.cms.gov/Newsroom/MediaReleaseDatabase/Press-releases/2015-Press-releases-items/2015-11-05.html; and Robert Megna, Director, New York State Division of the Budget, “Update on Medicaid Budget” (presentation), p. 51. The presentation indicates 50,000 people with developmental disabilities account for $6.4 billion in Medicaid spending in an unspecified fiscal year.
- New York State Office for People with Developmental Disabilities, Raising expectations, Changing Lives (February 2016), www.opwdd.ny.gov/sites/default/files/documents/TransformationPanelReport-RaisingExpectationsChangingLives.pdf.
- Elizabeth Patchias, Andrew Detty, and Michael Birnbaum, Implementing Medicaid Health Homes in New York: Early Experience (United Hospital Fund, 2013), https://www.uhfnyc.org/publications/880881; and Joslyn Levy and Associates, Care Management in New York State Health Homes (New York State Health Foundation, August 2014), http://nyshealthfoundation.org/uploads/resources/care-management-new-york-state-health-homes-aug-2014.pdf.
- Barbara Benson, “New York City Hospitals Hit up State, Feds for Another $1 billion,” Crain’s New York Business (May 20, 2015), www.crainsnewyork.com/article/20150520/HEALTH_CARE/150529984/new-york-city-hospitals-hit-up-state-feds-for-another-1-billion.
- New York State Department of Health, “Certificate of Public Advantage Summaries of Applications,” www.health.ny.gov/health_care/medicaid/redesign/copa/docs/copa_application_summaries.pdf
- U.S. Federal Trade Commission, letter to New York State Department of Health “Certificate of Public Advantage Applications Filed Pursuant to New York Public Health Law, 10 NYCRR, Subpart 83-1” (April 22, 2015), www.ftc.gov/system/files/documents/advocacy_documents/ftc-staff-comment-center-health-care-policy-resource-development-office-primary-care-health-systems/150422newyorkhealth.pdf
- Crain’s Health Pulse, “Medicaid Panel Gets a Progress Report on DSRIP” (January 22, 2016), www.crainsnewyork.com/article/20160122/PULSE/160129964/medicaid-panel-gets-a-progress-report-on-dsrip.
- Peter Newell, Chad Shearer, and Nikhita Thaper, Setting the Stage for Payment Reform: Updating New York’s Regulations on Risk Transfers Between Health Plans and Providers (United Hospital Fund, November 2015), http://nyshealthfoundation.org/uploads/resources/setting-the-stage-for-payment-reform-nov-2015.pdf