Where Is the Money Going?
Mayor de Blasio's Spending Priorities
The Mayor and the City Council, elected in 2013, have modified the budget for fiscal year 2014, adopted new budgets for fiscal years 2015 and 2016, and are in the process of adopting a third budget for fiscal year 2017. The Mayor’s Executive Budget for Fiscal Year 2017, released in April, includes a Financial Plan that extends through fiscal year 2020. The actions and plans for this nearly eight-year period provide an appropriate basis for assessing the current administration’s priorities and fiscal policies.
Since the Mayor and Council members took office in January 2014, employment in the city has grown by 249,000 positions, or 6.1 percent, to reach a record high total of 4.3 million in April 2016, and the Financial Plan assumes employment will expand by another 200,000 through 2020.1 The local economy is already in its 82nd month of expansion since the Great Recession and would be at an unprecedented 132 months of expansion at the end of the Financial Plan period.2 This economic growth has provided new revenue to support expenditure increases; how has the de Blasio Administration used these growing resources and what are the plans for the rest of the financial plan period? 3
This policy brief analyzes spending growth under Mayor de Blasio using the fiscal year 2014 spending planned in the November 2013 Financial Plan, the last prepared by Mayor Bloomberg, as a starting point. The increase in spending planned through fiscal year 2020 is identified, compared to spending growth under Mayor Bloomberg, and analyzed in terms of the objects of expenditure (personnel costs versus other items such as debt service) and the agencies allocated the funds.
The Pace of Expenditure Growth
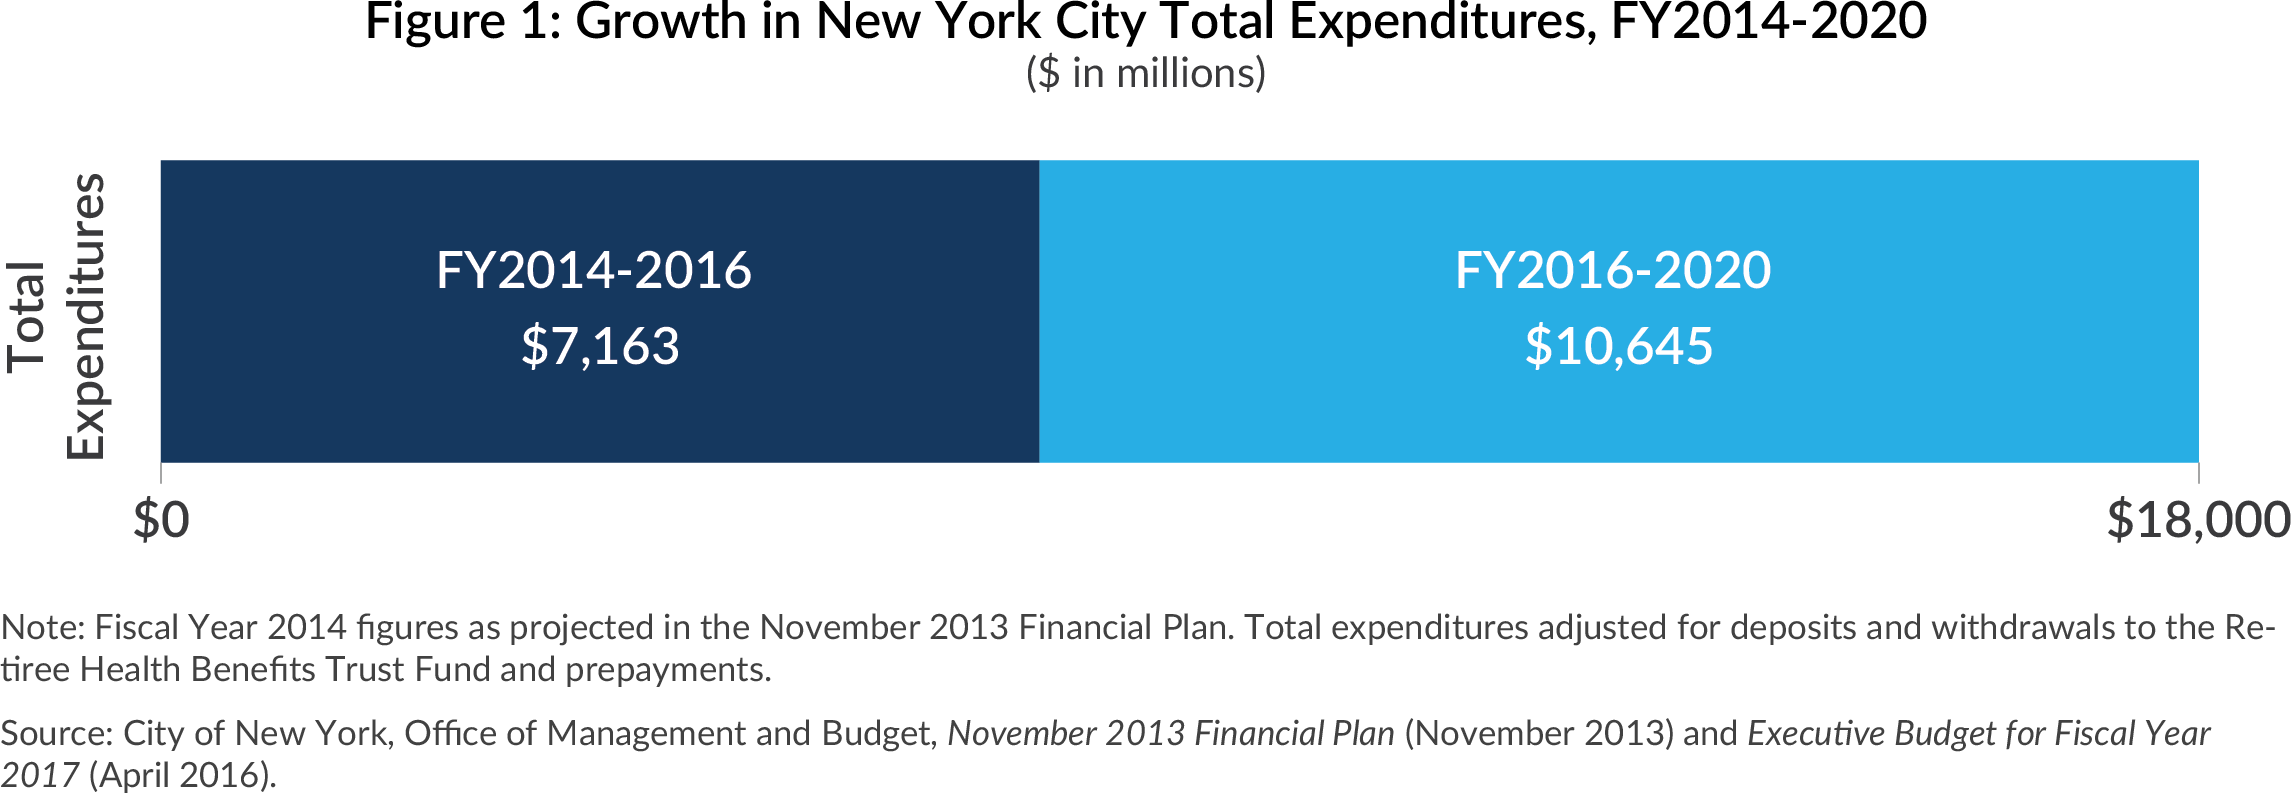
From the time Mayor Bloomberg left office to the current fiscal year, Mayor de Blasio has increased total expenditures $7.2 billion or 9.6 percent; the planned increase to fiscal year 2020 is nearly $17.8 billion or 24 percent.4 How does this pace of growth compare to expenditure trends under Mayor Bloomberg?
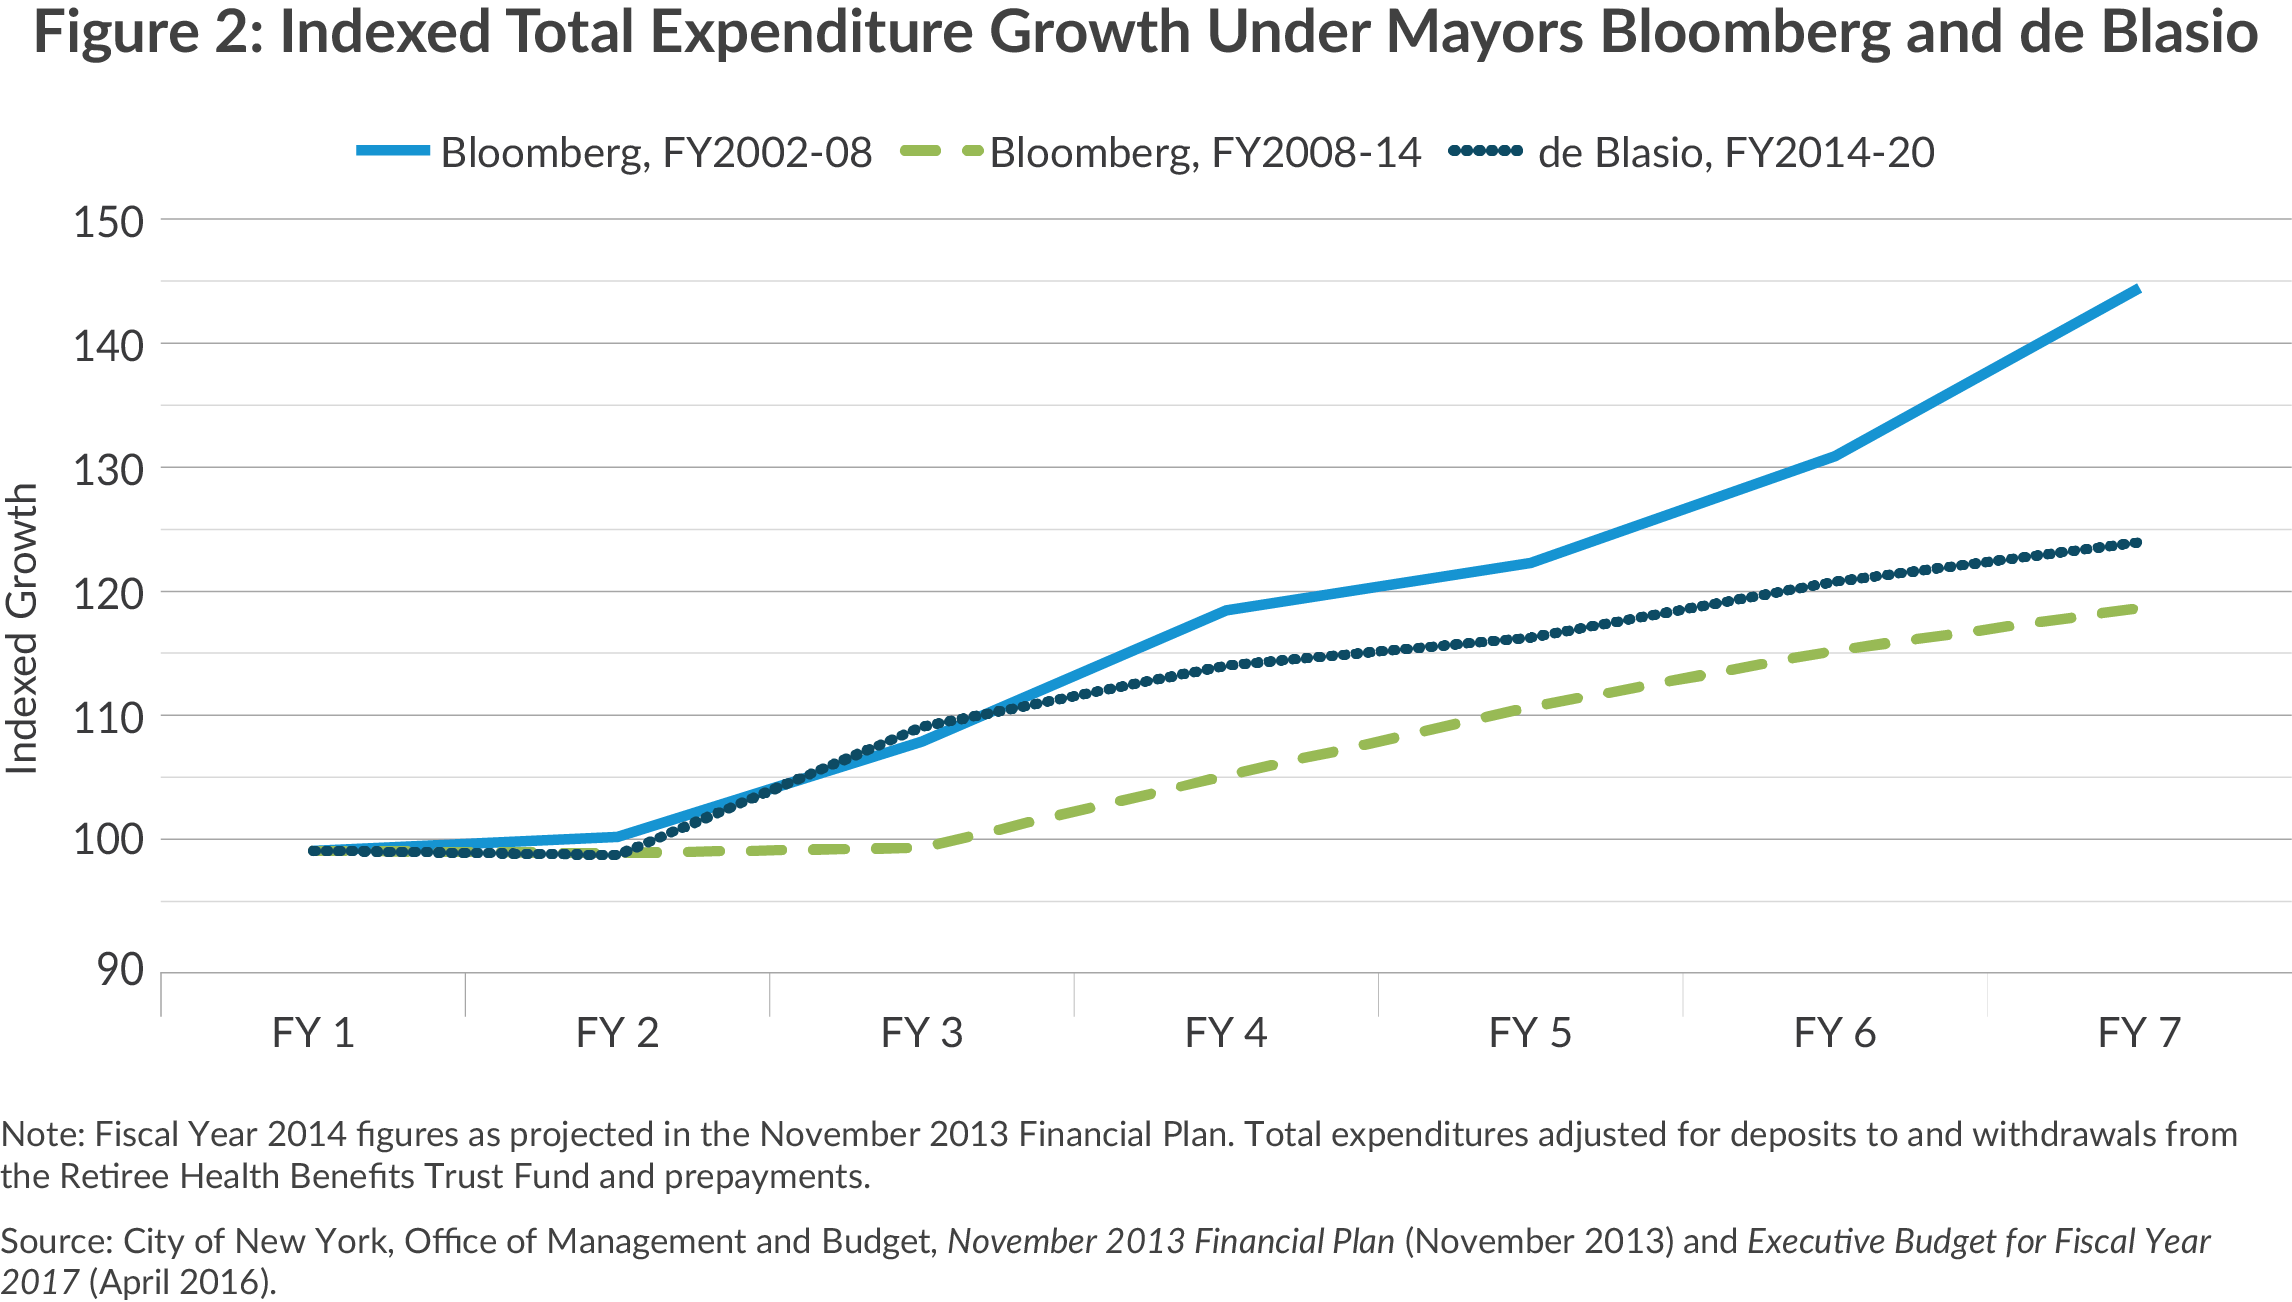
Mayor Bloomberg’s 12-year tenure as mayor spanned a period of economic growth after the 2001 recession and a less prosperous period during and after the Great Recession of 2008. The 7-year period spanning Mayor de Blasio’s past budgets and financial plan is compared to both the first seven years (fiscal years 2002 to 2009) and the last seven years (fiscal years 2007 to 2014) under Mayor Bloomberg.5 As shown in Figure 2, the 24 percent increase by the current administration is greater than the 19 percent increase in Bloomberg’s later years, but well below the 44 percent increase in Bloomberg’s initial seven years when the local economy was doing well.
Priorities by Object of Expenditure
Budget analysts categorize spending in two ways – by object and by agency. This brief considers both perspectives, beginning with an analysis by object. The broad categories are (1) personal service (PS), which includes salaries and fringe benefits, and (2) other than personal service (OTPS) items, including debt service, reserves, subsidies to independent entities, and a variety of other items including contracts and supplies.
Figure 3 shows the distribution of the $17.9 billion planned spending increase from 2014 to 2020 among the major objects of expenditure. PS is the largest category, accounting for nearly two-thirds of the increase, or $11.7 billion. PS spending increases 29.6 percent, somewhat faster than total spending growth of 24 percent.
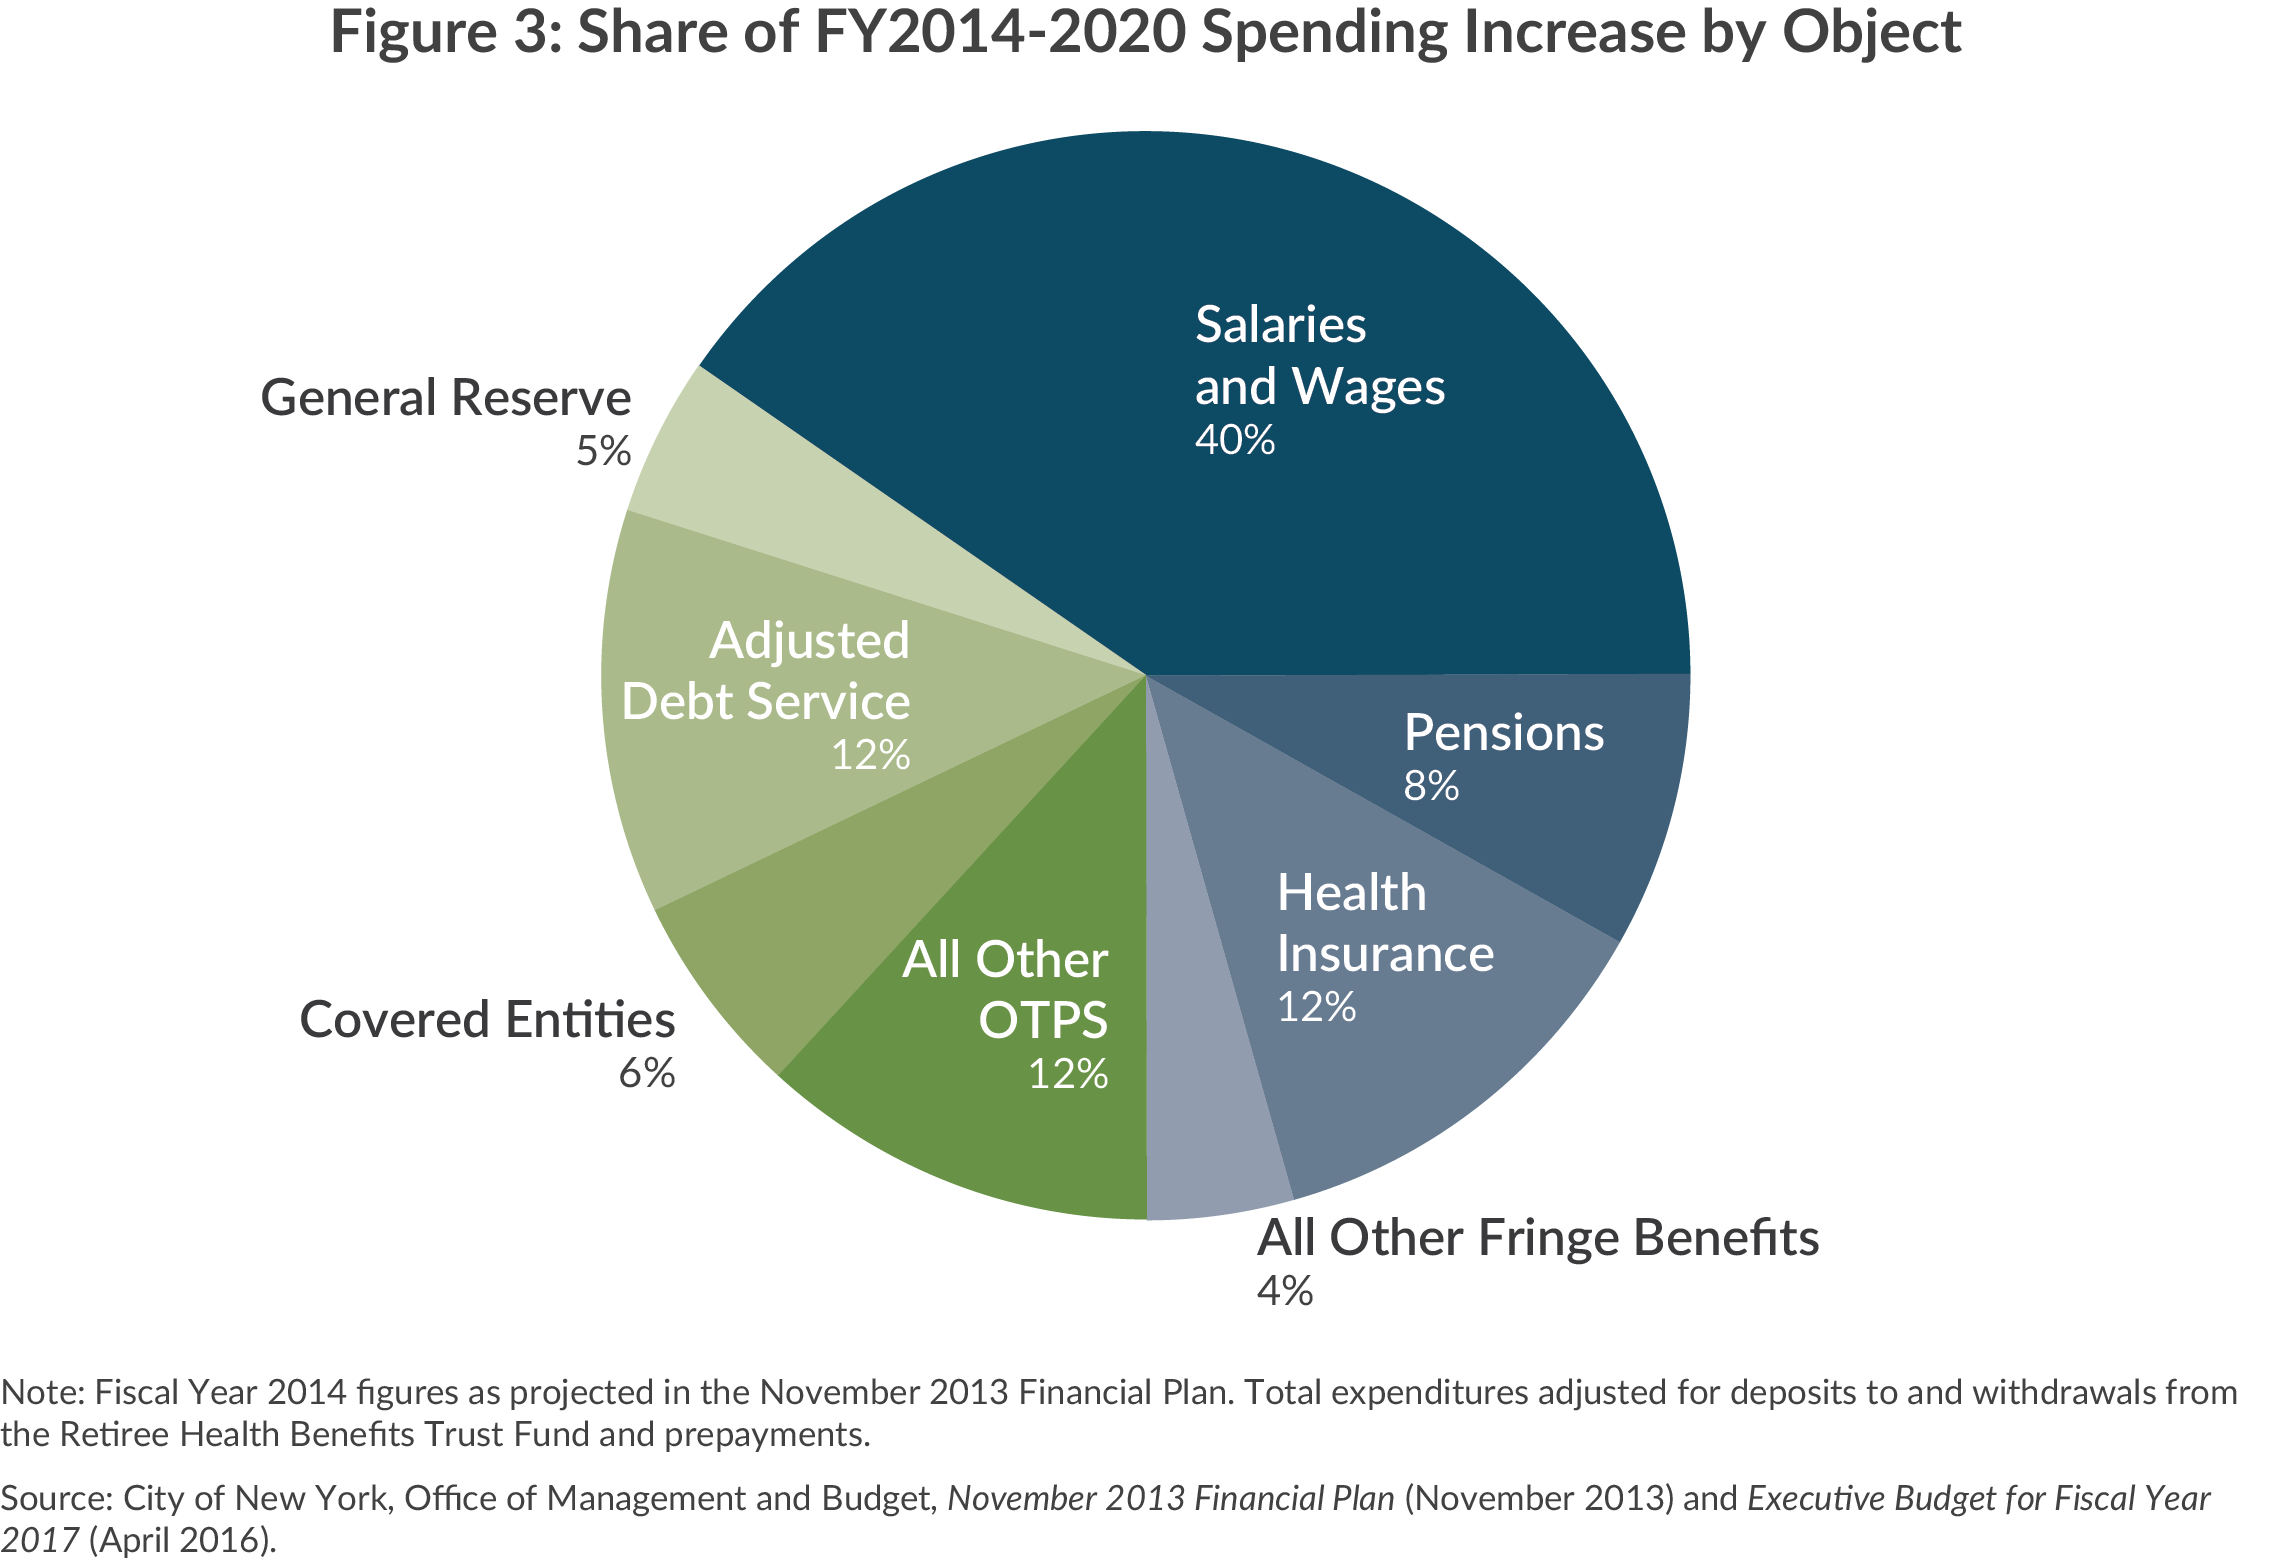
Within the PS category, health insurance spending is the fastest growing item, increasing more than 41 percent or $2.2 billion; moreover, this increase assumes successful implementation of $1.3 billion in annual savings in fiscal year 2020 from current collective bargaining agreements.6 Pension fund contributions will increase more slowly, by 18 percent or nearly $1.5 billion; the added obligations result primarily from adjustments recognizing greater longevity among retirees and adjustments in subsequent years for lower than assumed investment returns in fiscal year 2015. It should be noted the increases assume the pension funds will meet their 7 percent investment target this year and in subsequent years.
Most of the increase in total PS is in salaries and wages. While the number of employees is largely determined in the budget process, salaries and wages are set in collective bargaining. Much of the 2014 to 2020 period is covered by seven-year contracts giving workers raises ranging between 0 and 3 percent annually.7 For the years after these contracts expire, the Financial Plan assumes wage increases of 1 percent.8 Spending on salaries and wages will grow by one-third between fiscal years 2014 and 2020.9
Most of the planned $11.7 billion increase in PS spending is attributable to higher compensation per employee and a smaller portion to increased headcount. The municipal workforce will increase by 23,197 to 323,831 between fiscal years 2014 and 2020 with the bulk of the increase (19,927) having taken place between fiscal years 2014 and 2016.
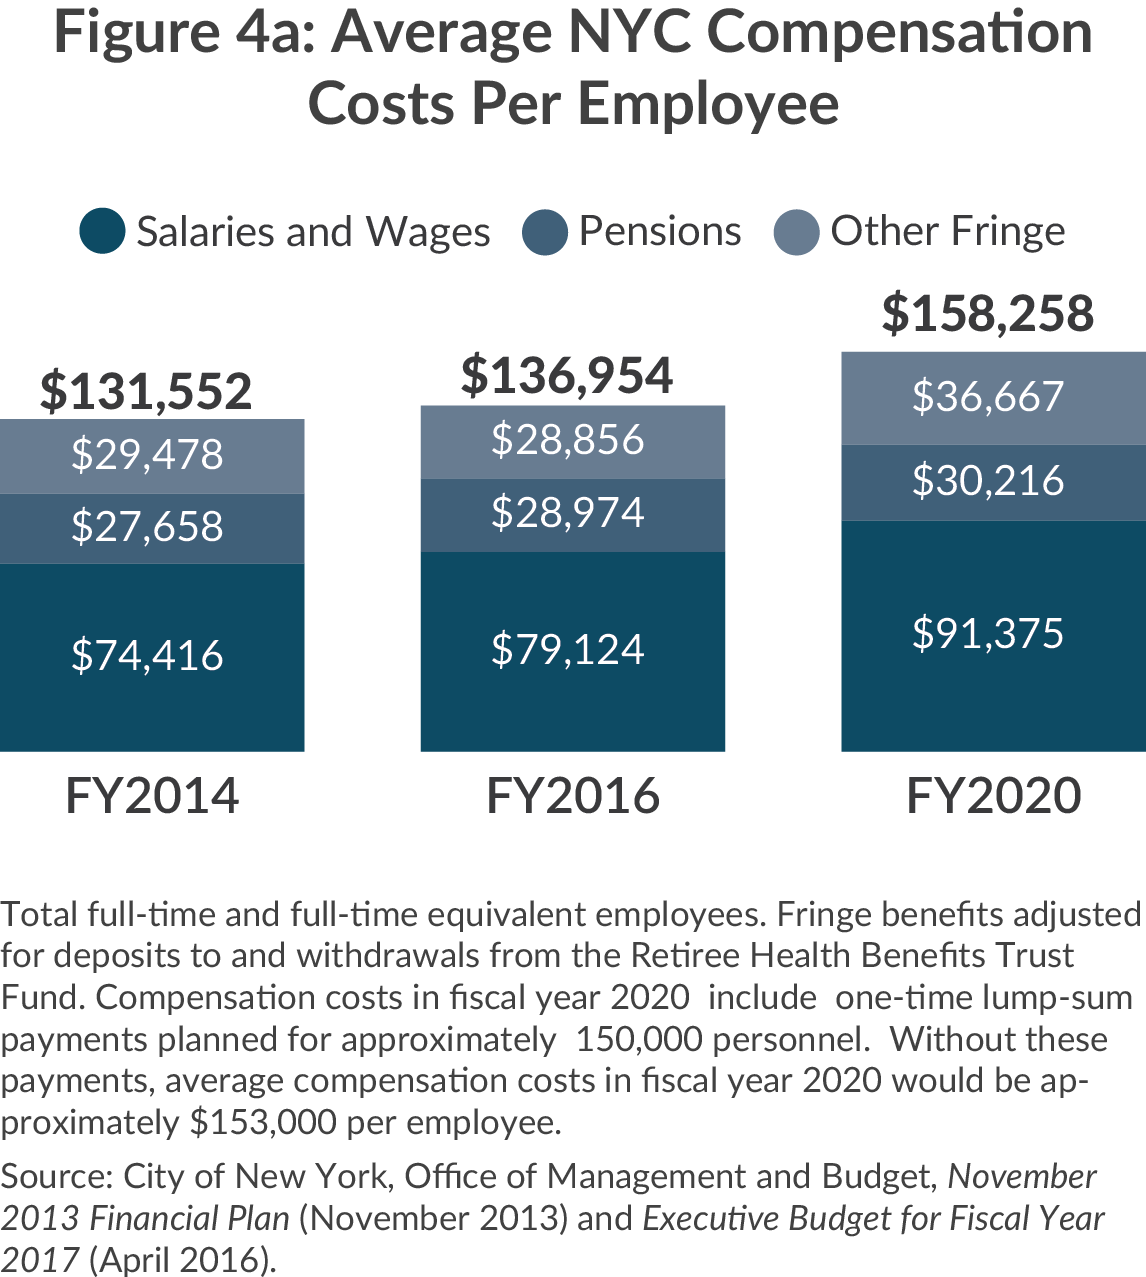
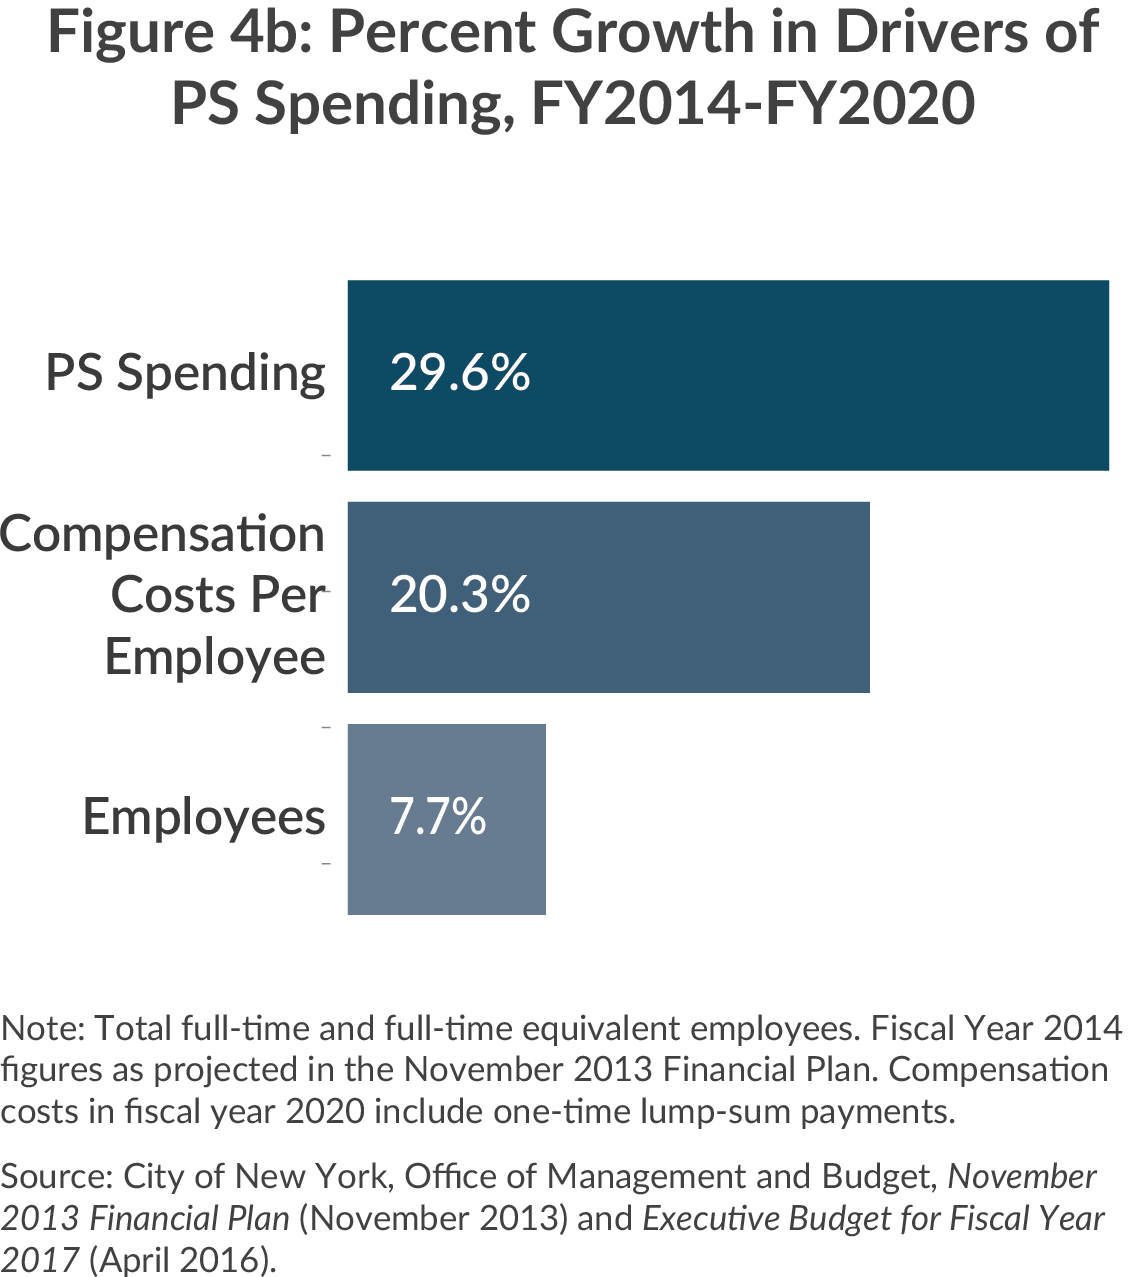
The more powerful factor is rising employee compensation. Between fiscal years 2014 and 2020 compensation cost per employee increases $26,706 or more than 20 percent to reach $158,258. 10 Most of the increase ($16,959) is in salary and wages, which grow nearly 23 percent, but fringe benefits, including health insurance, increase $7,190 or 24 percent per employee and pension contributions increase $2,558 or 9 percent.
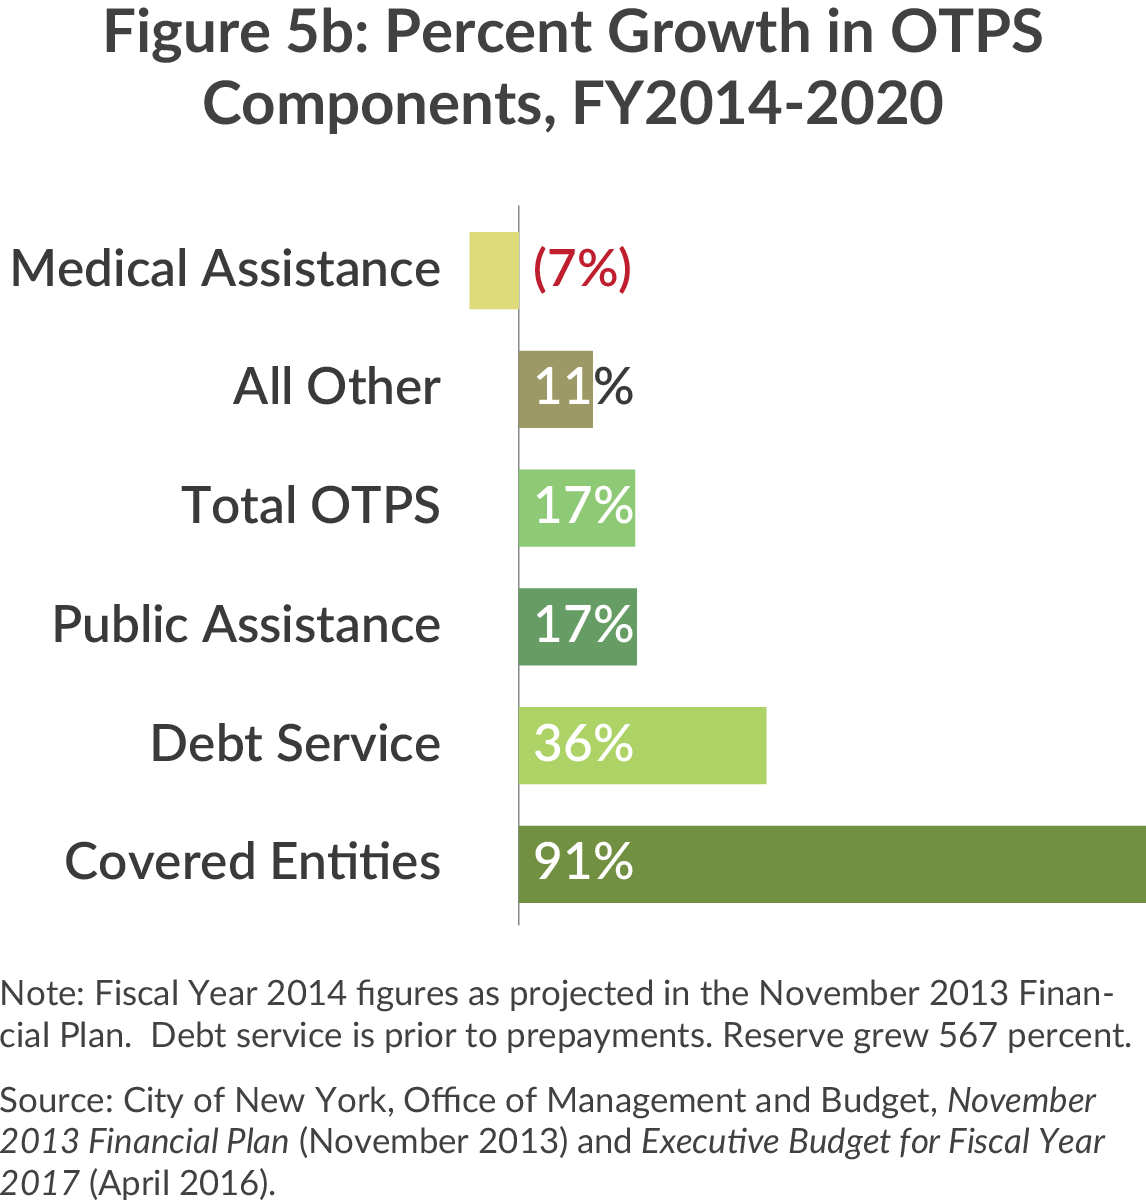
Among the major types of OTPS items, the fastest growing (91 percent) is subsidies to independent agencies, mostly New York Health + Hospitals. Debt service is also growing rapidly; it increases nearly $2.2 billion, or 36 percent, to reach nearly $8.2 billion in fiscal year 2020.
Debt service is driven by plans to significantly increase the level of capital investments, which are financed by borrowing. The capital commitment plan requires $32.9 billion in new tax-backed borrowing between fiscal years 2016 and 2020, creating a total of $85.2 billion in outstanding City debt at the end of fiscal year 2020.11
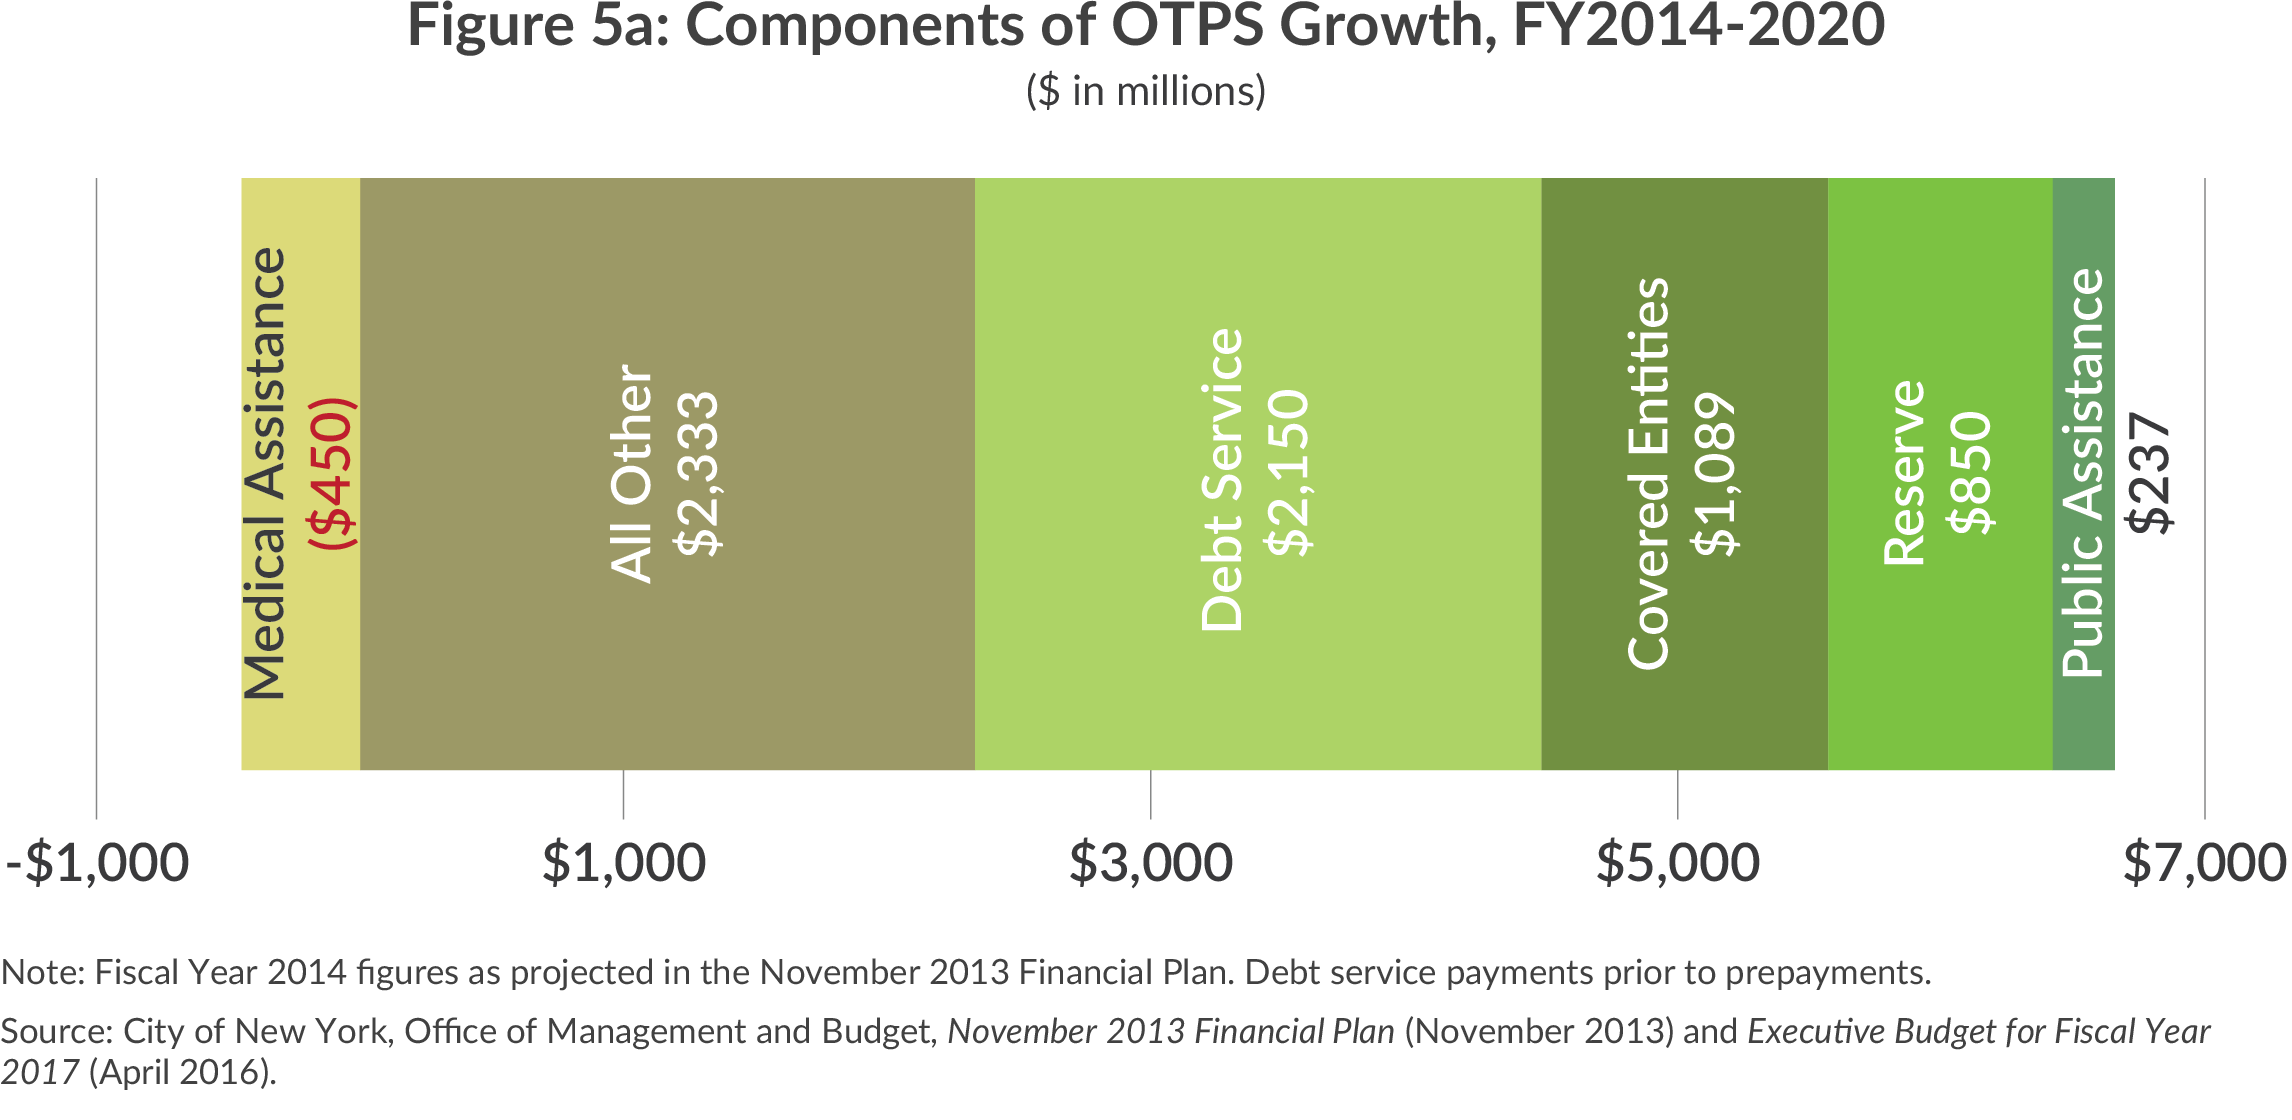
Smaller components of the OTPS growth are public assistance, which will grow by $237 million during this period, and reserves, which will rise by $850 million. The increase in public assistance costs is based on expected growth in the caseload of 15.5 percent.12 (Both the Independent Budget Office and the Office of the New York City Comptroller conclude this is a realistic caseload projection.13) Mayor Bloomberg reduced the general reserve from $300 million to $150 million in fiscal year 2014; Mayor de Blasio has increased the reserve to $1.0 billion annually.14 While this is a major positive change in policy, the $850 million increment is a modest 4.8 percent of the total planned increase is spending.
The remaining OTPS spending increases $3.4 billion or 15.7 percent to reach $24.1 billion by 2020. One large component that does not grow is the City’s payment to the State for the local share of Medicaid; the State froze growth in local Medicaid costs in 2015 and efforts in this year’s state budget negotiations to increase these costs for New York City were not successful. The City expects this cost to decline $450 million or 7.1 percent to $5.9 billion in fiscal year 2020.
Priorities by Agency
Analyzing expenditure changes by agency provides another perspective on the Administration’s priorities. In analyzing spending by agency the scope of expenditures is narrowed from the prior analysis. First, state and federal categorical grants are excluded, since these funds are not controlled in the annual budget process. Second, centrally allocated and budgeted costs, such as fringe benefits and debt service, are excluded. After these funds are excluded, the agency spending increase between fiscal years 2014 and 2020 is $5.6 billion, only 35 percent of the total City-funded increase of $15.8 billion.
Agencies with Large City-Funded Increases
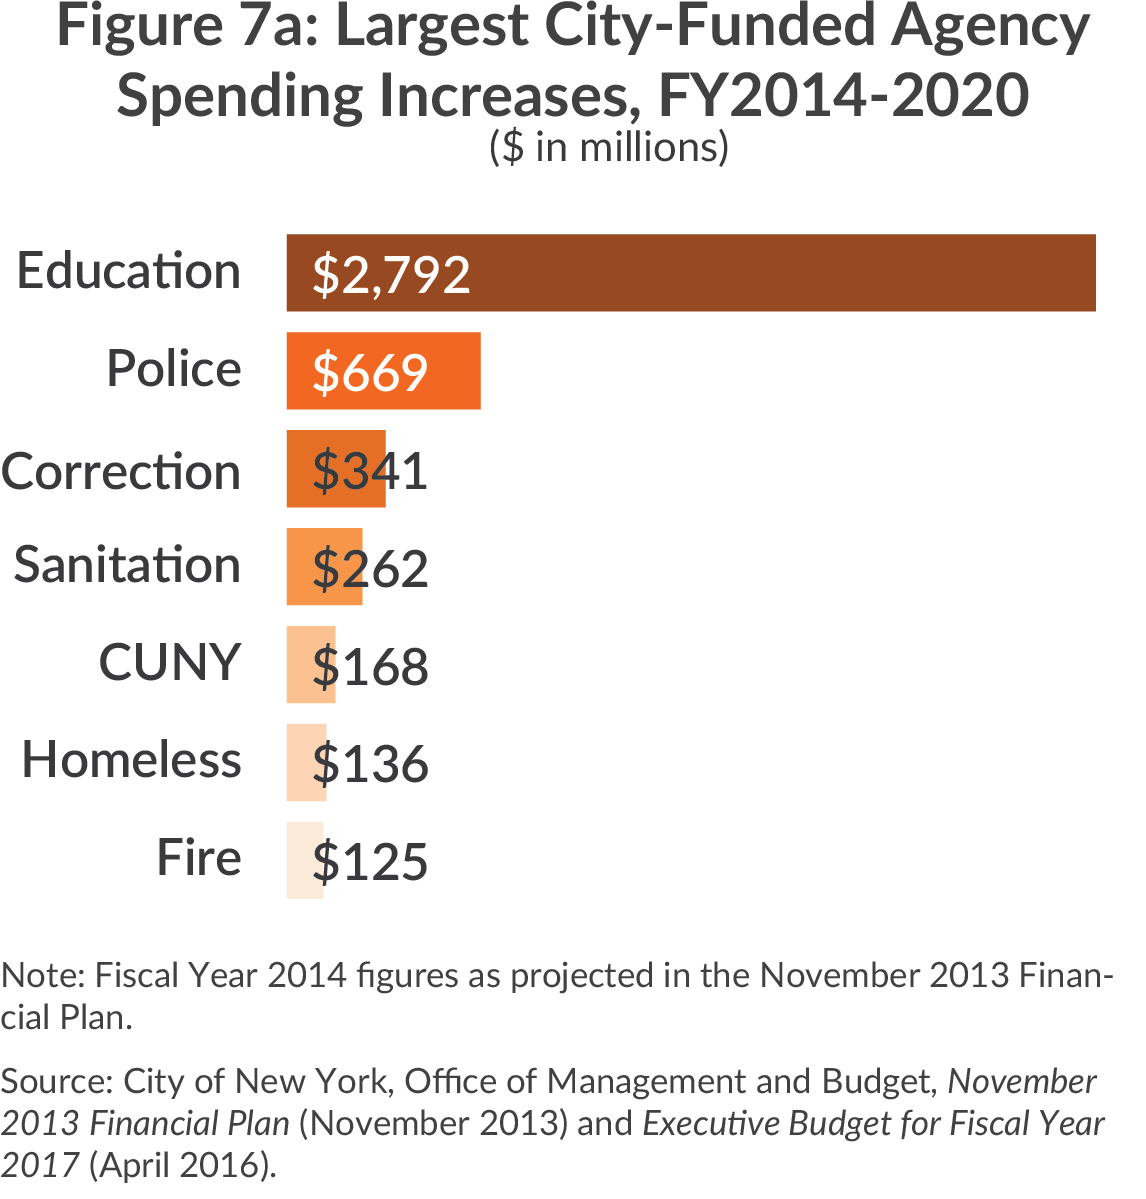
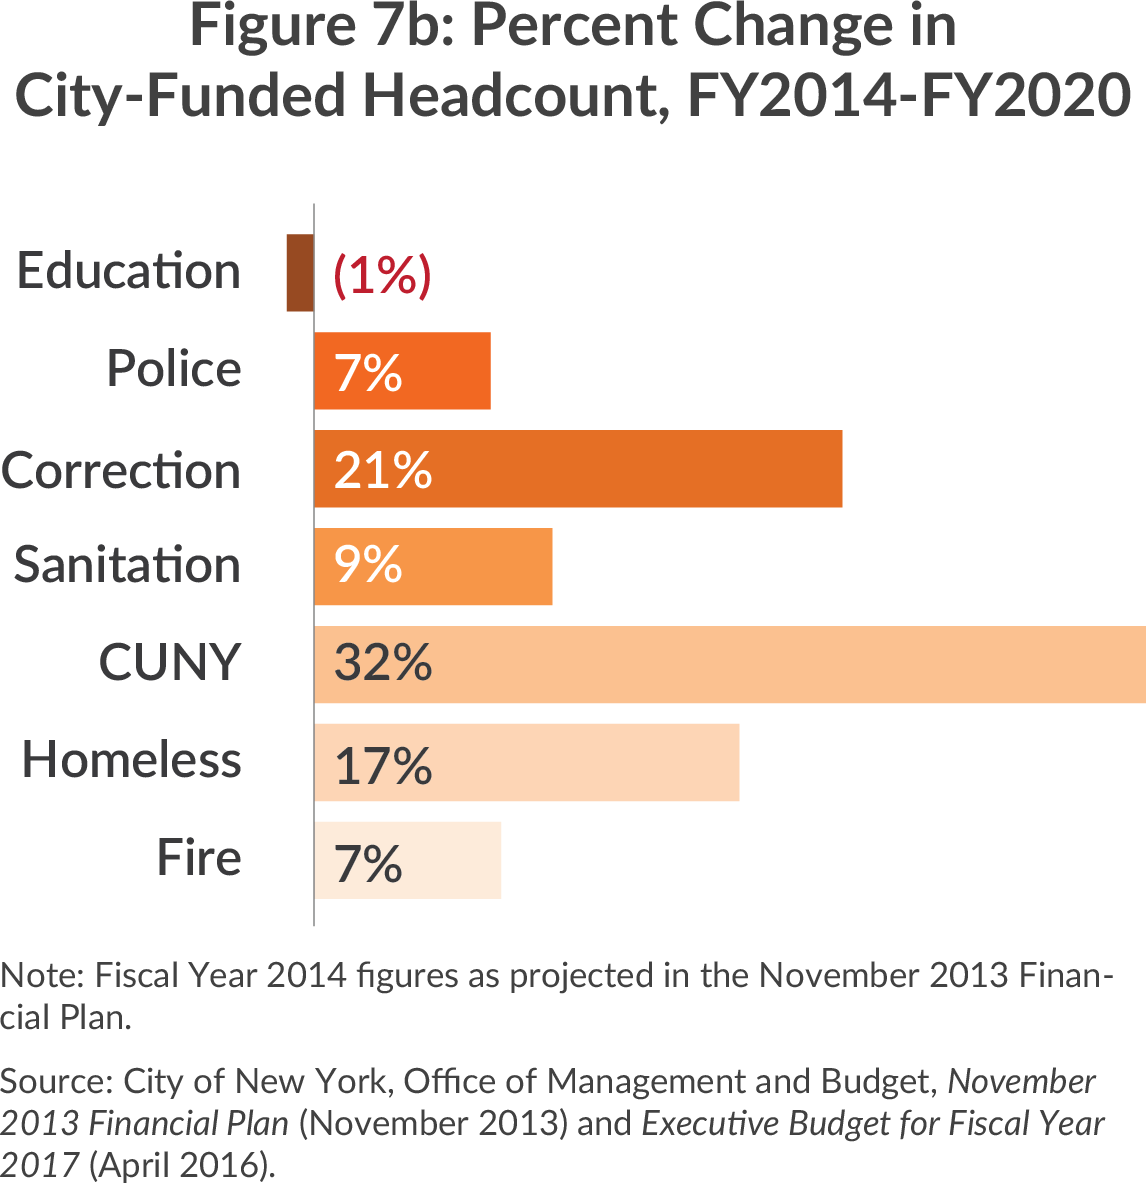
Of the $5.6 billion planned increase in agency expenditures four-fifths is accounted for by just 7 of the City’s 72 agencies, each with over $125 million in expenditure increases. (See Figure 6.) The Department of Education (DOE) alone accounts for half of the increase, or nearly $2.8 billion. A significant portion of the increase is related to programmatic initiatives, such as Universal Pre-K (costing $863 million annually, of which $112 million is funded by the City), Universal Literacy, and broader availability of Advanced Placement courses. These initiatives require added staffing, and the DOE’s total headcount will increase 8,210 or 6.1 percent between fiscal years 2014 and 2020. However, much of this staff expansion is related to Universal Pre-K and is backed by increased state and federal aid; City-funded headcount actually declines 1,215. Thus the 30 percent increase in City funds to DOE is related to increased compensation.
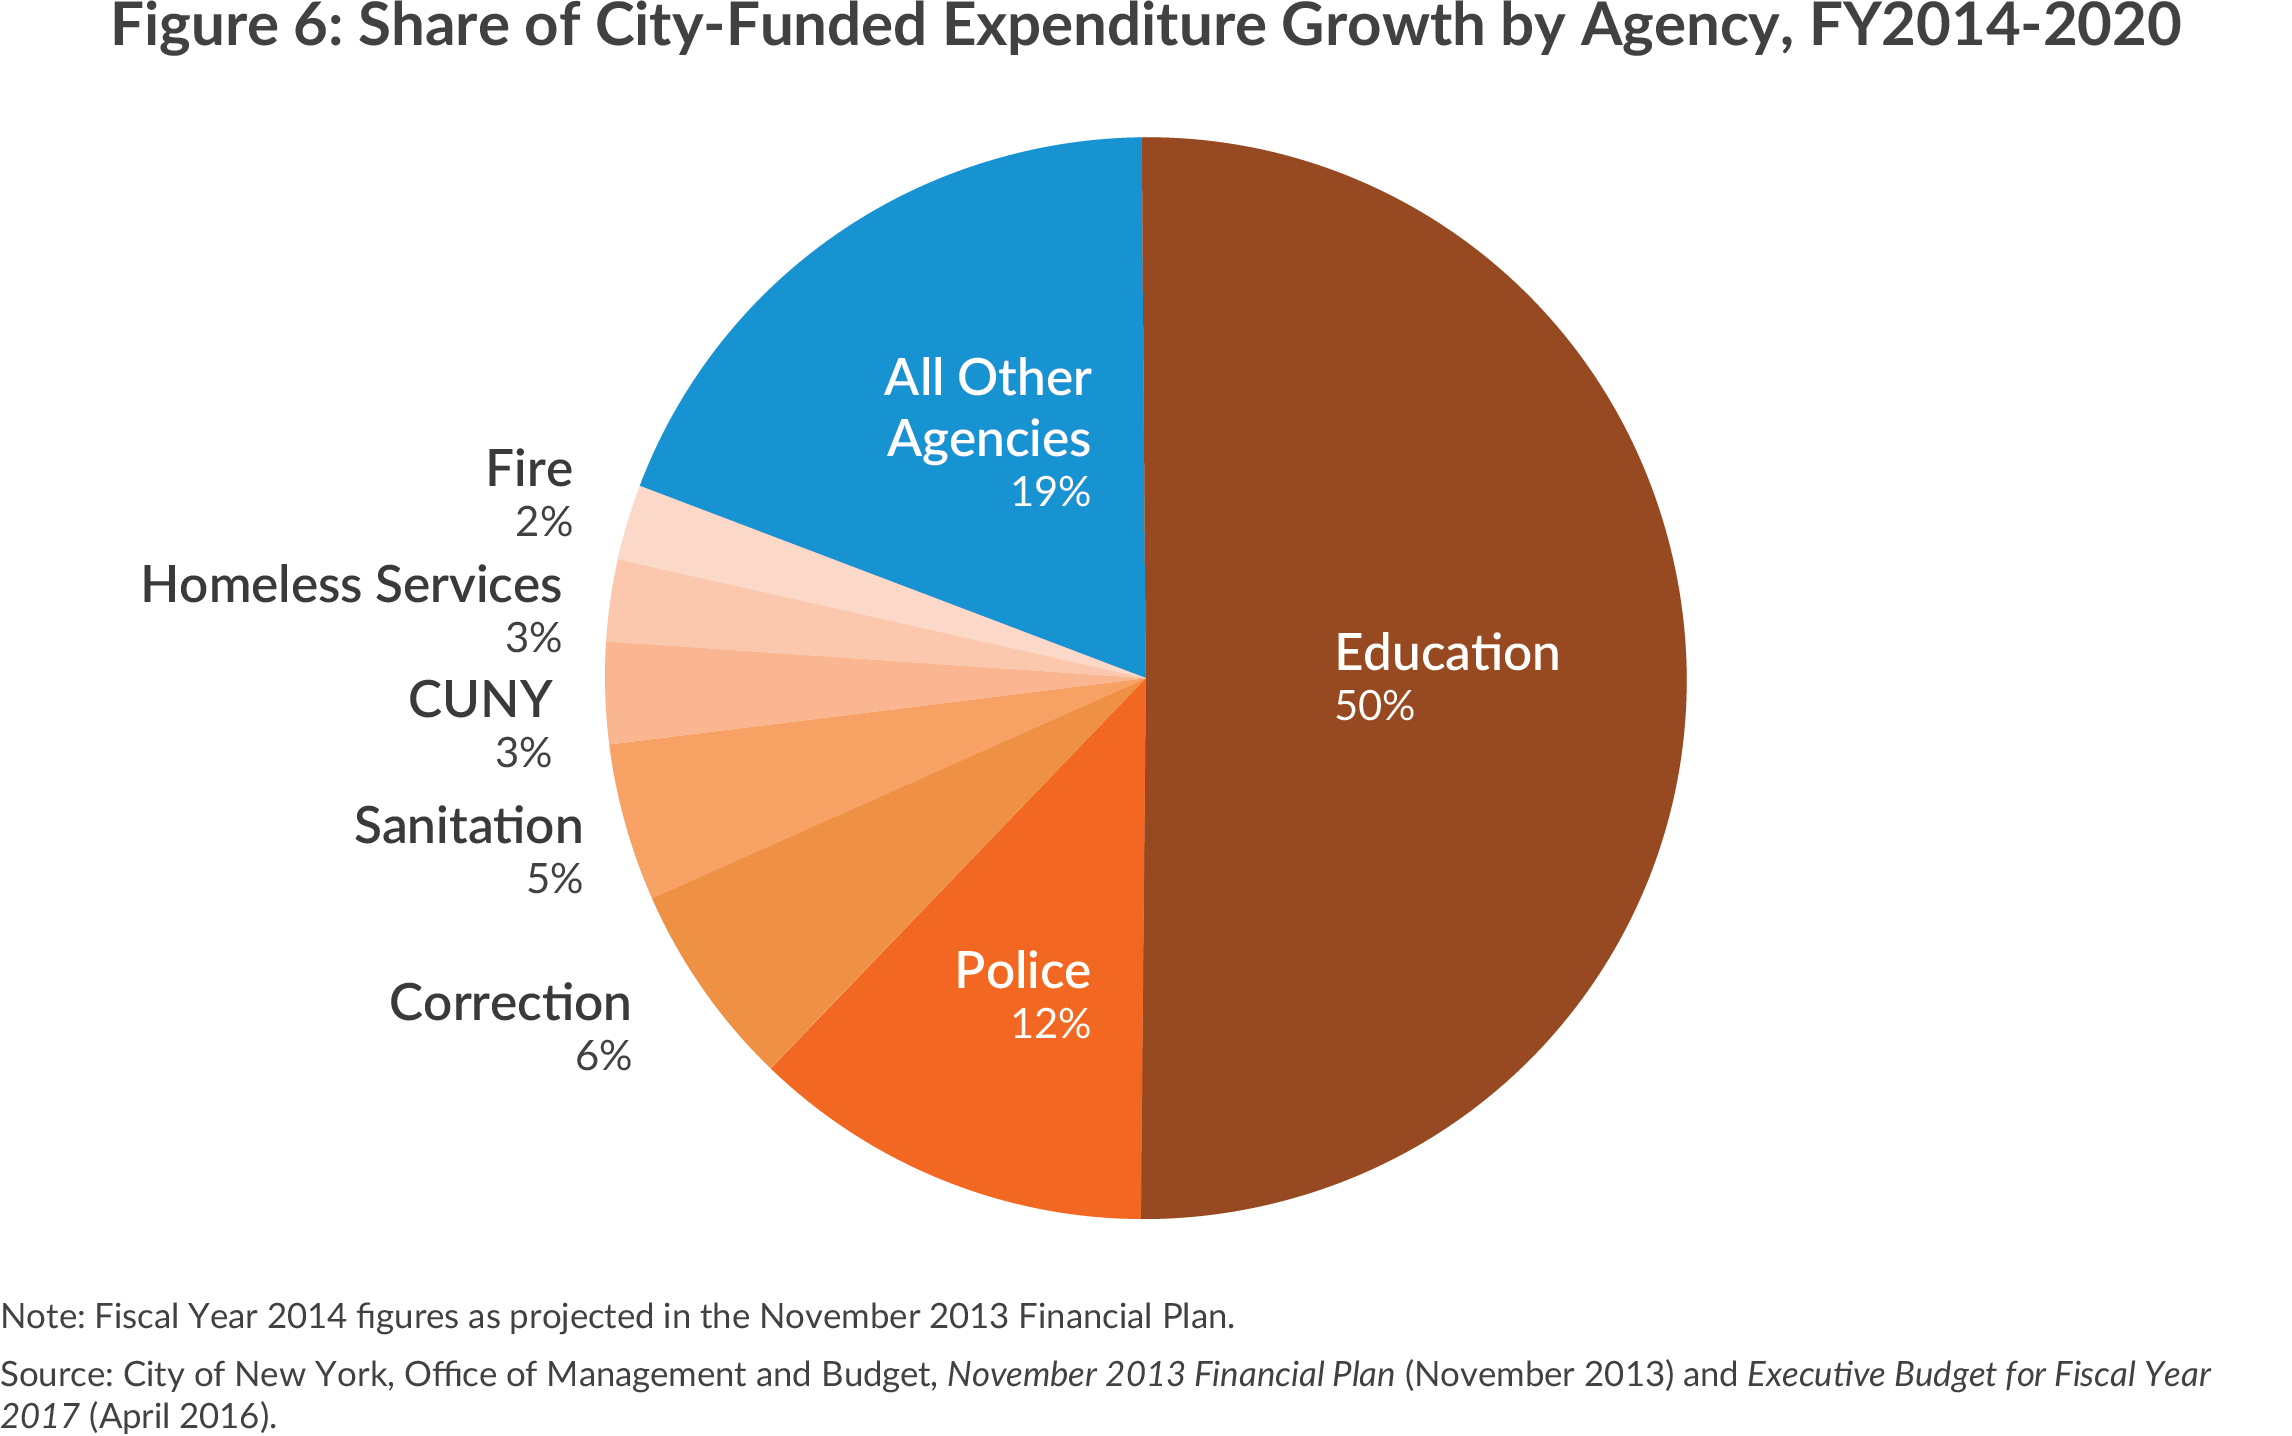
The next two largest increases are for two criminal justice agencies: the Police Department and the Department of Correction. Their respective increases of $669 million and $341 million total more than $1.0 billion. In each case the funding supports enhanced services, with City-funded headcount increasing by 3,448 at the Police Department and by 2,160 at the Department of Correction. Again, the percent growth in headcount, 7 percent and 21 percent, respectively, lags the corresponding increase in City funds of 15 percent and 32 percent. Much of the money is going for higher compensation.
A similar pattern prevails at the Sanitation Department, which increases by $262 million. City-funded staff is planned to increase 9 percent (854 positions), less than half the 19 percent increase in City funds. At the Department of Homeless Services the 17 percent (318 positions) increase in City-funded staff also lags the $136 million or 30 percent increase in City funds; however, the increase in City-funded staff includes a shift of some staff from intergovernmental to City funding and the total headcount increases a lower 245 or 12 percent.
City funding for CUNY’s community colleges increases by $168 million, from $607 million to $775 million, from fiscal years 2014 to 2020. The 28 percent increase is intended to improve the academic environment and support the transition from high school to community college; City-funded full-time faculty and administrative positions will grow by close to one-third.
Only at the Fire Department, the agency in the top seven with the smallest increase of $125 million, are the rates of increase in City funding and staffing close– 8 percent and 7 percent, respectively. Among the 1,151 added City-funded positions, 999 are civilians, which include emergency medical technicians and paramedics to be hired to expand ambulance services. These employees are less well compensated than uniformed firefighters.
Agencies with Rapid Increases
Priorities are reflected in the rate of increase as well as the amount of increase in spending. The missions of agencies with relatively small base year spending are prioritized if the percentage increase is large; for example, a doubling of spending for a small agency can reflect a high priority even if the total amount of the increase is small compared to a large agency such as the DOE.
The five agencies with the most rapid increase in City funding each has at least a near doubling of its allocation. The Commission on Human Rights is slated for a nearly five-fold increase in City funds, although the amount is a modest $9 million increase. Much of the increased City funding is a replacement of reallocated federal Community Development Block Grant funds; the agency’s total budget increases a lower 81 percent from $6.4 million to $10.9 million. This increase provides for 55 total positions.
The Department of City Planning and Department of Emergency Management each also have significant federal funding. City funding of $7 million for each agency in fiscal year 2014 represented only 32 percent and 12 percent of the respective agency’s total budget. In each case the City funding more than triples, but the total agency budget grows by a lower 79 percent for City Planning and declines for Emergency Management due to lower federal support from the higher levels in earlier years that include funding related to Superstorm Sandy.
The Department of City Planning total headcount increases 85 to 357 in fiscal year 2020 and its allocation for consulting services is also increased substantially to help with rezoning activities. For the Department of Emergency Management the City-funded headcount increases 32 to 54.
The Board of Correction, which monitors the Department of Correction, is one of the City’s smallest agencies. The seemingly modest $2 million increase in City funding is a more than doubling of the fiscal year 2014 amount; the agency’s total staff is slated to increase from 16 to 40.
The Department of Investigation is predominantly locally funded, and its City-funded allocation is planned to nearly double from $17 million to $32 million. The agency’s total staff is to increase from 234 to 396, with 25 of the 162 new positions devoted to investigations at the Buildings Department.
Priorities Among Independent Agencies
As noted earlier, a substantial part of OTPS spending is subsidies to independent agencies. The major agencies receiving subsidies are New York City Health + Hospitals (H+H), the Metropolitan Transportation Authority (MTA), the New York City Housing Authority (NYCHA), and the public libraries which include three separate library systems serving Queens, Brooklyn, and the remainder of the city.
The increase in City operating funding for these agencies varies widely, with the greatest increase, $799 million, going to NYC H+H. (See Figure 9.) H+H has a current total operating budget of about $7.5 billion and relies predominantly on payments from Medicare, Medicaid, and private insurance for its revenues; the direct City subsidy represents only about 10.5 percent of its current budget.15 The planned growth in City support is because H+H’s other revenue is declining due to cuts in Medicaid-related support; the City is pledging to make up a part of that loss but is also requiring the agency to develop a plan to become more self-sufficient. The City is also supporting H+H in other ways: forgiving reimbursement for medical malpractice claims and debt service, and picking up the incremental growth in H+H salaries and wages stemming from recent collective bargaining settlements.16
The second largest increase is City support for the MTA, which grows $183 million or 22 percent. The MTA’s $15.1 billion budget is supported largely by fares and toll revenue and dedicated State taxes; the City subsidy was only about 6 percent of the total in 2014.17 The City subsidy is based on commitments, and in some cases statutory requirements, to fund some operating costs of some bus services, paratransit services, reduced fare for students and senior citizens, and to pay certain state taxes dedicated to the MTA. The growth in MTA subsidy is based on the growth in these obligations and does not reflect any new policy decisions.18
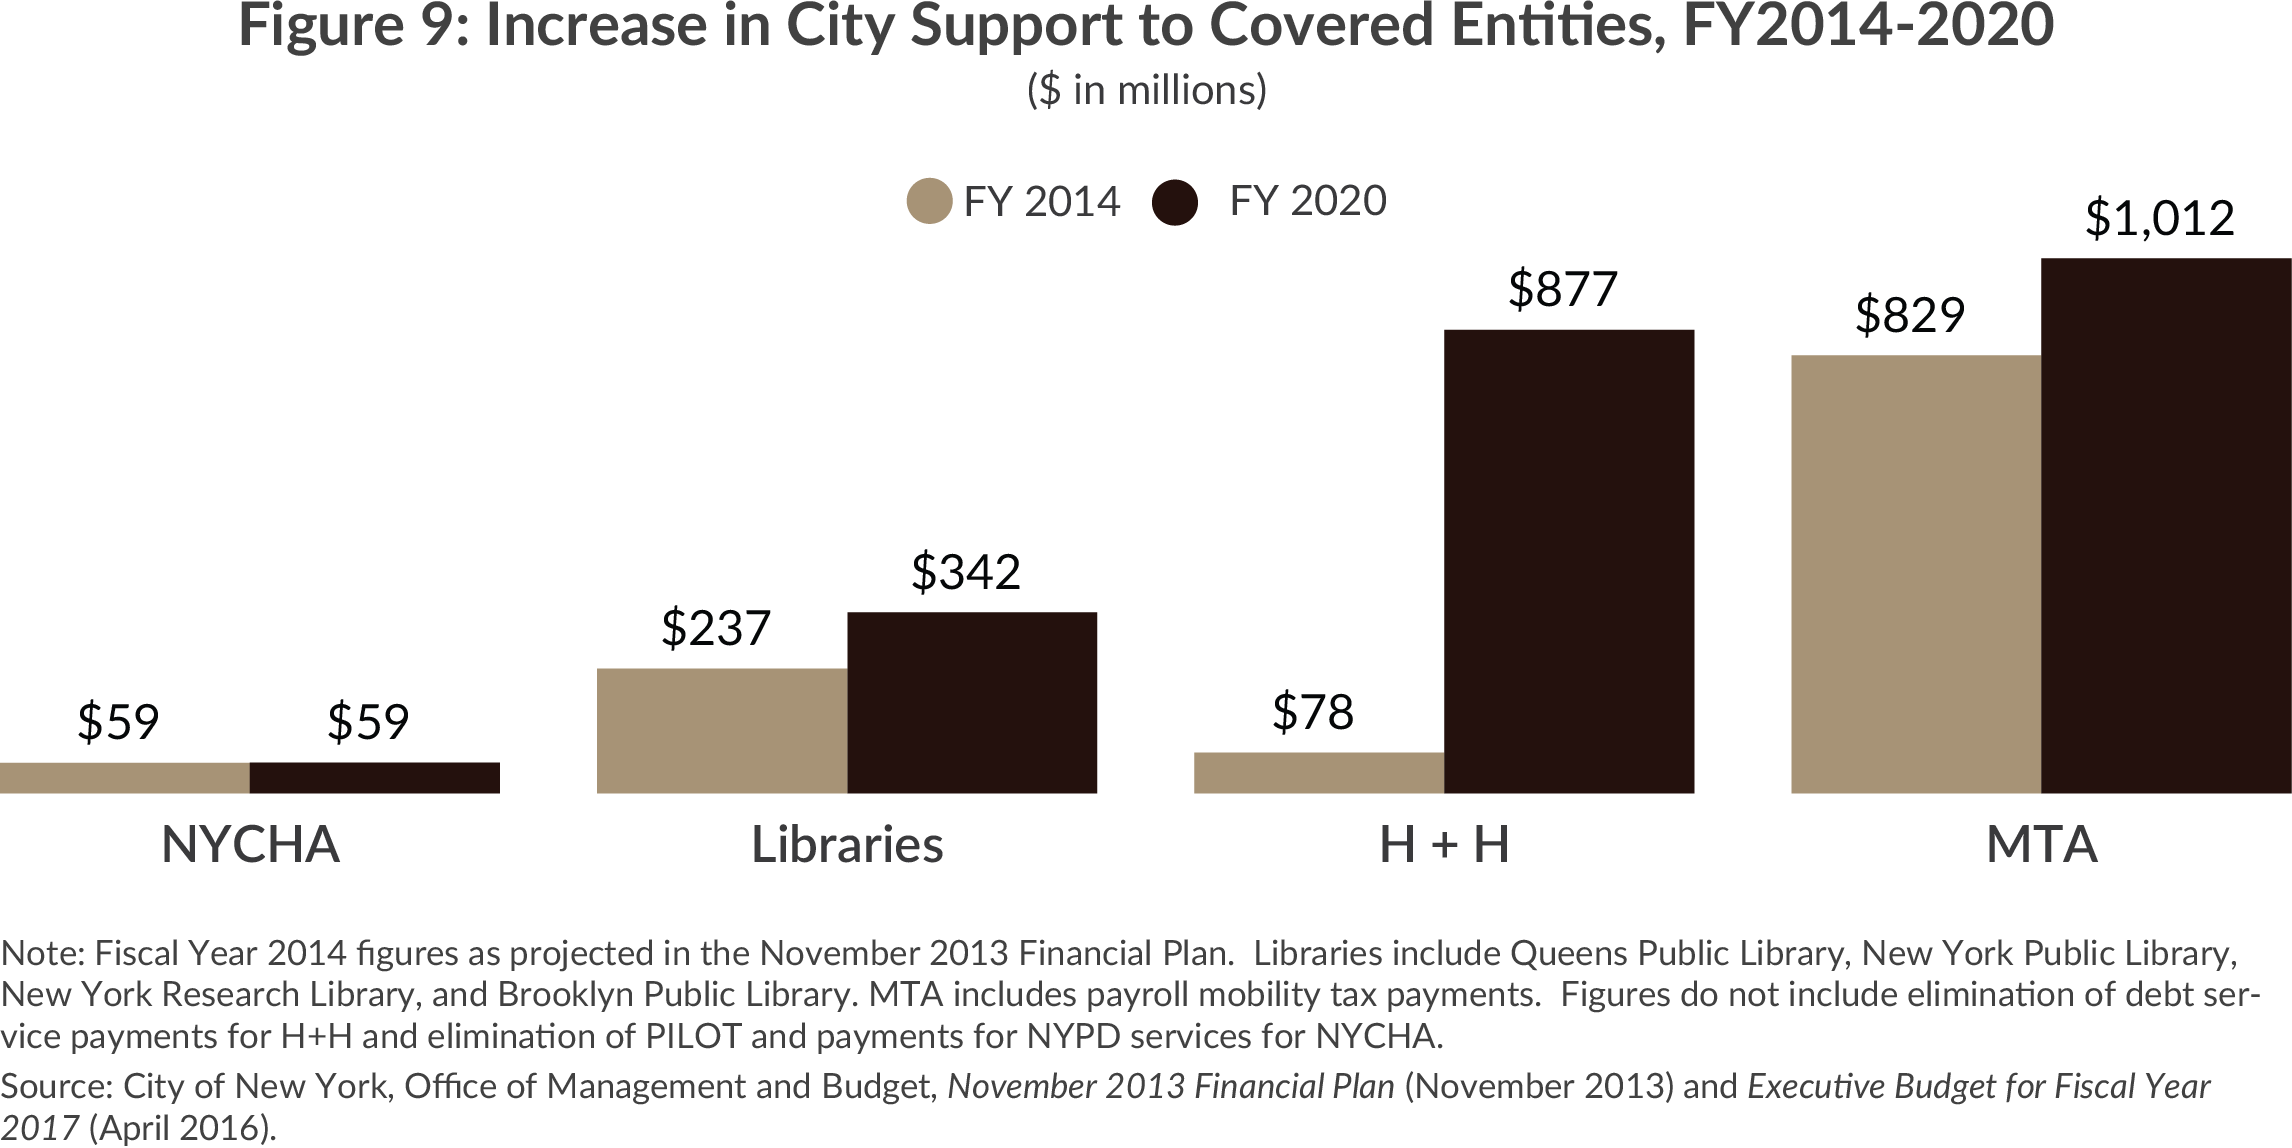
Although operated by independent boards, the city’s three library systems depend heavily on City subsidies for their operating budgets. The combined City subsidy is being increased $106 million or 45 percent to $342 million between fiscal years 2014 and 2020. This relatively large increase is supporting extended operations and enhanced services, including restoration of six-day service.
NYCHA’s operating budget in 2014 was about $3.2 billion with the funding predominantly from tenant rents and federal support.19 City operating support was $59 million; while the payment increased modestly in intervening years it is planned to return to $59 million in fiscal year 2020. The City is also providing other measures of support to help NYCHA keep its budget balanced, including eliminating $72.5 million in annual payments previously made by NYCHA for police services; eliminating NYCHA’s annual $33 million Payment in Lieu of Taxes; and assuming incremental collective bargaining costs.20
Summary
Mayor de Blasio’s current Financial Plan calls for a $17.9 billion or 24 percent increase in spending from the time he took office through fiscal year 2020. The pace of expenditure growth is slower than during the first seven years under Mayor Bloomberg (44 percent), but faster than during the last seven years (19 percent) of his administration.
The biggest driver of expenditure growth is personal service costs, which increase 30 percent due to increases in salaries and wages and to rapidly rising health insurance costs. Most of the increase in personal service expenditures is attributable to an increase in compensation cost per employee (which exceeds $158,000 in fiscal year 2020) although the number of employees (which grows more than 23,000 or 7.7 percent) has also grown. City funds dedicated to specific agency operations comprise only $5.6 billion or 35.1 percent of the total increase in spending.
Most of the spending increases are driven by factors beyond the control of agency leaders, including collective bargaining agreements, rising medical care costs, pension fund contributions related to changes in retiree mortality and pension fund investment returns, debt service to pay for capital investments, and the availability of state and federal grants.
The agencies with the largest City-funded spending increases are the Department of Education ($2.8 billion), the Police Department ($669 million), the Department of Correction ($341 million), the Sanitation Department ($262 million), community colleges at the City University of New York ($168 million), the Department of Homeless Services ($136 million), and the Fire Department ($125 million). Together these seven agencies account for four-fifths of the total increase in such agency spending.
Several smaller agencies have rapid rates of increase in their budget allocation. The five agencies whose City-funded budgets are at least nearly doubled are the Commission on Human Rights, the Department of City Planning, the Department of Emergency Management, the Board of Corrections, and the Department of Investigation.
The Administration’s plans for five important independent agencies that receive City subsidies vary widely. No major increase in operating subsidy is planned for NYCHA; the MTA receives percentage increases in line with the overall rate of spending increase (22 percent), the library system receives a more rapid 45 percent increase, and the subsidy for H+H rises tenfold to $877 million.
Download Report
Where Is the Money Going? Mayor de Blasio's Spending PrioritiesFootnotes
- City of New York, Office of the Comptroller, Bureau of Budget, Comments on New York City Fiscal Year 2017 Executive Budget (May 24, 2016), p. 6, http://comptroller.nyc.gov/wp-content/uploads/documents/May_2016_FY17_CommentsExecBudget.pdf; and New York State Department of Labor, “Labor Statistics for the New York City Region” (accessed May 25, 2016), www.labor.ny.gov/stats/nyc/index.shtm.
- City of New York, Office of Management and Budget, Executive Budget: Fiscal Year 2017 Message of the Mayor (April 26, 2016), pp. 17-20, www.nyc.gov/html/omb/downloads/pdf/mm4-16.pdf.
- Fiscal year 2014 revenues anticipated in Mayor Michael Bloomberg’s last financial plan totaled $72.7 billion, of which $51.4 billion were local revenues. In the current fiscal year, revenues are expected to total $82.1 billion, an increase of $9.4 billion.
- The growth of spending is calculated by CBC staff using total expenditures as reported by the New York City Office of Management and Budget, less intra-city and inter-fund revenues. These expenditures are adjusted for (1) deposits and withdrawals to the Retiree Health Benefit Trust, so that deposits are not counted as spending; and (2) prepayments of debt service and other subsidies made through the budget stabilization account, commonly referred to as the “surplus roll.”
- Note these segments have overlapping fiscal years, but both are for a seven-year period.
- In May 2014, the City and the Municipal Labor Committee agreed to a health savings agreement that would generate a total of $3.4 billion in savings between fiscal years 2015 and 2018, with $1.3 billion in recurring savings thereafter. See Robert Linn, Director, City of New York, Office of Labor Relations, letter to Harry Nespoli, Chair, Municipal Labor Committee (May 5, 2014), www1.nyc.gov/assets/olr/downloads/pdf/collectivebargaining/2014-mlc-nyc-health-savings-agreement.pdf.
- Labor contracts for collective bargaining units representing city employees start and end in different calendar and fiscal years. The “pattern” of wage increases negotiated for civilian employees provided for a $1,000 signing bonus in lieu of a wage increase and then wage increases of 1 percent, 1 percent, 1 percent, 1.5 percent, 2.5 percent, and 3 percent. Uniformed employees generally received a 1 percent increase in the first year in lieu of a signing bonus. For more information, see City of New York, Office of Labor Relations, “Recent Agreements & Prevailing Rate Consent Determination” (accessed May 15, 2016), www1.nyc.gov/site/olr/labor/labor-recent-agreements.page.
- City of New York, Office of Management and Budget, Executive Budget: Fiscal Year 2017 Message of the Mayor (April 26, 2016), p.226, www.nyc.gov/html/omb/downloads/pdf/mm4-16.pdf.
- Fiscal year 2020 personal service spending includes an estimated $1.4 billion in lump-sum payments to teachers, nurses, and other personnel related to collective bargaining settlements. See City of New York, “Contract Summaries: ‘9-Year Pattern’” (accessed May 31, 2016), www1.nyc.gov/assets/olr/downloads/pdf/collectivebargaining/9yr-pattern-oct-2014.pdf.
- Fiscal year 2020 salaries and wages include an estimated $1.4 billion in lump-sum payments to approximately 150,000 members of the workforce. If these one-time payments are removed from the PS base, compensation costs per full-time and full-time equivalent employee would average $153, 842 (versus $158,842). The growth from fiscal year 2014 would be $22,290 per employee (versus $26,706), an increase of 16.9 percent (versus 20.3 percent).
- Some of planned borrowing is for the Department of Education’s capital plan and will be backed by State aid. Figures exclude debt of the Municipal Water Finance Authority (MFWA), which is backed by user charges. The MFWA will issue $8.5 billion in new debt in support of the 2016-2020 capital plan and its outstanding debt will total $35.7 billion at the end of fiscal year 2020. See City of New York, Office of Management and Budget, Executive Budget: Fiscal Year 2017 Message of the Mayor (April 26, 2016), pp. 55-56, www1.nyc.gov/assets/omb/downloads/pdf/mm4-16.pdf.
- May 2015 public assistance caseload was 336,403. This Executive Budget projects caseload in fiscal year 2020 to be 388,600. See City of New York, Office of the Comptroller, Bureau of Budget, Comments on New York City Fiscal Year 2017 Executive Budget (May 24, 2016), p. 36, http://comptroller.nyc.gov/wp-content/uploads/documents/May_2016_FY17_CommentsExecBudget.pdf.
- New York City Independent Budget Office, Re-estimated the Mayor’s Executive Budget and Financial Plan Through 2020: A Slowing Local Economy, But A Stable Budget Outlook (May 2016), pp. 11-15, www.ibo.nyc.ny.us/iboreports/re-estimating-the-mayors-executive-budget-and-financial-plan-through-2020-a-slowing-local-economy-but-a-stable-budget-outlook.pdf; and City of New York, Office of the Comptroller, Bureau of Budget, Comments on New York City Fiscal Year 2017 Executive Budget (May 24, 2016), p.36, http://comptroller.nyc.gov/wp-content/uploads/documents/May_2016_FY17_CommentsExecBudget.pdf.
- Fiscal year 2017 includes an additional $500 million in the capital stabilization reserve.
- Excludes $253 million in combined Health + Hospitals and City debt service payments.
- Maria Doulis, “Where Do We Go From Here? Steering New York City’s Finances in Fiscal Year 2015,” Citizens Budget Commission Blog (July 1, 2014).
- Metropolitan Transportation Authority, 2016 Adopted Budget: February Financial Plan 2016-2019 (February 2016), Volume 1, MTA Consolidated Statement of Operations by Category, p. II-3, http://web.mta.info/mta/news/books/pdf/MTA_2016_Adopted_Budget_February_Financial_Plan_2016_2019.pdf.
- The City made a policy decision to increase capital support to the MTA, increasing its funding commitment to the MTA’s 2015-2019 Capital Plan from approximately $500 million to $2.5 billion.
- The Council of the City of New York, Hearing on the 2014-2018 Operating and Capital Budget & the Fiscal 2014 Preliminary Mayor’s Management Report: New York City Housing Authority (March 21, 2014), p. 8, http://council.nyc.gov/downloads/pdf/budget/2015/15/NYCHA.pdf.
- Maria Doulis, “Where Do We Go From Here? Steering New York City’s Finances in Fiscal Year 2015,” Citizens Budget Commission Blog (July 1, 2014); and Citizens Budget Commission, Cleaning House: How to Close the New York City Housing Authority’s Operating Gaps (April 2015).