At Best, Mediocre: The Performance of New York City’s Hospital Referral Regions
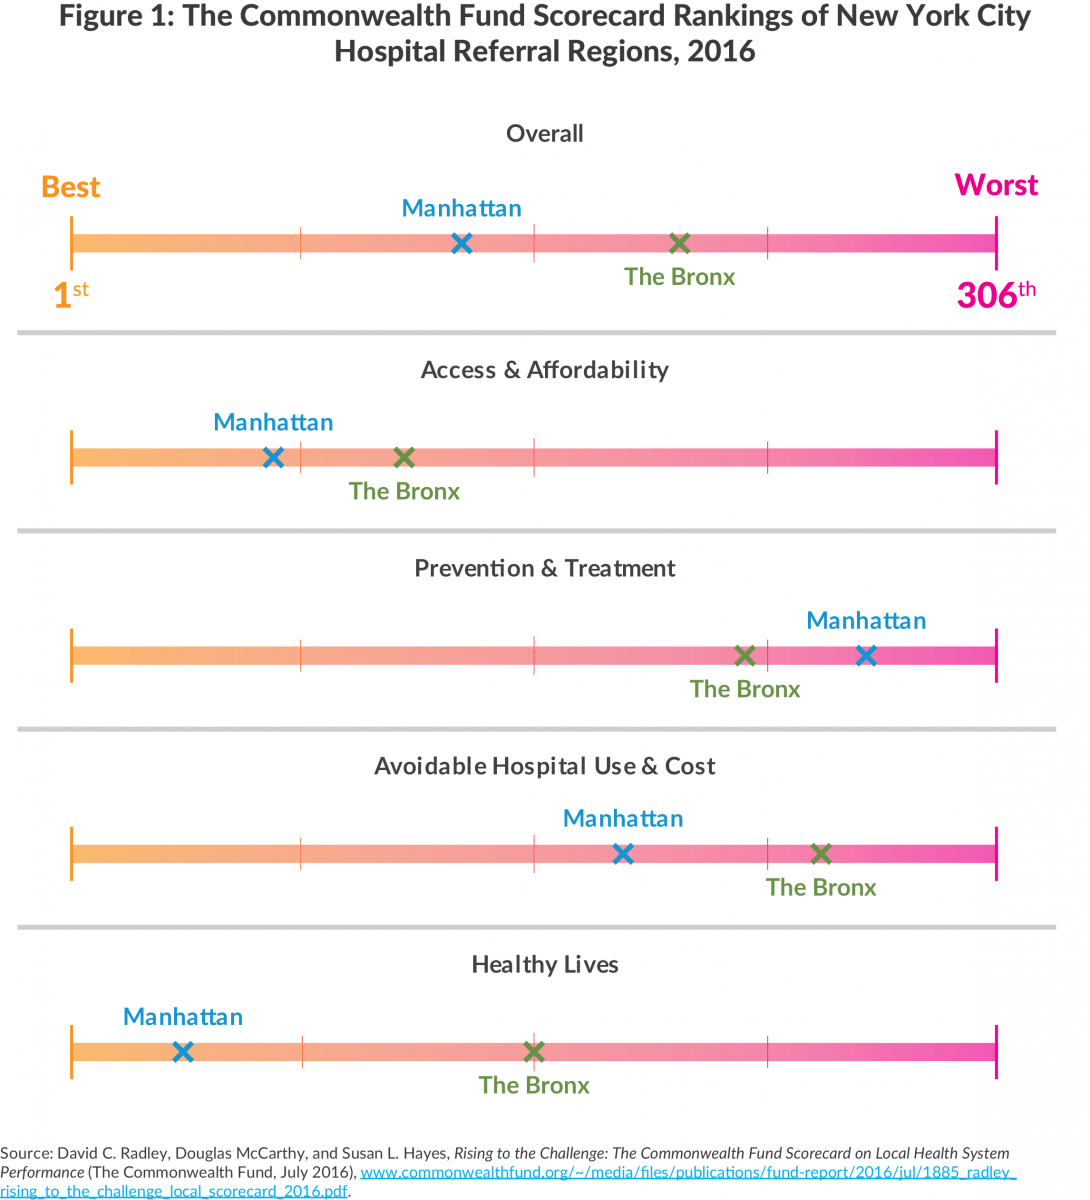
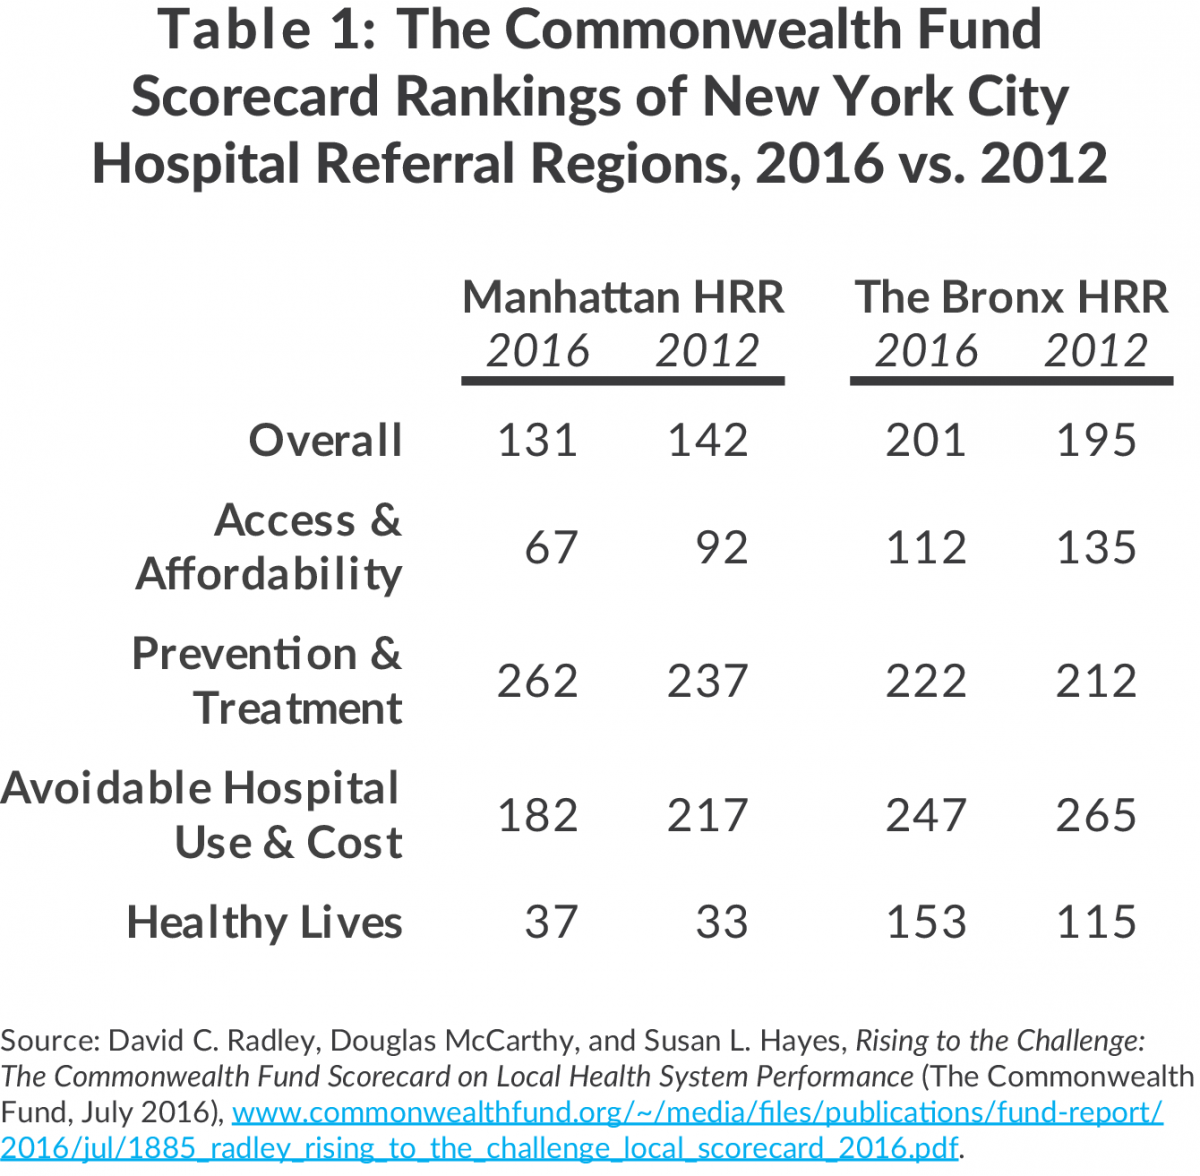
Last month The Commonwealth Fund, a respected health care foundation based in New York City, published its second Scorecard on Local Health System Performance.1 The Scorecard ranks the local health care systems in 306 Hospital Referral Regions (HRRs) in the United States, areas defined based on characteristics of local health care markets including the areas from which hospitals draw their admissions.2 New York City contains two HRRs: one identified as “Bronx,” which consists primarily of the Bronx but includes portions of Westchester, and another identified as “Manhattan,” which includes all four of the other boroughs. Both New York City HRRs received a mediocre overall ranking: the Bronx is 201 of 306 (number 1 being the best), and Manhattan is 131.
Strong and Weak Elements of Performance
The overall ranking is a composite of 36 indicators grouped in four domains: (1) Access and Affordability, (2) Prevention and Treatment, (3) Avoidable Hospital Use and Cost, and (4) Healthy Lives. The New York City HRRs mediocre overall performance is a result of relatively good performance on two of these dimensions and much poorer performance on the other two. The strongest showing is for the Manhattan HRR in Healthy Lives (ranking 37) and Access and Affordability (67). The Bronx HRR is also in the top half of the nation on these two dimensions, ranking 153 and 112, respectively. Specific indicators within these domains on which the New York City HRRs do particularly well are the low share of uninsured children (Manhattan ranks third and Bronx ranksfourth) and low suicide rates (Bronx ranksfirst and Manhattan ranks sixth).
In contrast the New York City HRRs are toward the low end of the national distribution for Prevention and Treatment and for Avoidable Hospital Use and Cost. The Bronx HRR ranked 222 and 247 in these areas, respectively, and Manhattan HRR scored at 262 and 182, respectively. Among the 13 indicators used for the Prevention and Treatment dimension, Manhattan HRR ranked 300 or worse on three indicators and below 200 on another five indicators; in that dimension the Bronx HRR also ranked 300 or worse on three indicators and below 200 on another four indicators. Examples of the indicators with notably poor rankings are the share of hospitalized patients given information about what to do at home during recovery and the rate of readmitted hospital discharges among nursing home patients.
The 2016 Scorecard is the Commonwealth Fund’s second such effort; a similar Scorecard was published in 2012. The 2016 version relies on data from 2014 or a period close to that year, and the 2012 Scorecard used data from 2011 or close to that year. Performance on many indicators improved across nearly all HRRs nationally in this period, presumably at least in part a consequence of implementation of the federal Affordable Care Act of 2010. While absolute levels improved on many indicators in the two New York City HRRs, the rate of improvement varied and the change in national overall rankings was modest. Manhattan improved its ranking by 11 positions while the Bronx slipped by 6 positions.
Comparing New York City to Other HRRs in New York State and in Other Large Cities
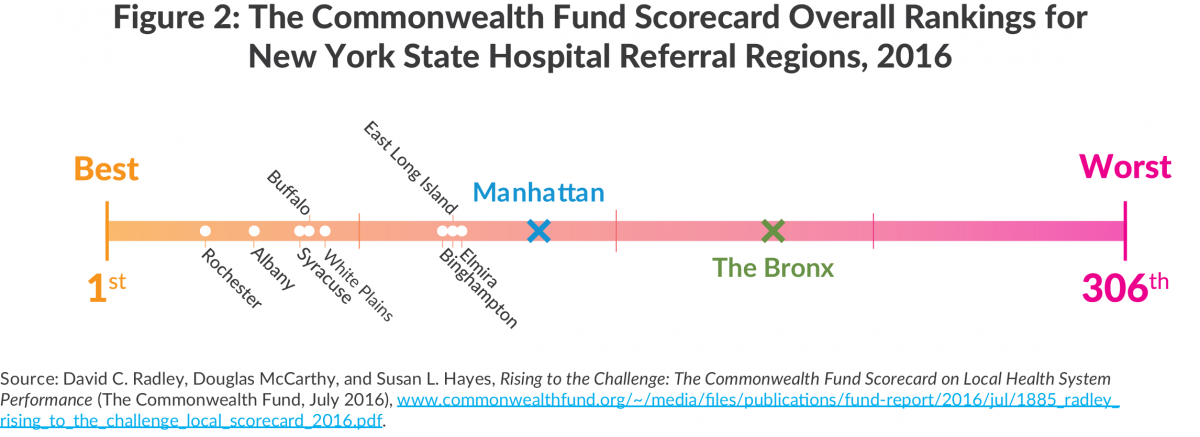
In addition to comparing the New York City HRRs to all others in the nation, it is instructive to compare them to the other HRRs in New York State and to the HRRs in the nation’s other large cities. As shown in Figure 2, the Manhattan and Bronx HRRs rank lowest among New York State’s ten HRRs. Five of these HRRs had overall rankings ranging from 30 to 67, and the other three fell just below 100.
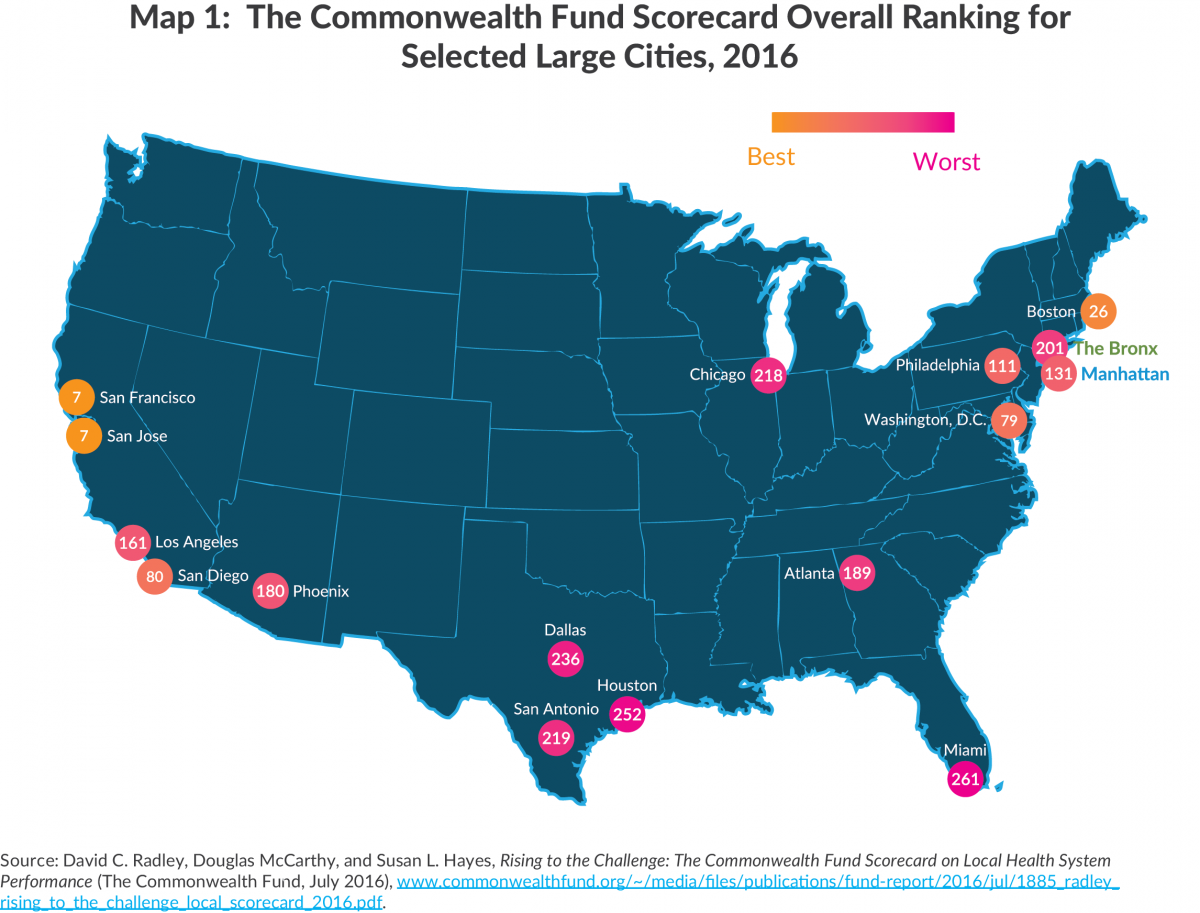
New York City’s large size presents challenges and costs that New York State’s other HRRs may not have to overcome, and so it is not necessarily surprising that Manhattan HRR and Bronx HRR rate somewhat more favorably when compared with HRRs of other large cities in the nation. Map 1 shows the overall rankings for the two New York City HRRs and the HRRs of the other 14 largest urban population centers.3 Six large cities’ HRRs ranked above the Manhattan HRR, and nine ranked above the Bronx HRR. The five HRRs doing worse than the Bronx are in Chicago, Miami, and in three Texas cities.
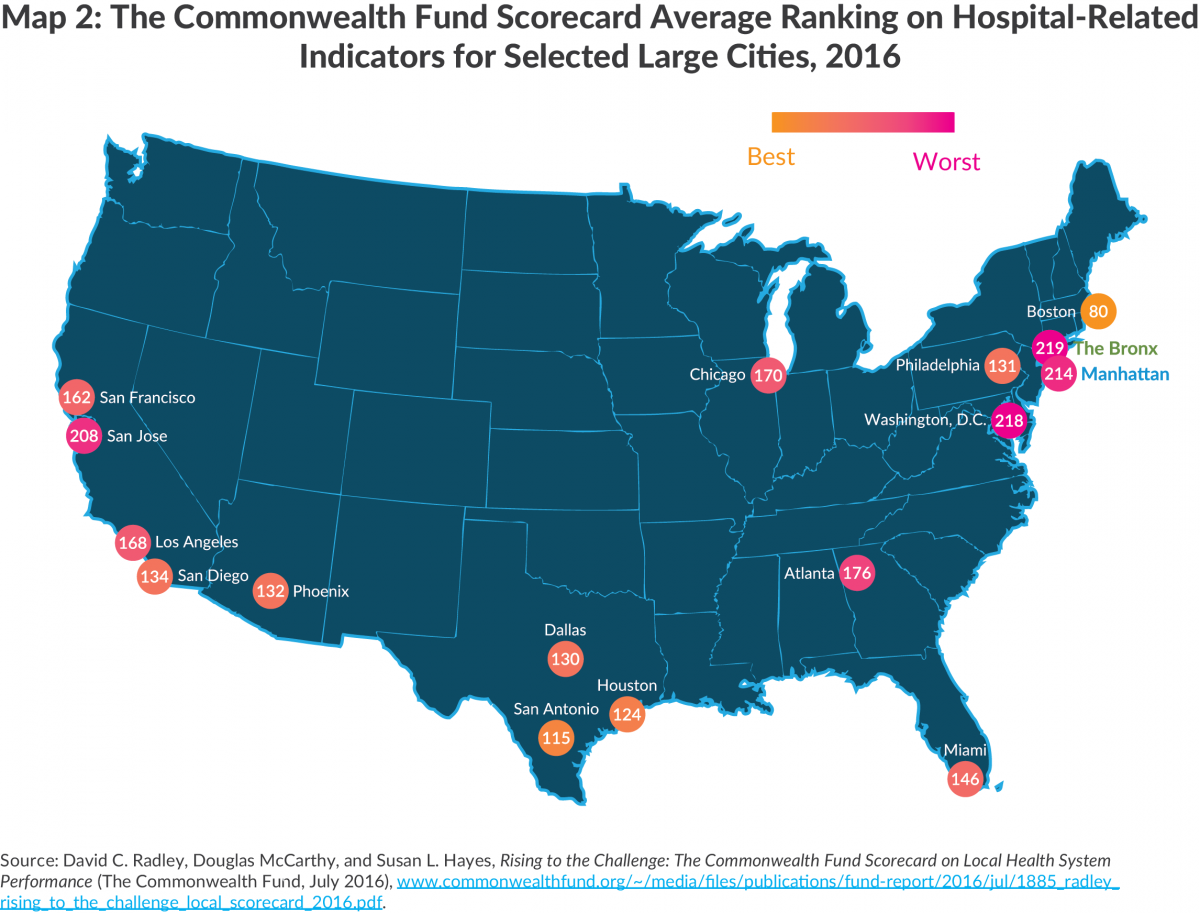
New York City HHRs’ somewhat more favorable rating relative to other large city HRRs cannot be attributed to better performance by New York hospitals. As noted earlier the New York HRRs rank quite low nationally on the Avoidable Hospital Use and Cost dimension, and this pattern persists in comparison with other large city HRRs. Map 2 presents the average score for the large city HRRs on four indicators closely related to hospital quality: risk adjusted 30-day mortality among Medicare beneficiaries hospitalized for heart attack, heart failure, pneumonia, or stroke; the Hospital Safety Composite Score; percent of hospitalized patients given information about what to do during their recovery; and percent of hospitalized patients who reported hospital staff always managed pain well, responded when needed, and explained medicines and side effects. Of the other large city HRRs 13 of 14 rank better than the Manhattan HRR, and all do better than the Bronx HRR.
This pattern of hospital performance is congruent with the recently published ratings for health institutions by the federal Centers for Medicare and Medicaid Services (CMS).4 The CMS rating system awards one to five stars depending on the quality of care provided. Only one New York City hospital (Hospital for Special Surgery) earned five stars. Two earned four stars, and three earned three stars. These are the same hospitals that do well on U.S. News & World Report’s national ranking.5 Most New York City hospitals, however, earned two stars (11 hospitals) or one star (22). This means that 85 percent of New York City hospitals ranked below the modal three-star ranking.6 New York City hospitals have criticized the CMS rating system for not adequately considering the challenges that mixed-income, densely populated areas face, but CMS undertook extensive review of its system before publishing the results.7
Conclusion
Based on the Commonwealth Fund Scorecard, New York City’s health system falls short nationally, compared to the rest of the State, and relative to other large American cities. The Scorecard suggests that New York City’s health system requires improvement especially in the areas of Prevention and Treatment and Avoidable Hospital Use and Cost. While both the Manhattan HRR and the Bronx HRR followed the national pattern of improvement since 2011 in raw scores on multiple indicators, they nonetheless continued to trail many other areas in their comparative standing. New York City’s health care leaders, particularly those in the hospital sector, might benefit from examining other cities efforts to improve the quality of care they provide.
Footnotes
- David C. Radley, Douglas McCarthy, and Susan L. Hayes, Rising to the Challenge: The Commonwealth Fund Scorecard on Local Health System Performance (The Commonwealth Fund, July 2016), www.commonwealthfund.org/~/media/files/publications/fund-report/2016/jul/1885_radley_rising_to_the_challenge_local_scorecard_2016.pdf.
- See: The Dartmouth Atlas of Health Care, “Data by Regions” (accessed August 1, 2016), www.dartmouthatlas.org/data/region.
- Fifteen most populous urban areas selected based on the size of central cities as well as metropolitan areas.
- Centers for Medicare and Medicaid Services, “First Release of the Overall Hospital Quality Star Rating on Hospital Compare” (press release, July 27, 2016), www.cms.gov/Newsroom/MediaReleaseDatabase/Fact-sheets/2016-Fact-sheets-items/2016-07-27.html.
- U.S. News & World Report, “2016-2017 Best Hospitals Honor Roll and Overview” (August 1, 2016), http://health.usnews.com/health-care/best-hospitals/articles/best-hospitals-honor-roll-and-overview.
- Medicare.gov, “Hospital Compare Overall Rating” (accessed August 5, 2016), www.medicare.gov/hospitalcompare/About/Hospital-overall-ratings.html.
- Robin Schatz, Jonathan LaMantia, and Caroline Lewis, “City hospitals slam new federal star ratings following poor performance,” Crain’s Health Pulse (July 28, 2016), www.crainsnewyork.com/article/20160728/PULSE/160729879/city-hospitals-slam-new-federal-star-ratings-following-poor.