A Fairer Fare Increase
On Sunday March 22 fares for the Metropolitan Transportation Authority’s (MTA) subways and buses will go up. Like three previous biennial fare increases since 2009, this hike is needed to raise revenue for transit operations. However, more money could be gained or the increase could be less painful for riders if the MTA pursues another, arguably fairer, revenue-raising strategy. By capping at a reasonable level the number of rides available to “unlimited” 7-day and 30-day MetroCards introduced in 1998, the MTA could secure about $93 million annually, the equivalent of nearly two-thirds of the expected revenue from this year’s subway and bus fare increase.1
Changing Fare Policy: From Increasing Ridership to Raising Revenue
In the last two decades the MTA has changed subway and bus fare policy dramatically. In the 1990s as the MetroCard was introduced, the MTA emphasized increased ridership by offering fare discounts. Since 2000 the MTA has shifted emphasis, seeking to generate more revenue from the fare box in order to help cope with fiscal stress. The result in recent years is regular fare increases for single rides and volume discount cards, but more creative and equitable options should be considered.
The MTA began testing MetroCards in 1993 and phased in new turnstiles and other equipment to replace tokens at all its stations between 1993 and 1997. During this period the $1.25 fare set in 1992 was raised to $1.50 in late 1995. The fare charged for those using MetroCards was the same as those for tokens; volume discounts were not available and only senior citizens and some students were eligible for reduced fares.2 Average revenue per ride was close to the nominal fare, $1.40 versus $1.50 in 1996.
Once MetroCards could be used systemwide, fare policy changed significantly. In July 1997 the MTA began permitting free transfers between subways and buses; until then a full fare was charged for each transfer between the two. At the start of 1998 the MTA introduced volume discounts, providing a 10 percent discount for MetroCard purchases of $15 or more, and in July 1998 unlimited 7-day and 30-day passes debuted at prices of $17 and $63 respectively.3
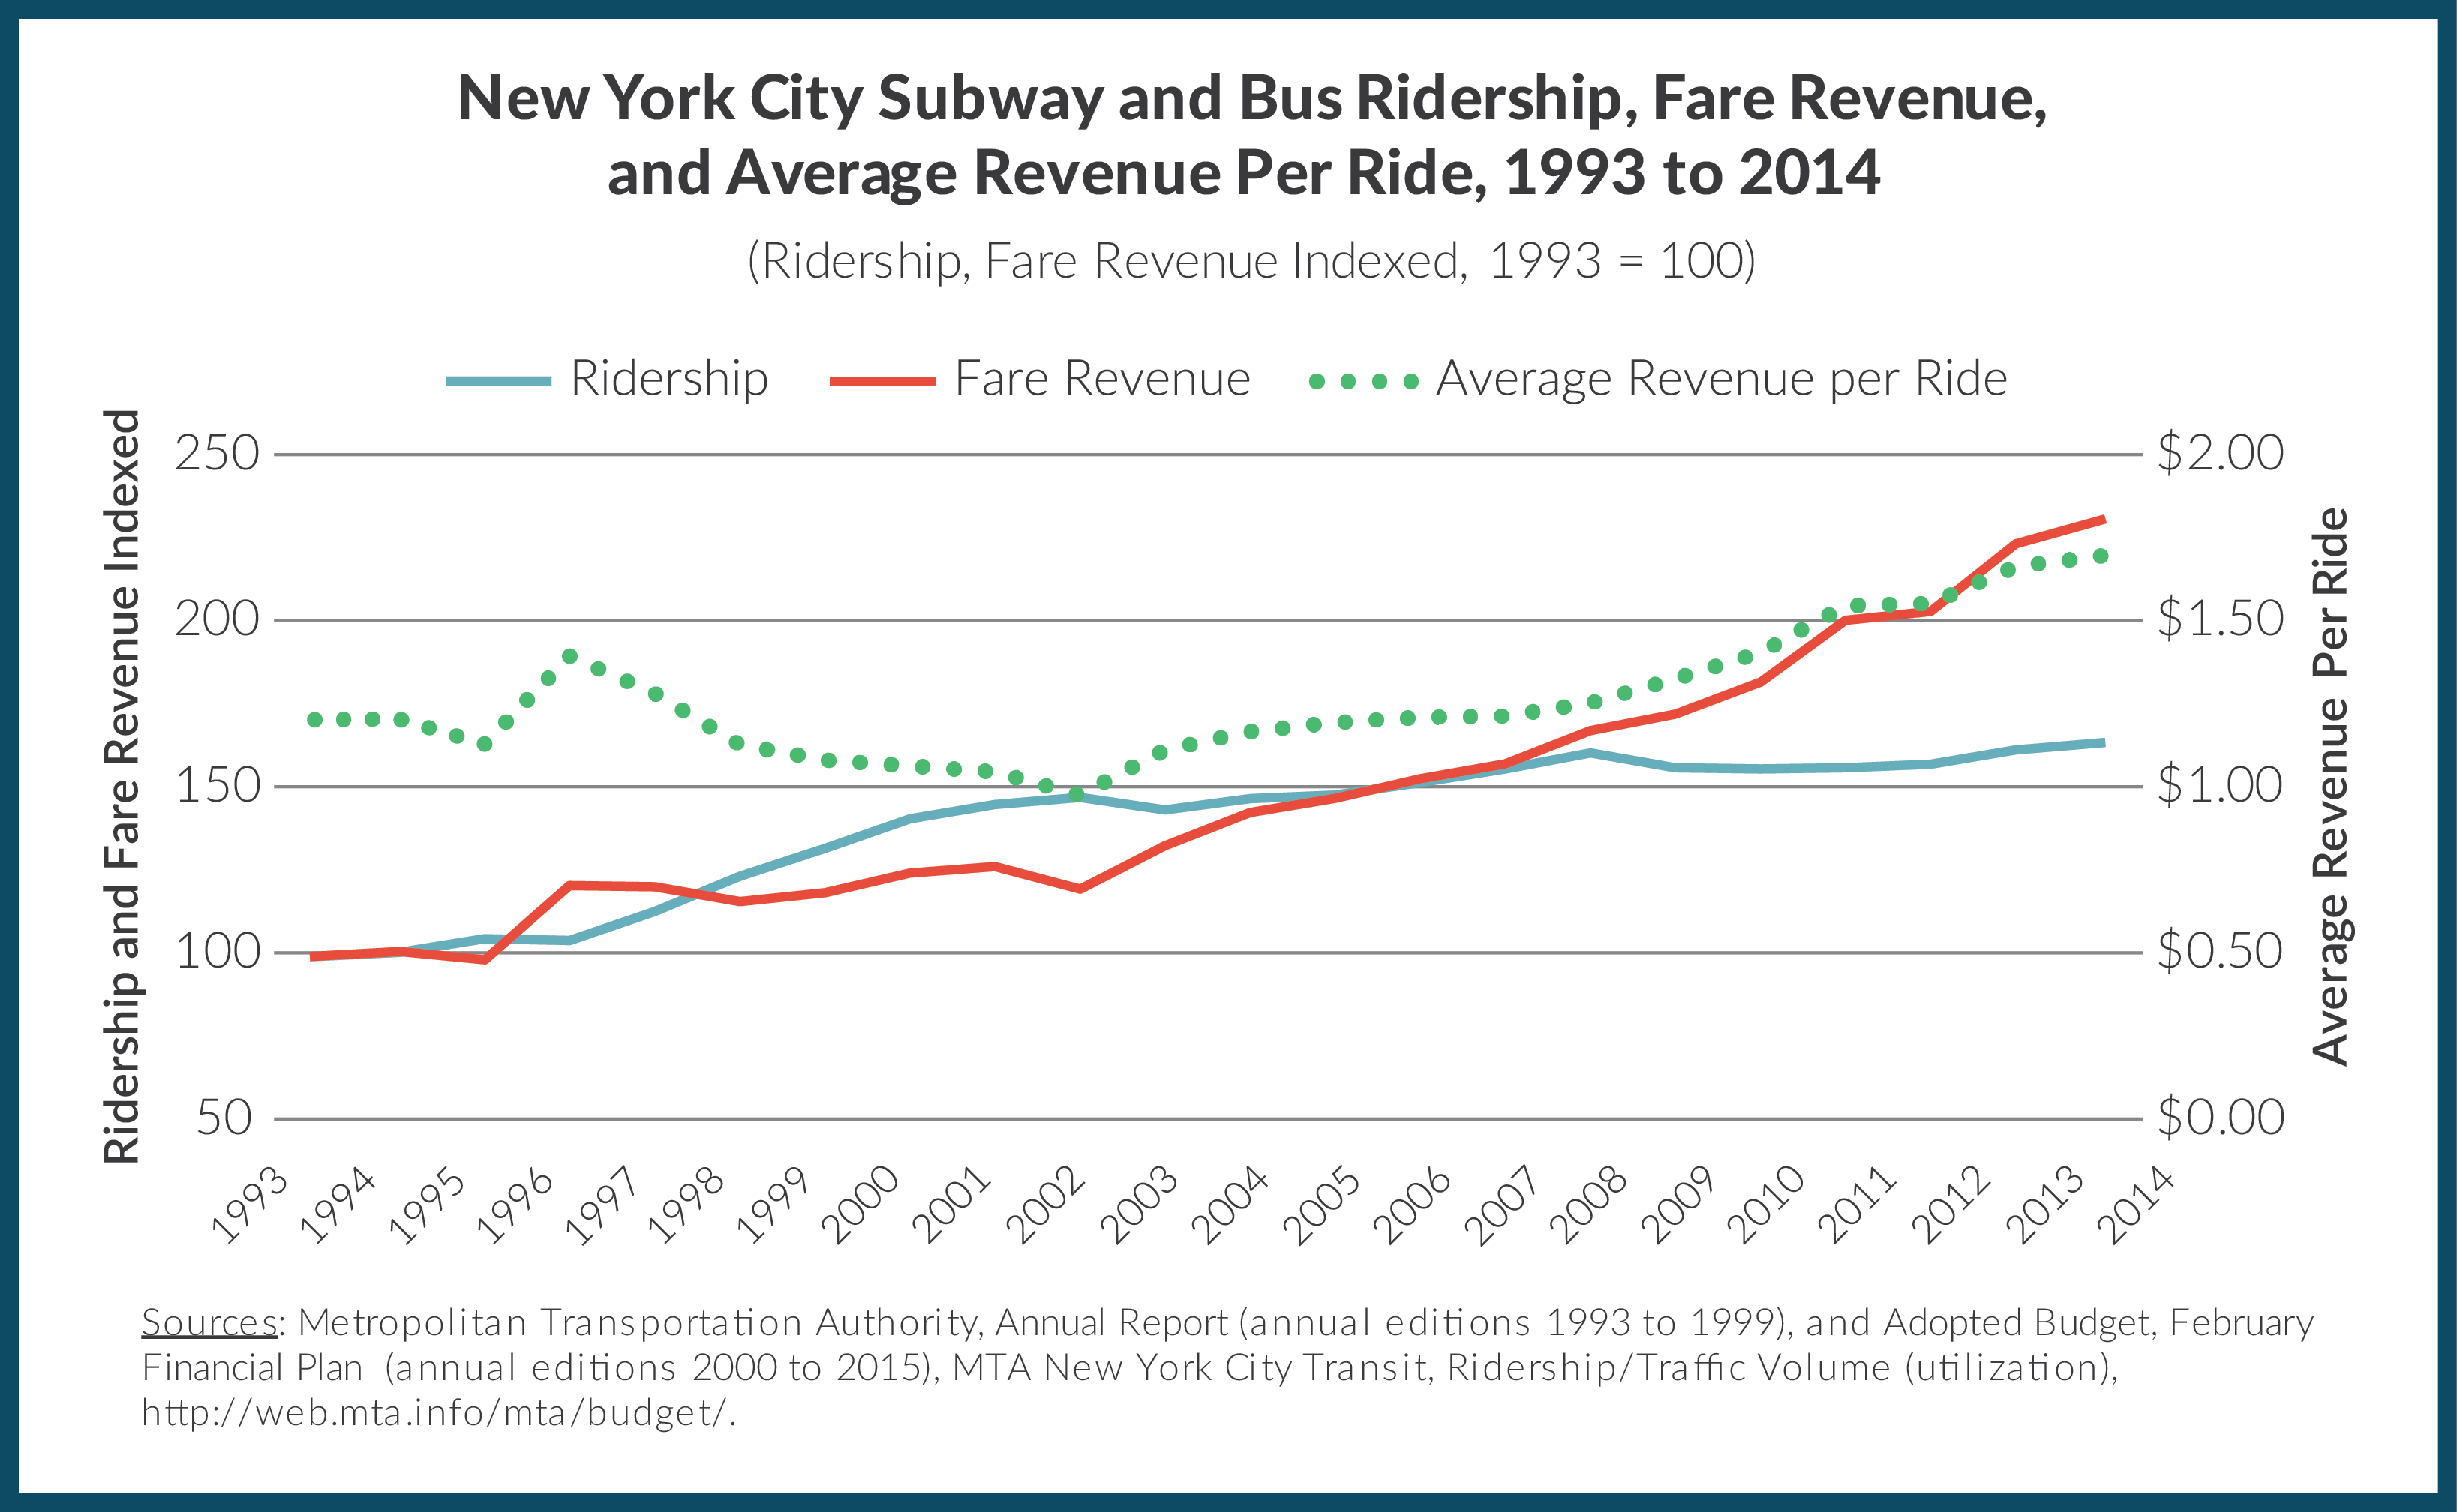
These initiatives had two dramatic impacts. First, ridership boomed. While an expanding economy in the late 1990s played a role, significantly reduced effective fares were a driving factor in ridership growth. (See Figure) Total subway and bus ridership increased 26 percent between 1996 and 1999; bus ridership jumped 72 percent in this period largely owing to the new free transfer policy. Second, average revenue per ride dropped. The combination of flat nominal fares, free transfers, new volume discounts, and unlimited passes lowered the average revenue per ride from $1.40 in 1996 to $1.09 in 1999. The combined effect of rising ridership and lower effective fares was decreased total fare revenue; in 1996 fare revenue was $2,157 million and in 1999 it was $2,118 million.
After the terrorist attacks of 2001 and a national recession, the MTA faced a financial squeeze. In 2002 average revenue per ride fell to $0.98 and total fare revenue remained below the 1996 figure. In May 2003, for the first time in eight years, fares increased. The base fare rose 33 percent from $1.50 to $2.00, but the volume discount increased from 10 percent to 20 percent, increasing the commonly paid fare from $1.35 to $1.60, or just less than 19 percent. The 7-day pass price increased 24 percent to $21 and the 30-day pass price increased 11 percent to $70. Average revenue per ride increased from $0.98 in 2002 to $1.17 in 2004, and modest increases in the price of the 7-day pass (to $24) and the 30-day pass (to $76) in 2005 brought the average revenue per ride to $1.22 in 2006.
However, higher fares still did not generate enough revenue to meet the MTA’s operating and capital expense needs. An agreement reached with the Governor and State Legislature in 2009 gave the MTA significant new revenue from a new payroll tax in the region and called for regular fare increases beginning in 2011 to yield 7.5 percent fare revenue gains every two years.4
The 2009 fare change increased the base fare from $2.00 to $2.25 with no change in the discount, while the 2011 change retained the $2.25 base fare but reduced the volume discount from 15 percent to 7 percent. Thus the discounted fare went from $1.70 in 2008 to $1.91 in 2009 and to $2.09 in 2011. The price of a 7-day pass rose from $25 to $27 in 2009 and to $29 in 2011; the 30-day pass went from $81 to $89 and then to $104 in those years. Average revenue per ride increased from $1.26 in 2008 to $1.56 in 2012.
The 2013 increase raised the base fare from $2.25 to $2.50 and lowered the volume discount from 7 percent to 5 percent, raising the commonly paid fare from $2.09 to $2.38. The price of a 7-day pass rose from $29 to $30 and a 30-day pass from $104 to $112. Average revenue per ride went from $1.56 in 2012 to $1.70 in 2014.
The fare increase effective this Sunday raises the base fare from $2.50 to $2.75. However, the volume purchase discount increases from 5 percent to 11 percent, limiting the increase in the discounted fare to 10 cents, from $2.38 to $2.48.5 The price of a 7-day card rises from $30 to $31 and a 30-day card from $112 to $116.50. Based on the new fares and discounts and the projected ridership, the average revenue per ride is projected at $1.77 in 2016, the first full year of the new fares, compared to $1.70 in 2014.6 Adjusting for inflation, the 2016 revenue per ride is 79 percent of the 1996 level.7
Capping Unlimited Passes as a Fair Revenue-Raising Option
The need for increased fare revenue need not be met exclusively through current practices of raising base fares and adjusting discounted prices. The MTA can generate revenue by capping the number of rides permitted on the 7-day and 30-day passes. Unlike recent fare increases hitting nearly every straphanger, the caps would provide needed revenue while affecting fewer riders, many who now enjoy very deep discounts, and would still retain heavily discounted fares.
Based on data provided by the MTA for October 2013, riders used 7-day passes for 45 million rides per month and 30-day passes for 66 million rides per month.8 These rides can be attributed to an estimated 2.8 million 7-day passes and 1.1 million 30-day passes.9 At a price of $30 the break-even number of rides for a 7-day pass was 13; for a 30-day pass at $112 the number was 48 rides. (Both calculations use the $2.38 fare available with a volume discount.) Rides above these numbers are effectively “free” for the passholder.
Each “free” ride represented $2.38 in foregone revenue assuming the unlimited passes were eliminated and passengers purchased volume discount rides instead. The monthly number of “free” rides on the unlimited passes is estimated at 28.4 million.10 This equals about $67 million in foregone revenue monthly, or $807 million annually. Since a significant share of unlimited pass purchasers does not actually use the cards enough to reach the break-even point, these “unused” rides are extra revenue for the MTA. If this extra revenue was also foregone, the net gain from eliminating the unlimited passes would be $619 million annually.
But eliminating unlimited passes would be a radical change, causing hardship for many straphangers and undermining the sense of convenient mobility the passes are intended to promote. A fairer strategy is to cap the number of rides on these passes at a number above the break-even point.
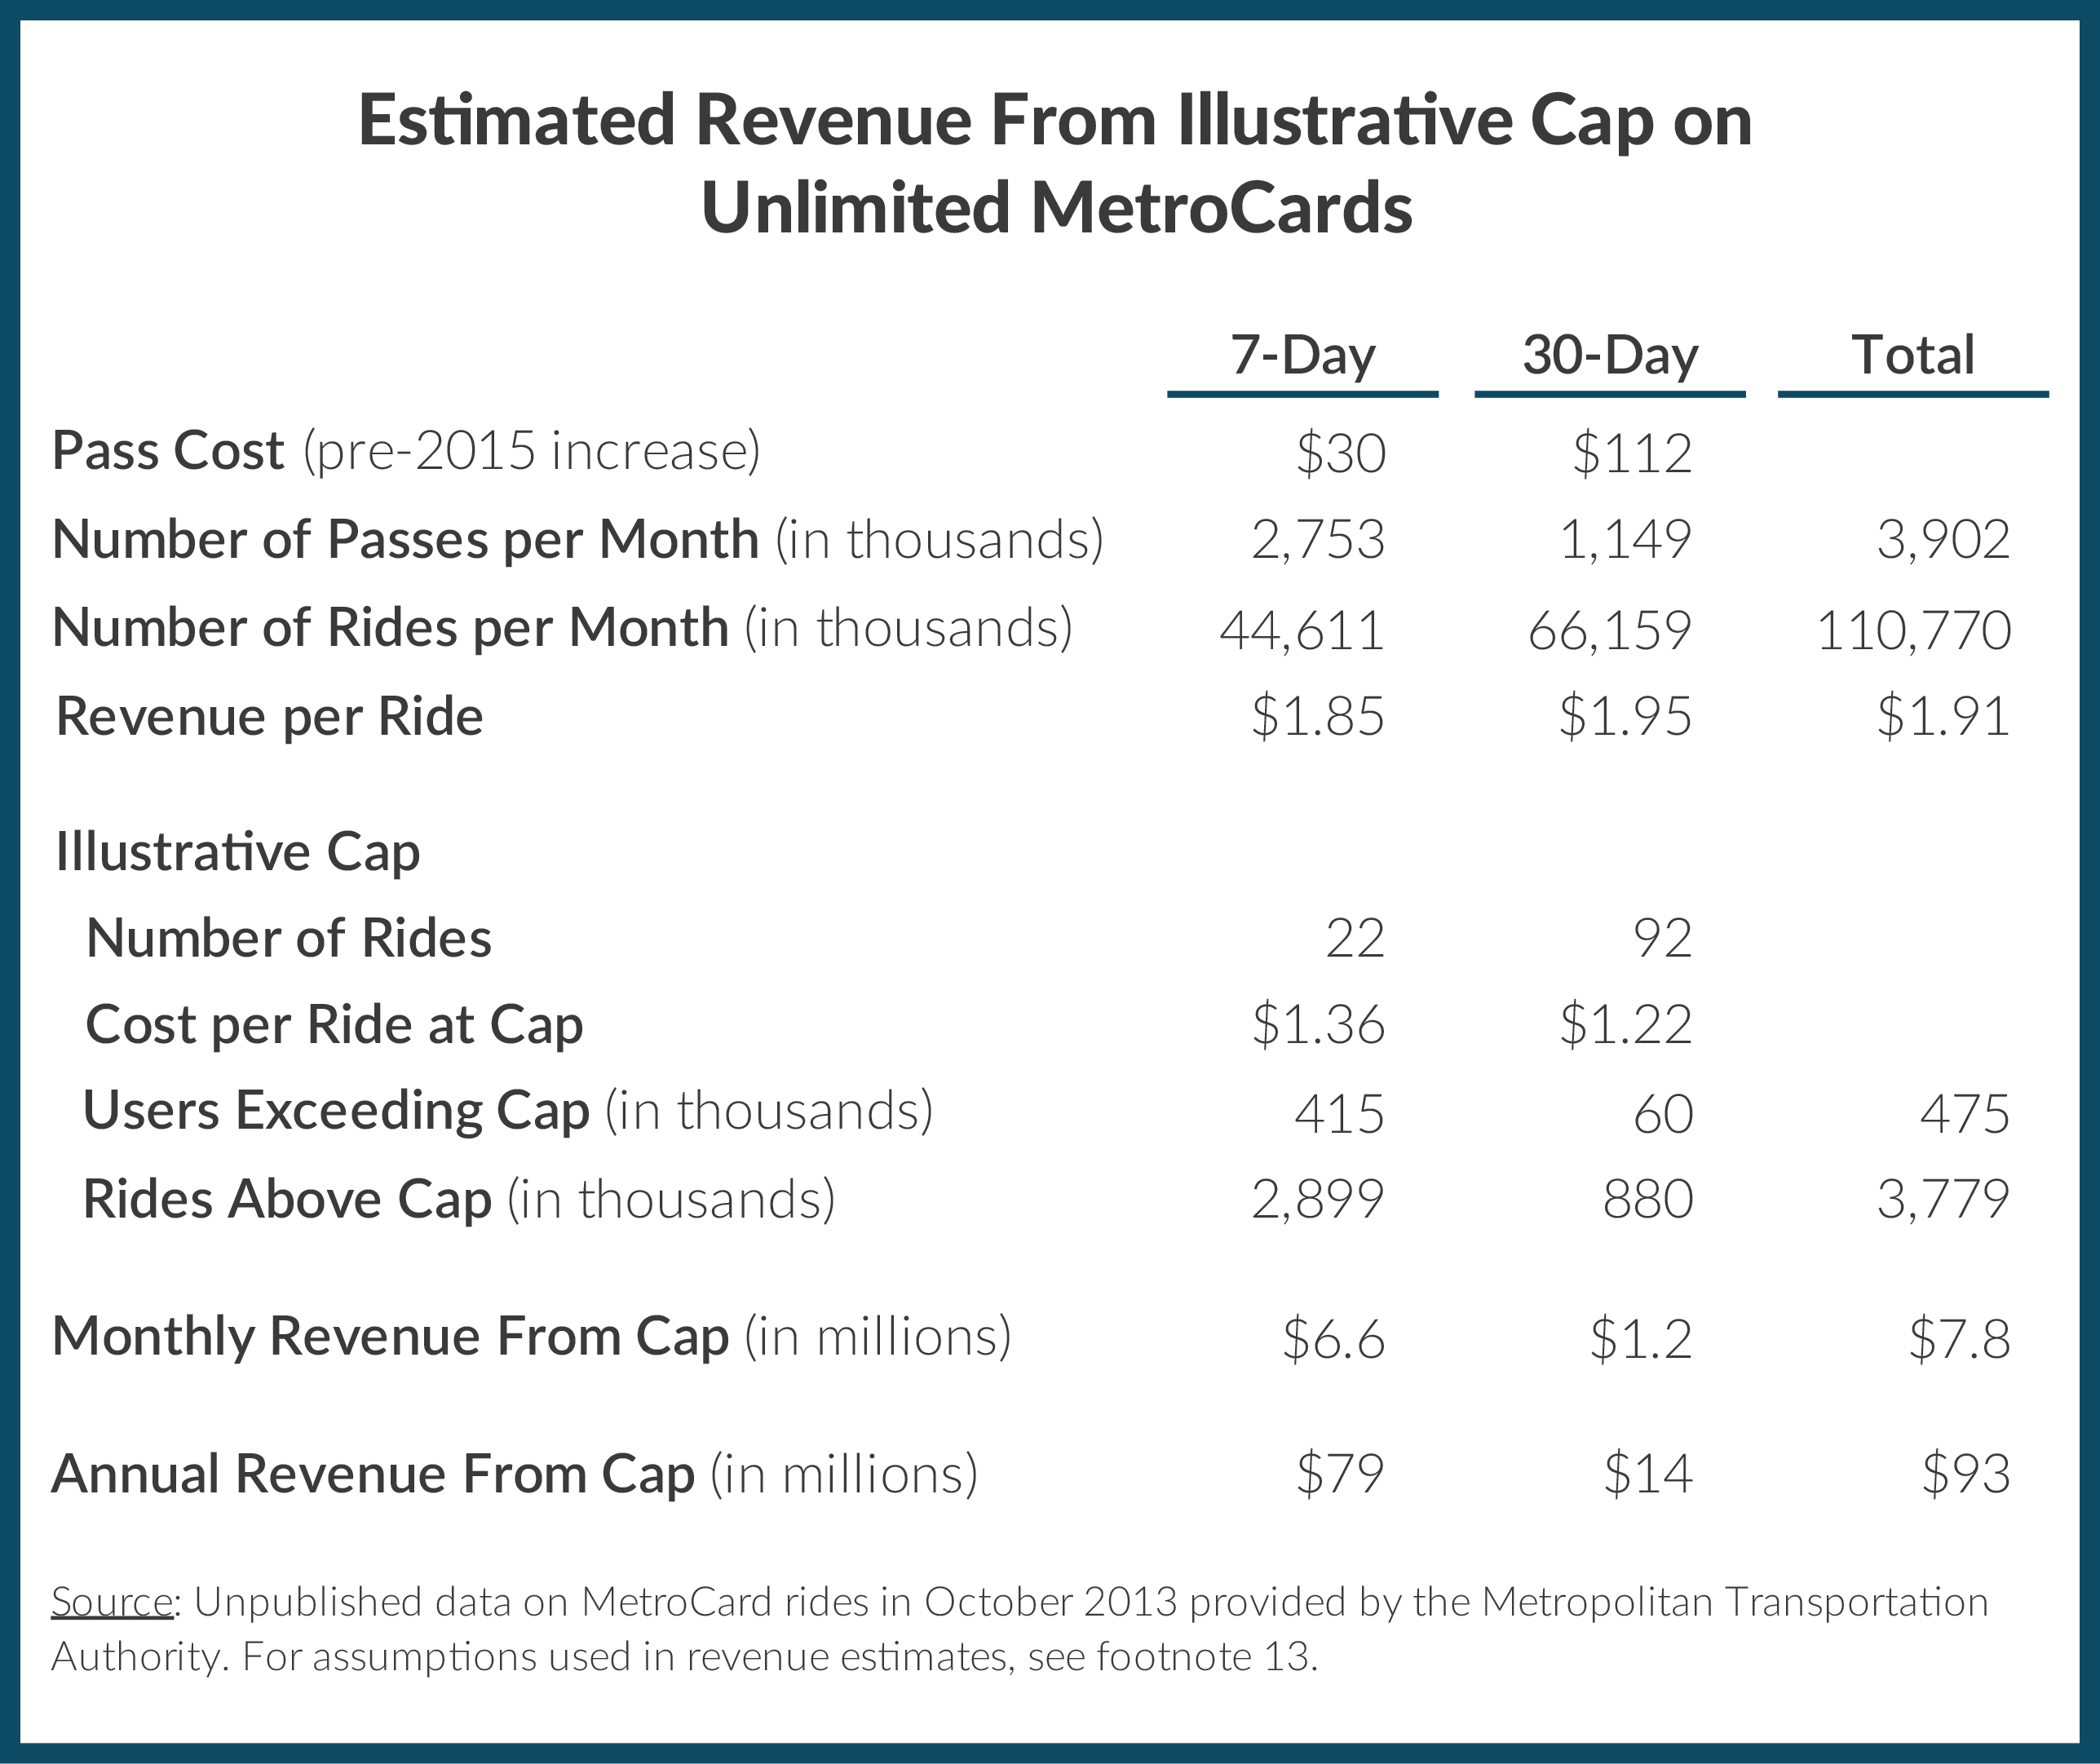
More information than is now publicly available about the ways high-volume passholders use the system should guide setting specific caps. Some available evidence indicates the unlimited passholders have higher incomes on average than other MetroCard users.11 Anecdotal evidence suggests abuses among unlimited card purchasers such as selling swipes and sharing passes among family members or employees may account for a meaningful share of the high-volume rides.12 Pending better information, the revenue impact of caps is appropriately estimated only with illustrative examples in order to gauge the general magnitude. Accordingly, the Table shows the revenue impact for illustrative caps set at 22 rides for the 7-day pass and 92 rides for the 30-day pass.
These caps would make unlimited passholders pay for an estimated 3.8 million rides per month that are now “free.” How these people would respond is uncertain and likely would vary between 7-day and 30-day passholders. Reasonable assumptions lead to an estimated average revenue per ride of $2.05.13 This would generate $7.8 million monthly or $93 million annually.
These potential revenue gains should be seen in the context of the MTA’s revenue target for its 2015 fare increase and the revenue needed for its 2015-2019 capital plan. The 2015 subway and bus fare increase is expected to yield an estimated $147 million annualized, and the funding gap for the proposed MTA capital plan is about $15 billion. The revenue from the illustrative caps on unlimited passes would provide 63 percent of the revenue from the latest fare increase. This could be used to lessen the increase in MetroCard prices or to support $1.5 billion in borrowing for the capital plan.14 Unlike general fare increases affecting nearly every straphanger, the caps would provide financial benefits while affecting only the relatively few riders who use their 7-day and 30-day passes most heavily and would still benefit from discounted fares.
Footnotes
- The 2015 fare and toll increases are expected to yield $260 million annualized across all MTA Agencies. New York City Transit Subway and Bus fare revenues constitute 57 percent of this increase or nearly $147 million. See: Metropolitan Transportation Authority, 2015 Adopted Budget, February Financial Plan 2015-2018 (February 2015), p. I-1, http://web.mta.info/mta/budget/pdf/MTA%202015%20Adopted%20Budget%20February%20Financial%20Plan%202015-2018.pdf.
- These discounts remain in place today. Senior citizen discount is 50 percent. Students may be eligible for a full fare student MetroCard or half fare student MetroCard, with the latter purchased by students and only used on bus trips. Both full fare and half fare student MetroCards are limited to three trips per day and must be used between 5:30 a.m. and 8:30 p.m. Eligibility is determined by a student’s grade and distance from residence to school. See: New York City Department of Education, “General Education Transportation” (accessed March 4, 2015), http://schools.nyc.gov/Offices/Transportation/ServicesandEligibility/BusTransportation/default.htm.
- Unlimited 1-day passes were available between 1999 and 2011, and unlimited 14-day passes were available between 2008 and 2011.
- Effective in 2013 the date of the fare change was moved from January 1 to mid-March. In 2014 the MTA reduced the revenue yield targets of future fare increases from 7.5 percent to 4 percent and reduced the goal for the 2015 increase from a 4 percent yield increase to a 4 percent price increase. See: Metropolitan Transportation Authority, 2013 Final Proposed Budget, November Financial Plan 2013-2016 (November 2012) pp. 8-9, http://web.mta.info/mta/budget/nov2012/November_2012_Financial_Plan_Vol_1.pdf, 2014 Adopted Budget, February Financial Plan 2014-2017 (February 2014), p. 8, http://web.mta.info/mta/budget/pdf/Adopted_Budget_February_Financial_Plan_2014-2017.pdf, and 2015 Final Proposed Budget, November Financial Plan 2015-2018 (November 2014), p. I-2, http://web.mta.info/news/pdf/MTA%202015%20Final%20Proposed%20Budget%20November%20Financial%20Plan%202015-2018%20Volume%201.pdf.
- The previous discount was 5 percent with a $5 or more purchase; the new discount is 11 percent with a $5.50 or more purchase.
- Metropolitan Transportation Authority, 2015 Adopted Budget, February Financial Plan 2015-2018 (February 2015), MTA Consolidated Utilization, p. III-1, http://web.mta.info/mta/budget/pdf/MTA%202015%20Adopted%20Budget%20February%20Financial%20Plan%202015-2018.pdf.
- Inflation-adjusted revenue per ride calculated using the nominal revenue per ride of $1.40 in 1996 and adjusting to the 2014 level of inflation for the New York region with an assumed inflation rate of 1.5 percent for 2015 and 2016. See: Bureau of Labor Statistics, “Consumer Price Index – All Urban Consumers” (accessed March 18, 2015), New York-Northern New Jersey-Long Island, NY-NJ-CT-PA, http://data.bls.gov/pdq/SurveyOutputServlet?data_tool=dropmap&series_id=CUURA101SA0,CUUSA101SA0.
- Numbers of rides in this data are “linked rides” which count as one ride a journey that includes a free transfer between a subway and bus (or bus and bus). This contrasts with the “ridership” data which count as separate rides each leg of a free transfer. See: Metropolitan Transportation Authority, New York City Transit Subway and Bus Committee, MetroCard Report, p. 7.1 (December 2013) http://web.mta.info/mta/news/books/archive/131216_1030_transit-bus.pdf.
- Number of passes calculated by dividing total trips by 16.1 for 7-day passes and 57.6 for 30-day passes. See: Independent Budget Office, letter to Gene Russianoff, Staff Attorney, NYPIRG Straphangers Campaign (August 27, 2013), Table: Average Fare per Trip by Fare Type, 2012, p. 4, www.ibo.nyc.ny.us/iboreports/2013straphangersletter.pdf.
- Data on distribution of rides by pass type is from the MTA for October 2013. Estimates use even levels for each point within distributions for intervals provided. For the highest category on 7-day passes 60 rides is assumed. For the highest category on 30-day passes 180 rides is assumed. The assumptions are based on a normal distribution for the upper tail.
- Pete Donohue, “Low-income MetroCard users taking advantage of discount offerings despite upfront costs: report,” New York Daily News (October 15, 2012), www.nydailynews.com/new-york/uptown/low-income-metrocard-users-advantage-discounts-article-1.1183671.
- Pete Donohue, “MTA going to great lengths in stopping subway scammers,” New York Daily News (May 7, 2012), www.nydailynews.com/new-york/mta-great-lengths-stopping-subway-scammers-article-1.1073419.
- The very high-volume 7-day passholders presumably have such high volumes only episodically; if they repeatedly had such high volumes they would be better off buying 30-day passes. Accordingly, the revenue estimate in the Table assumes that under the cap most (90 percent) of these rides are paid for at the 5 percent discount price of $2.38 with only the remaining portion paid for with another 7-day pass with each ride costing the user $1.36. In contrast, a substantial share of high-volume 30-day passholders is likely to have high monthly volumes repeatedly. Accordingly it is assumed that 90 percent of the affected rides on 30-day passes are shifted to a new 30-day pass at an average price per ride of $1.22 and only the remainder is paid for at the $2.38 price.
- Assumptions based $93 million annual debt service payment to support borrowing at a 4.5 interest rate on a 30-year repayment schedule.