The MTA’s Preliminary 2017 Budget: Good News Now, But Risks Down the Track
In late July the Metropolitan Transportation Authority (MTA) released its $15.5 billion 2017 Preliminary Budget and four-year financial plan. The Preliminary Budget reaps the benefits of predictable, incremental fare and toll increases and an aggressive savings program begun in 2009. These benefits include projected surpluses and cash balances that will be used to make $1.1 billion in pay-as-you-go (PAYGO) capital investments. While such investments are a prudent use of surpluses, the MTA expects to exhaust its cash balances by 2020.1 In that year the agency projects an adjusted cash deficit of $113 million and the depletion of its cash balances, but the plan includes some resources tentatively committed to capital upon which it could draw.2
Longer-run problems may not be limited to disappearing surpluses and exhausted cash balances. The MTA’s preliminary budget also frames concerns in 2017 and beyond, including economically sensitive tax receipts, expiring labor contracts, and unfunded long-term liabilities.
2017 Outlook
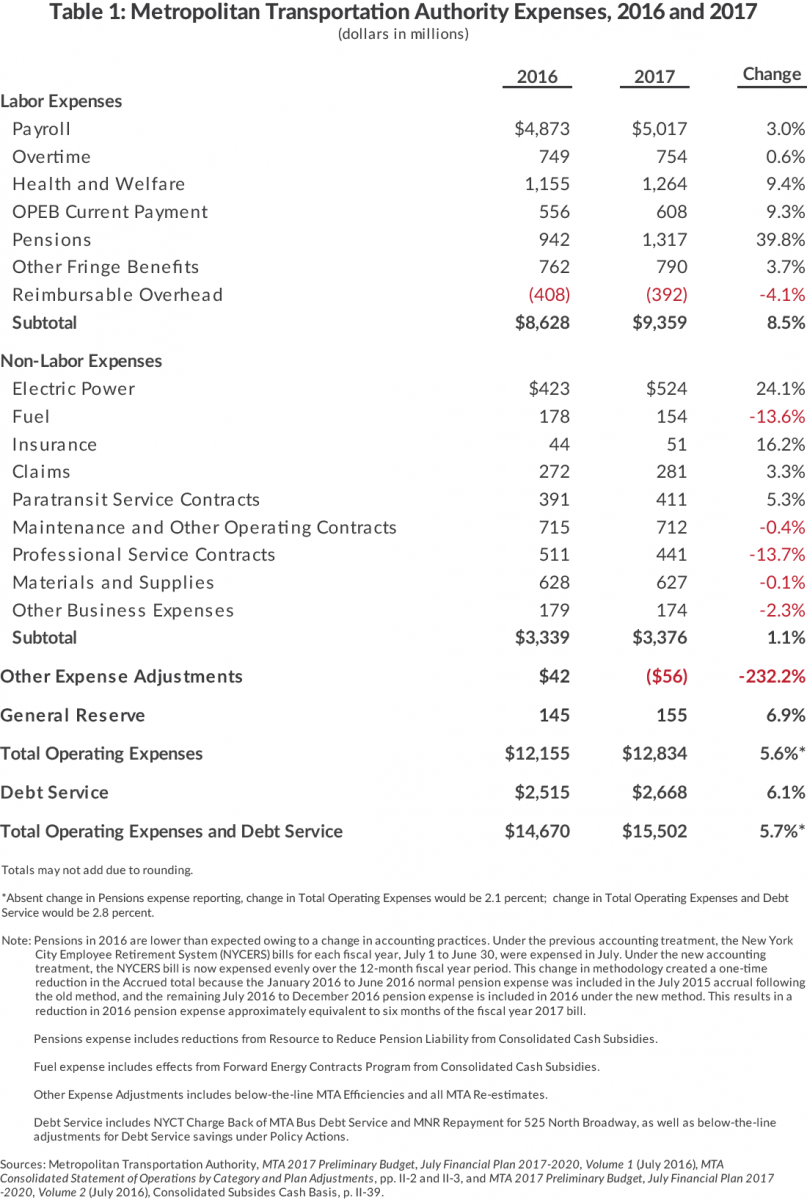
The MTA expects to spend $15.5 billion in 2017.3(See Table 1.) More than 60 percent of the expenses are for labor, and this spending is up 8.5 percent, or $730 million. Only a fraction of the increase, about $45 million, is attributable to the new service anticipated on the Second Avenue subway line.4 A major reason is a jump in pension costs, related to a one-time reduction in 2016 due to accounting rule changes in the calculation of the contributions; without this accounting anomaly, the increase in labor expense would have been only 3.5 percent, or $320 million, and the increase in total expense would be 2.1 percent.5 Health and welfare benefit costs for employees and retirees increase at near double digit rates. Debt service is more than one-sixth of total spending; it increases 6.1 percent, or $153 million, as the MTA continues to borrow heavily to finance its capital program.6 This increase is necessary despite changes from previous financial plan assumptions that include lower anticipated interest rates, savings from the Hudson Yards lease securitization project, and reduced borrowing needs due to more PAYGO funding in the agency capital program; absent these changes 2017 debt service would be $93 million higher.7 In contrast, other non-labor expenses increase only 1.1 percent, or $36 million, with savings expected in professional service contracts, lower fuel costs, and other items.8 The biggest increase in this category is for electric power due to expected price increases from the current “cheap energy” environment.
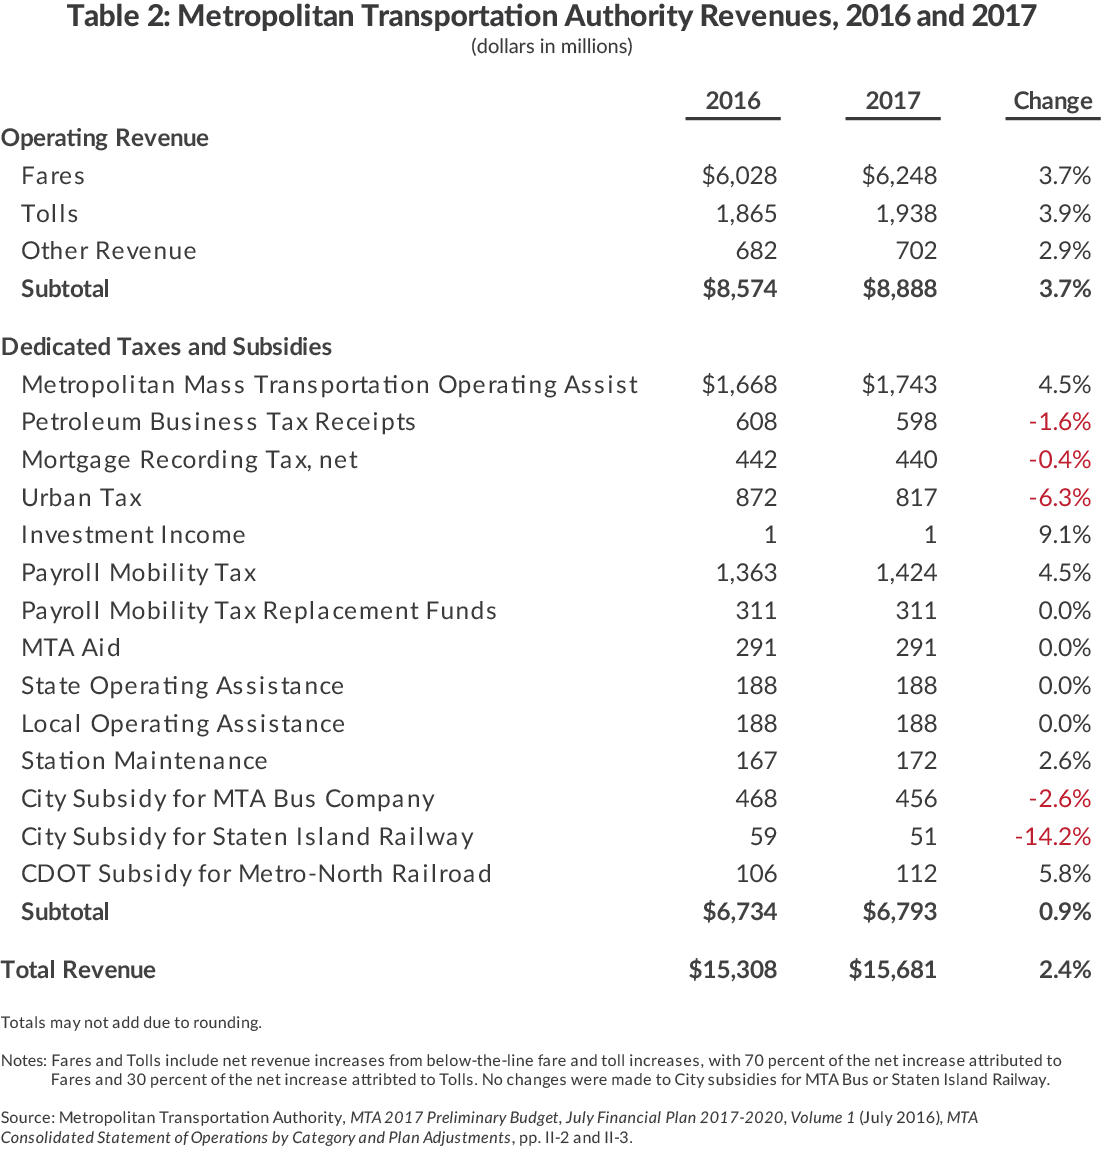
The 2017 Preliminary Budget expects $15.7 billion in total revenue, a 2.4 percent increase over 2016. (See Table 2.) About $8.9 billion—more than half the total—is operating revenue, primarily fares and tolls. These revenues are expected to increase 3.7 percent in 2017 due largely to planned fare and toll increases of 4 percent to be implemented in March 2017.9 Ridership on the subways and commuter railroads and bridge and tunnel crossings are expected to continue longer-term trends of increases, although the exceptionally large increase in subway ridership in recent years is expected to slow.
The remaining $6.8 billion in revenues comes from taxpayer subsidies, mostly in the form of dedicated taxes collected by the State of New York and appropriations from the general funds of the states of New York and Connecticut and of local governments in the region including the City of New York. The MTA projects all dedicated taxes and subsidies to grow less than 1 percent in 2017. The two largest dedicated taxes are Metropolitan Mass Transportation Operating Assistance (MMTOA), which consists mostly of dedicated sales and corporate income taxes, and the Payroll Mobility Tax (PMT); each is expected to increase 4.5 percent consistent with trends in their respective bases.10 The two large real estate related taxes, the Mortgage Recording Tax and the Urban Tax, a tax on real property transfers, are expected to decline in 2017 because the previous period has been one of unusually rapid growth in a booming real estate market.11

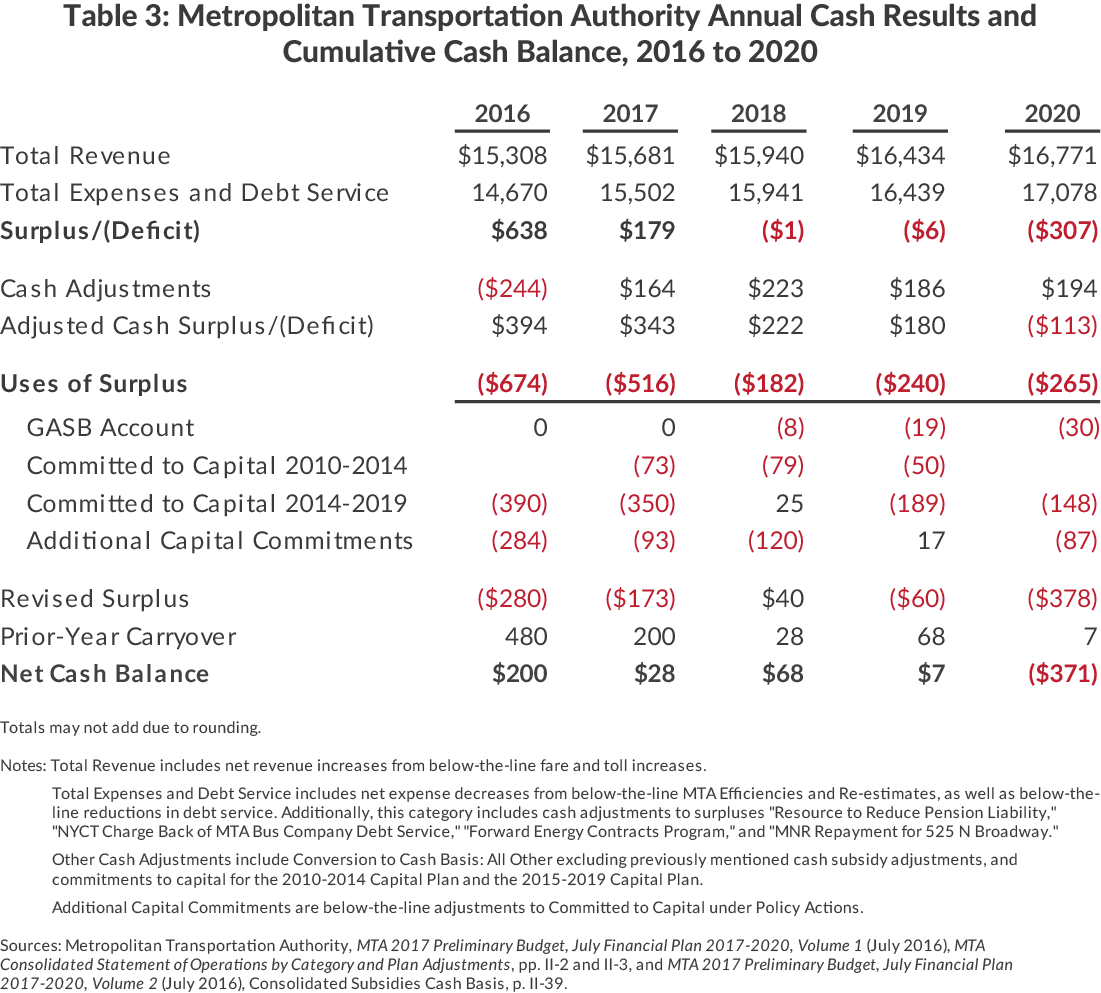
The preliminary budget projections of expenses and revenues yield surpluses of $638 million in 2016 and $179 million in 2017. (See Table 3.) The MTA budgets on a cash basis, so these sums are adjusted for differences between cash and accrual methods of accounting. Typically these adjustments increase available cash because some expenses are not fully paid in the given year; however, 2016 is unusual because changes in the accounting treatment of pension fund contributions and the associated adjustment reduced available cash by $244 million. The resulting adjusted cash surpluses are $394 million in 2016 and $343 million in 2017. When combined with the 2015 end-of-year cash balance of $480 million, the two years of surpluses provide the MTA with just over $1.2 billion in available cash.
The preliminary budget allocates nearly all this available cash to PAYGO funding of capital projects, leaving a cash balance at the end of 2017 of just $28 million.12
Financial Plan Comes With Considerable Risks
In the years after 2017 the financial plan projects deficits that grow from $1 million in 2018 to $307 million in 2020. This suggests the MTA plan to continue to fund about $200 million annually in PAYGO capital may be unsustainable. Doing so would fully exhaust the cash reserves and create a negative $371 million cash balance in 2020. (Refer to Table 3.)
All financial plans include risks. Three noteworthy examples in the MTA’s July 2016 financial plan include falling tax receipts, expiring labor contracts, and unaddressed postemployment benefit liabilities.13
Falling tax receipts. The MTA projects tax and subsidy growth in 2017 of 0.9 percent and average annual growth of 2.1 percent over the financial plan.14 This change nets out falling or flat real estate tax revenue projections with continued growth in PMT and MMTOA receipts, of which nearly 95 percent are taxes on payrolls and sales and surcharges on corporate taxes in the MTA region.15 However, recent reports from the New York State Division of the Budget and Office of the State Comptroller may foretell reductions in each of these sources. The State’s first quarter update to the financial plan lowered the 2017 personal income tax collection projection $600 million, or 1.2 percent.16 Perhaps more concerning are year over year decreases in personal income tax receipts (4.3 percent) and corporate tax receipts (10.6 percent) through the first quarter of the State fiscal year.17 While these reports highlight changes in statewide collections for taxes that are related to—but differ from—certain MTA dedicated taxes, underlying conditions may affect the transit agency's non-operating revenues as well.
Moreover, these variances are only for the first quarter of the State fiscal year, June through August, and collections may accelerate in subsequent quarters to make up for these shortfalls. It is also possible that trends affecting the entire state may be less pronounced in the MTA region, where PMT and MMTOA taxes are collected. On the other hand, collections may further slow, placing additional fiscal stress on the agency.18
Expiring Labor Contracts. In 2014 MTA management settled contracts with the majority of its unionized workforce. Most of these agreements expire in 2017, and the financial plan assumes annual 2 percent net increases in wages beginning in 2017, an assumption that presumes continuing the pattern of the 2014 agreed-upon wage increases between the MTA and the union representing most bus and subway employees.19 This is a reasonable assumption; however, based on prior collective bargaining agreements and arbitration rulings, higher wage increases could be possible.
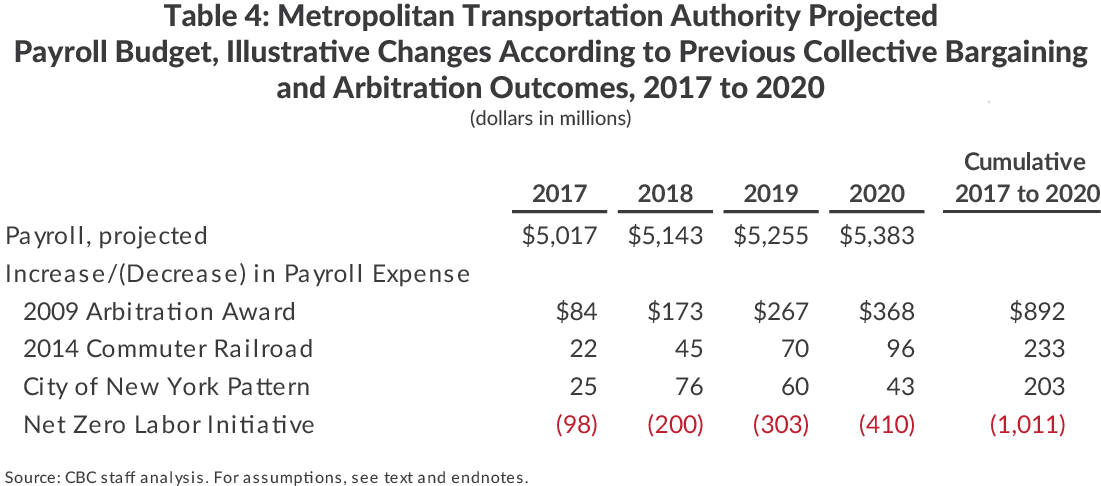
For example, during the round of collective bargaining for contracts covering the 2009 to 2012 period, an impasse resulted in arbitration with the Public Employment Relations Board.20 In that case the arbitration panel compelled the MTA to provide wage increases averaging 3.7 percent annually over the four-year period.21 An outcome of similar magnitude could lead to an $84 million increase in payroll expense in 2017 and an $892 million cumulative increase over the financial plan period.22 (See Table 4.) Labor may also point to the agreement reached between the commuter railroad employee union coalition and the MTA in 2014 as a model for wage increases. Under that agreement, the MTA increased wages 2.45 percent annually on average.23 Such an outcome would lead to a $22 million increase in payroll expense in 2017 and $233 million over the financial plan and leave the agency with a cash balance of only $6 million at the end of 2017.
Another plausible outcome to this round of collective bargaining would provide increases similar to the pattern established for City employees. As arbitrators often consider wage increase or benefit changes negotiated by other public sector unions, comparison to the municipal workforce is appropriate.24 Under this assumption, the outcome for payroll expense would increase $25 million in 2017 and $203 million over the financial plan.25
These scenarios anticipate labor costs grow faster than the MTA now assumes, but in the past the MTA has sought changes to work rules and other fringe benefits in order to keep labor costs constant over the life of a contract. In 2012 the MTA began the Net-Zero Labor Initiative, which assumed its pending labor settlement would maintain labor costs by offsetting wage increases with work rule changes or productivity improvements. The initiative mirrored the contract agreements between New York State and its two largest unions, the Civil Service Employee Association and the Public Employees Federation.26 If the MTA revived such an initiative, the agency would save $98 million in 2017 and more than $1 billion through 2020, taking the MTA from a negative cash balance of $371 million in 2020, after adjustments, to a positive cash balance of $640 million.
OPEB Liabilities. Like many other public sector employers, the MTA offers benefits to attract and retain qualified workers including pensions and what are known as other postemployment benefits (OPEB). At the MTA, OPEB is made up primarily of health insurance for retirees, which is subject to collective bargaining.
Also like many other public sector employers, the MTA uses a deferral strategy for its OPEB obligations. Accounting standards oblige the MTA to recognize the full cost of its obligation to pay for health insurance of future retirees, but the agency does not fully fund this cost.27 Instead the MTA pays for the current cost of retiree health insurance, listed in the financial plan as OPEB Current Payment and totaling $608 million in 2017. While the MTA has made varying annual deposits to trust funds tasked with supporting OPEB obligations, these deposits were suspended in order to pay for the last round of collective bargaining agreements, to resume again in 2018. The MTA is in the minority of public sector entities addressing this issue with funding of any size; however, the $57 million planned for deposits from 2018 to 2020 will be overwhelmed by the total size of the obligation.28 As of March 31, 2016 the MTA’s OPEB liability was nearly $14 billion.29 According to agency financial statements, the MTA’s assets for OPEB are less than 2 percent of the total outstanding liability.30
Not fully funding OPEB liabilities can be justified as a reasonable fiscal strategy. The MTA has sought reductions in OPEB funding obligations by requiring current and future retirees to share the cost of health insurance premiums. Such cost-sharing would reduce total obligations and lower OPEB liability; however, even if the MTA and its labor partners could agree on this change, unfunded liabilities would still far exceed the resources in the agency’s trust funds.
Conclusion
Before the MTA leadership places a final budget proposal before the board in November, they should prepare a plan to fund PAYGO capital contributions without exhausting cash balances, adjust financial projections to better reflect foreseeable risks, and set aside additional resources for the agency’s OPEB trust fund.
As previous CBC analyses demonstrate, these goals, and establishing a base for future capital programs, likely will require a new source of revenue for the MTA. New revenue should come primarily from cross-subsidies from motor vehicle users with desirable options including higher tolls, gasoline taxes, and license and registration fees, as well as a new vehicle-miles traveled fee.31 MTA leadership should continue and intensify its efforts to identify and implement efficiencies, but securing the likely needed revenues will require advocacy from within and outside the agency.
Footnotes
- The MTA budgets a 1 percent General Reserve in every year’s operating budget. The financial plan assumes the General Reserve is consumed each year, adhering to the MTA board’s policy of consuming the General Reserve to reduce the Long Island Rail Road unfunded pension liability. If the board chose to retain the General Reserve each year over the life of the financial plan, the amount would total $795 million through 2020, enough to offset the projected net cash deficit. See: Metropolitan Transportation Authority, MTA 2017 Preliminary Budget, July Financial Plan 2017-2020 (July 2016), Volume I, MTA Consolidated Statement of Operations by Category, p. II-2, http://web.mta.info/mta/budget/.
- The July Financial Plan proposes an additional $566 million in Committed to Capital as part of a policy action within the below-the-line adjustments. This funding is not currently included or required for the MTA’s 2015-2019 Capital Program, and could be used for future capital plans or for other purposes if necessary.
- This total also includes an offset to account for Reimbursable Overhead, a component of labor expense.
- Metropolitan Transportation Authority, MTA 2017 Preliminary Budget, July Financial Plan 2017-2020 (July 2016), Volume II, Operating Budget Impacts of Capital “Mega” Projects, p. II-10, http://web.mta.info/mta/budget/.
- Director of Management and Budget, Metropolitan Transportation Authority, email to Citizens Budget Commission staff (September 13, 2016).
- Metropolitan Transportation Authority, MTA 2017 Preliminary Budget, July Financial Plan 2017-2020 (July 2016), Volume I, MTA Consolidated Statement of Operations by Category, p. II-2, http://web.mta.info/mta/budget/.
- In June 2016 the MTA board authorized a bond offering to monetize a portion of the 99-year lease payments from Hudson rail yards real estate development. See: Paul Burton, “N.Y. MTA Expects to Save $152M in Hudson Yards Sale,” The Bond Buyer (July 27, 2016), www.bondbuyer.com/news/regionalnews/ny-mta-expects-to-save-152m-in-hudson-yards-sale-1109524-1.html; and Metropolitan Transportation Authority, MTA 2017 Preliminary Budget, July Financial Plan 2017-2020 (July 2016), Volume I, Plan Adjustments, p. II-3, http://web.mta.info/mta/budget/.
- The MTA hedges a portion of its fuel expense through the Forward Energy Contracts Program to reduce budgetary risk from price volatility. As this program is intended to smooth the financial impacts of fuel price changes and not to achieve financial savings, this analysis includes the program’s fiscal impacts, positive and negative, with MTA’s consolidated fuel expense. See: Metropolitan Transportation Authority, MTA 2017 Preliminary Budget, July Financial Plan 2017-2020 (July 2016), Volume II, p. II-56, http://web.mta.info/mta/budget/.
- Metropolitan Transportation Authority, MTA 2017 Preliminary Budget, July Financial Plan 2017-2020 (July 2016), Volume I, Plan Adjustments, p. II-3, http://web.mta.info/mta/budget/.
- MMTOA consists of taxes on petroleum businesses statewide, a share of taxes on transportation and transmission companies imposed statewide, a three-eighths of 1 percent sales and use tax imposed in the MTA service region, and a surcharge on corporate taxes imposed on businesses operating in the MTA region. PMT is a payroll tax on all employers in the MTA region. The MTA region includes New York City and Dutchess, Nassau, Orange, Putnam, Rockland, Suffolk, and Westchester counties. Urban Tax consists of a Mortgage Recording Tax and a Real Property Transfer Tax on selected commercial properties in New York City. See: Metropolitan Transportation Authority, MTA 2017 Preliminary Budget, July Financial Plan 2017-2020 (July 2016), Volume II, pp. II-41-II-42 and II-50-II-53, http://web.mta.info/mta/budget/.
- Metropolitan Transportation Authority, MTA 2017 Preliminary Budget, July Financial Plan 2017-2020 (July 2016), Volume II, Consolidated Subsidies, p. II-37, http://web.mta.info/mta/budget/.
- Metropolitan Transportation Authority, MTA 2017 Preliminary Budget, July Financial Plan 2017-2020 (July 2016), Volume I, pp. I-1-II-2, http://web.mta.info/mta/budget/.
- This does not imply the MTA cannot address such risks; however, doing so may place other resources at risk, such as PAYGO capital contributions or OPEB trust fund resources, or require additional fare and toll increases or service cuts.
- Metropolitan Transportation Authority, Preliminary Budget, July Financial Plan (annual editions 2011 to 2016), Volume II, Consolidated Subsidies, http://web.mta.info/mta/budget/.
- The 2016 July Financial Plan forecast for MMTOA is based on State appropriation for 2016 and growth projections provided from New York State for 2017 through 2019.
- New York State Division of the Budget, FY 2017 Financial Plan First Quarterly Update (August 2016), Summary of Revisions to Enacted Budget Financial Plan, p. 11, http://publications.budget.ny.gov/budgetFP/enacted1617.html.
- Office of the New York State Comptroller, “July Monthly Cash Basis Report” (August 2016), www.osc.state.ny.us/finance/cbr.htm.
- A policy brief by the Citizens Budget Commission explores the implications of a simulated recession on the MTA’s finances and estimates a multiyear loss of about $1.5 billion or 2.4 percent of its total revenues. This brief is not intended as either a projection or a critique of the financial plan but as an illustration of the economic sensitivity to the current revenue base. See: Jamison Dague and Charles Brecher, Recessions and Revenues: The Case of the MTA, (Citizens Budget Commission, December 2015), www.cbcny.org/content/recessions-and-revenues-case-mta.
- This agreement called for retroactive 1 percent annual wage increases at the beginning of 2012, 2013, and 2014, as well as 2 percent annual wage increases in 2015 and 2016. See: Metropolitan Transportation Authority, MTA 2017 Preliminary Budget, July Financial Plan 2017-2020 (July 2016), Volume I, p. I-5, http://web.mta.info/mta/budget/; and Memorandum of Understanding Between Transport Workers Union Local 100 and Metropolitan Transportation Authority (April 2014), p. 1, www.twulocal100.org/sites/twulocal100.org/files/finalmemorandumofunderstanding_0.pdf.
- New York State Employment Relations Act, Labor Law Article 20, http://public.leginfo.state.ny.us/lawssrch.cgi?NVLWO:. See: Maria Doulis and Rahul Jain, MTA-TWU Wage Negotiations: A “Fair Increase” Will Not Increase Fares (Citizens Budget Commission, January 2012), p. 1, www.cbcny.org/sites/default/files/REPORT_TWU_01302012.pdf.
- The decision included wage increases of 2 percent each in April 2009, October 2009, April 2010, and October 2010, as well as a wage increase of 3 percent in January 2011. Additionally, the panel limited the employee health care contribution to 1.5 percent and allowed for the reduction in force of Station Maintainer Helper. The net effect was an increase in base labor costs of 11.771 percent. See: State of New York Public Employment Relations Board, In the Matter of the Impasse Between Metropolitan Transportation Authority, Public Employer, versus Transport Workers Union Local 100, Employee Organization, Opinion and Award, PERB Case No. TIA2008-021 and TIA2008-022 (August 11, 2009), www.twulocal100.org/sites/twulocal100.org/files/TIA2008-021-022.pdf.
- The MTA has indicated its 2 percent assumption is typically interpreted as a net increase, meaning the agency could use other savings within the contract—from work rule changes, for example—to offset labor rate increases in excess of 2 percent. Such changes would affect illustrated changes in payroll expense in Table 4.
- Metropolitan Transportation Authority, “Governor Cuomo Announced Labor Agreement Between MTA and LIRR” (press release, July 17, 2014), www.mta.info/news-lirr-long-island-rail-road-strike-labor-unions-governor/2014/07/17/governor-cuomo-announces.
- Maria Doulis and Rahul Jain, MTA-TWU Wage Negotiations: A “Fair Increase” Will Not Increase Fares (Citizens Budget Commission, January 2012), p. 7, www.cbcny.org/sites/default/files/REPORT_TWU_01302012.pdf.
- The City pattern calls for wage increases of 2.5 percent in 2017 and 3 percent in 2018. For 2019 and 2020, calculation uses the average wage increases over the life of the City pattern of 1.66 percent. See: City of New York, Office of the Mayor, “Mayor de Blasio, UFT Reach Preliminary Agreement on 9-year Contract Ushering in Key New Reforms and Savings” (press release, May 1, 2014), www1.nyc.gov/office-of-the-mayor/labor-contracts.page.
- Metropolitan Transportation Authority, MTA 2012 Adopted Budget, February Financial Plan 2012-2015 (February 2012), pp. 6-7, http://web.mta.info/mta/budget/.
- Charles Brecher and Rahul Jain, A Better Way to Pay for the MTA (Citizens Budget Commission, October 2012), pp. 7-8, www.cbcny.org/content/better-way-pay-mta.
- Metropolitan Transportation Authority, MTA 2017 Preliminary Budget, July Financial Plan 2017-2020 (July 2016), Volume I, MTA Consolidated Statement of Operations by Category, p. II-2, http://web.mta.info/mta/budget/.
- Metropolitan Transportation Authority, Consolidated Interim Financial Statements as of and for the Three-Month Period Ended March 31, 2016 (June 2016), p. 84, http://web.mta.info/mta/budget/.
- Metropolitan Transportation Authority, Consolidated Interim Financial Statements as of and for the Three-Month Period Ended March 31, 2016 (June 2016), p. 84, http://web.mta.info/mta/budget/.
- Jamison Dague, More Than Fare: Options for Funding Future Capital Investments by the MTA (Citizens Budget Commission, March 2015), www.cbcny.org/content/more-fare-options-funding-future-capital-investments-mta.


