Should New York's REDCs REDO Their Plans?
This week the 10 Regional Economic Development Councils (REDCs) created by Governor Andrew Cuomo in 2011 will receive their sixth round of economic development awards. Nearly $4 billion of tax breaks and grants have been awarded through the REDCs to date, and $750 million more is available this year. 1 REDCs created five-year strategic plans in 2011 that laid out priorities and strategies for fostering employment growth, and they now are requesting funding to continue to support industries identified in those plans. Therefore, it is instructive to review how the regional economies have performed in industries targeted for growth.
Two findings emerge:
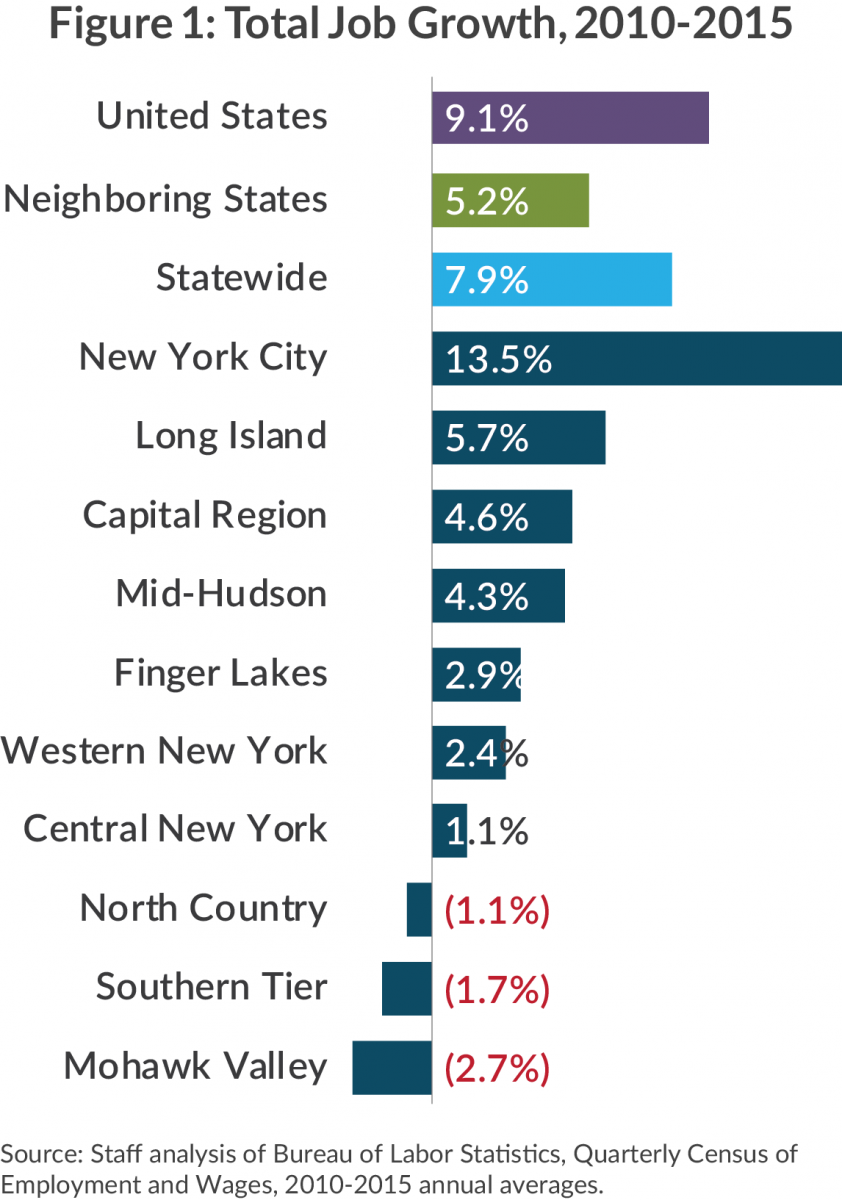
- Total employment growth varied widely across the regions—from a decline of 2.7 percent in the Mohawk Valley to an increase of 13.5 percent in New York City—but 8 of 10 regions trail job growth in neighboring states (5.2 percent) and the nation (9.1 percent). Only New York City surpassed national average growth between 2010 and 2015, and Long Island surpassed the average in neighboring states.
- REDCs were remarkably consistent in their industry emphasis: manufacturing was universally emphasized, 9 of the 10 REDCs focused on tourism and agriculture, and 8 of the 10 focused on technology and health care. Performance, however, varied: 6 of 10 regions lost manufacturing jobs and 3 of 8 lost technology jobs. All regions gained jobs in the other sectors, but few outperformed both neighboring states and the nation.
The results suggest it may be time to for REDCs to rethink their strategies.
Big Picture
REDCs were created to stimulate regional economies by bringing local stakeholders together to develop strategic plans and priorities based on their understanding of regional strengths and needs. To assess their progress, CBC staff analyzed employment data from the Bureau of Labor Statistics’ Quarterly Census of Employment and Wages for calendar years 2010 to 2015, the most recent year for which annual county-level employment figures are available.2 To benchmark performance, the regions are compared to each other, to neighboring states, and to the national average. Neighboring states are those that share a border with New York: Connecticut, Massachusetts, New Jersey, Pennsylvania, and Vermont. The benchmark is the weighted mean of these states’ change in employment.
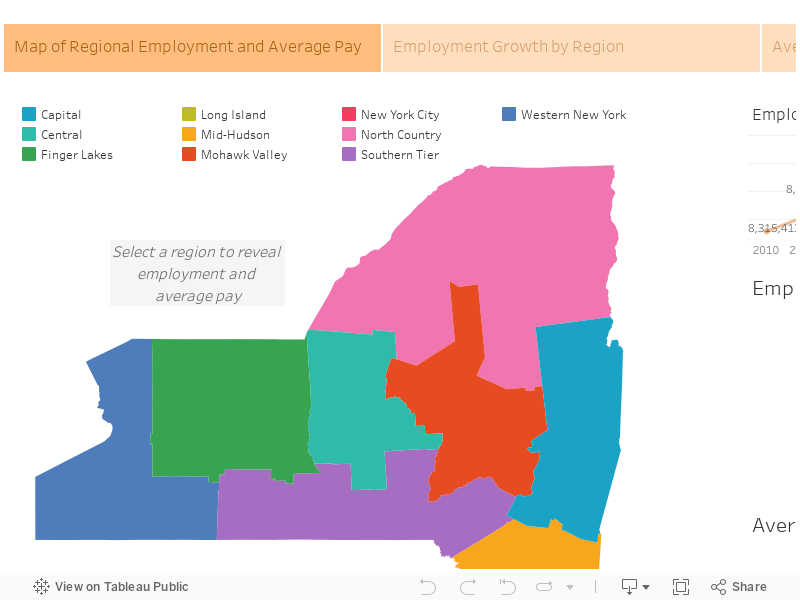
Total employment in New York State grew 7.9 percent. The State added 656,801 jobs for a total of almost 9 million in 2015. The statewide figure is largely influenced by the performance of New York City, which constitutes 45.2 percent of total employment in the state, and conceals wide variation in performance among the regions. To explore the performance of each regional economy in more detail, see our interactive map.
Employment growth varied from a 13.5 percent increase in New York City to a 2.7 percent decline in the Mohawk Valley. From 2010 to 2015, employment growth in eight regions trailed that of neighboring states and the nation. National employment growth was 9.1 percent, a rate only New York City surpassed. The concentration of jobs downstate buoyed the statewide average (7.9 percent), allowing New York State to outperform its neighbors (5.2 percent). Eight of the other nine regions, however, grew more slowly than neighboring states.
REDC Focus on Industries
REDCs formulate regional strategies based on local strengths, development potential, and goals. Despite the variety in regional economies, five industries were consistently emphasized in REDCs plans. In almost all cases, in 2016 the REDCs continued to focus on the industries originally identified in 2011 as part of the strategic plans.3
Gaining manufacturing employment was a goal shared by all 10 of the REDCs. Tourism and agriculture were each prioritized by every region except New York City. Technology, including biotech, IT, cybersecurity, and other types of information and professional services, was a focus for every region except the Southern Tier and Western New York. Health care was emphasized by every region except New York City and the Mohawk Valley.
Performance was mixed in manufacturing and technology, with 6 of 10 regions losing manufacturing jobs and 3 of 8 regions losing tech jobs. Gains were made universally in the other sectors, with strongest gains in tourism and agriculture, two sectors with relatively low average wages. Our interactive graphic also shows each region’s performance by sector, and we describe performance on the five most focused-on industries below.
Manufacturing
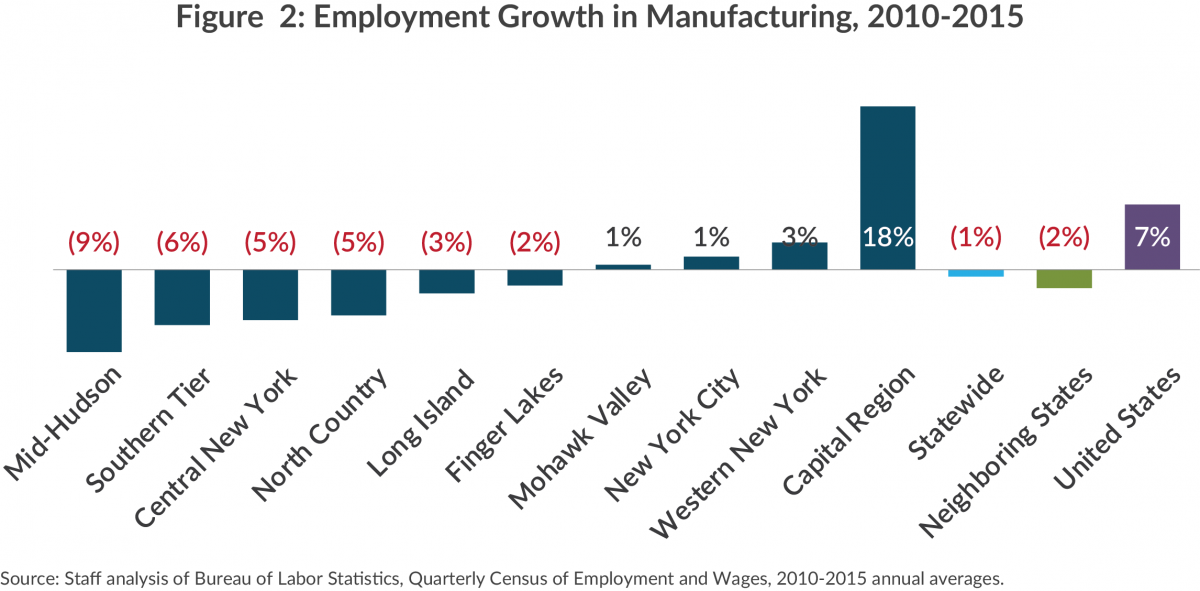
In 5 regions, manufacturing is the highest-paying sector, with statewide average pay of $65,000; however, manufacturing employment declined in 6 of the 10 regions and 0.7 percent statewide. The Capital region is the only one with strong employment growth, 17.5 percent, driven by advanced manufacturing in semiconductors and nanotechnology.
Technology
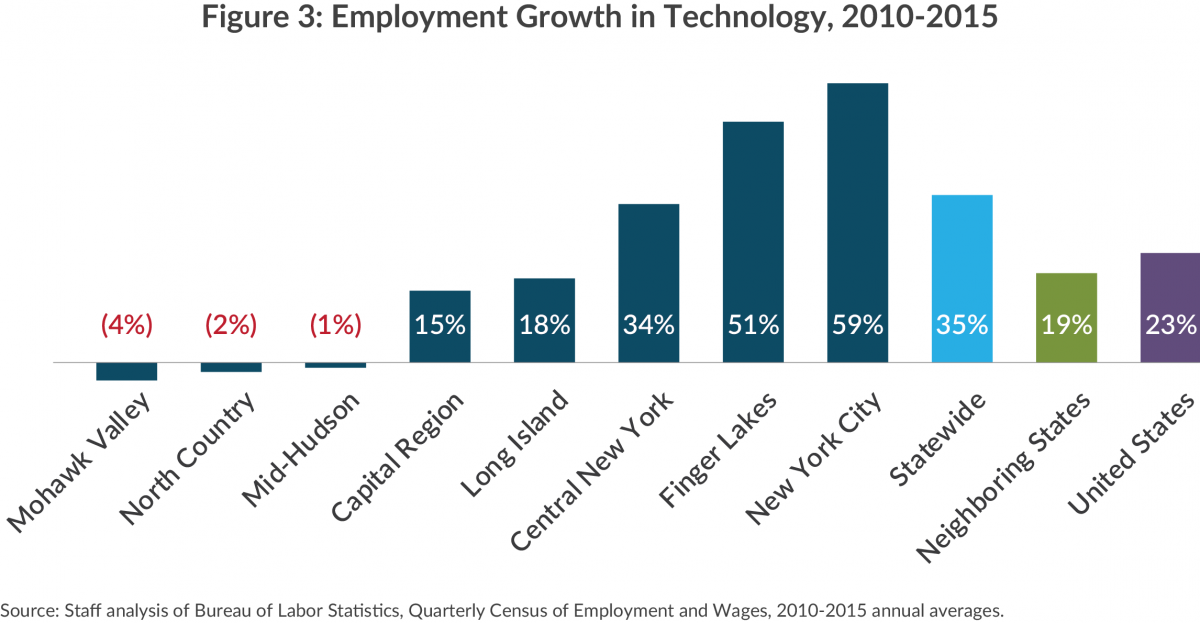
Tech jobs are highly paid, with average pay of $120,400 statewide; however, the sector represents only 2.4 percent of jobs statewide.4 Of the 8 REDCs that focused on technology, 3 lost jobs; the other 5 posted gains ranging from 15.2 percent in the Capital Region to 59 percent in New York City.5 Gains in the Capital Region and Long Island lagged the pace nationally and in neighboring states, leaving only 3 regions with rates of growth above the benchmarks.
Tourism
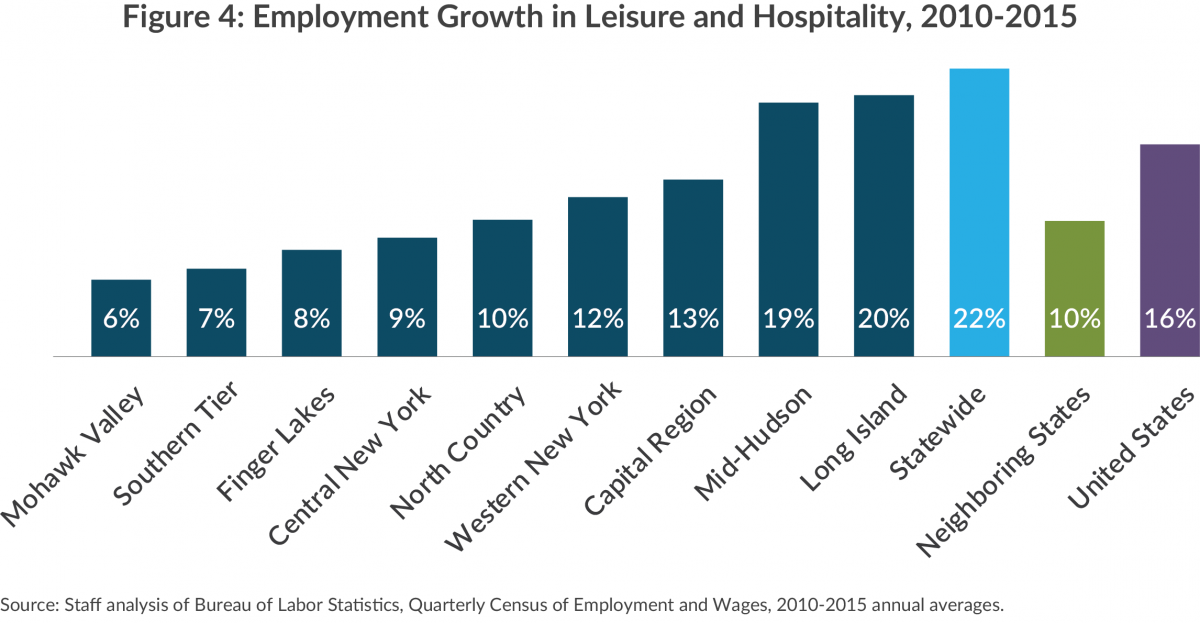
Leisure and hospitality is the fastest-growing sector statewide (13.2 percent) and among the fastest growing in every region. Employment growth varied from 5.8 percent in the Mohawk Valley to 19.8 percent in Long Island.6 Five of 9 regions outperformed neighboring states (10.3 percent) and 2 outperformed the national average (16.1 percent). Average wages remain the lowest among sectors, providing less than half the regional average wage in each area.7
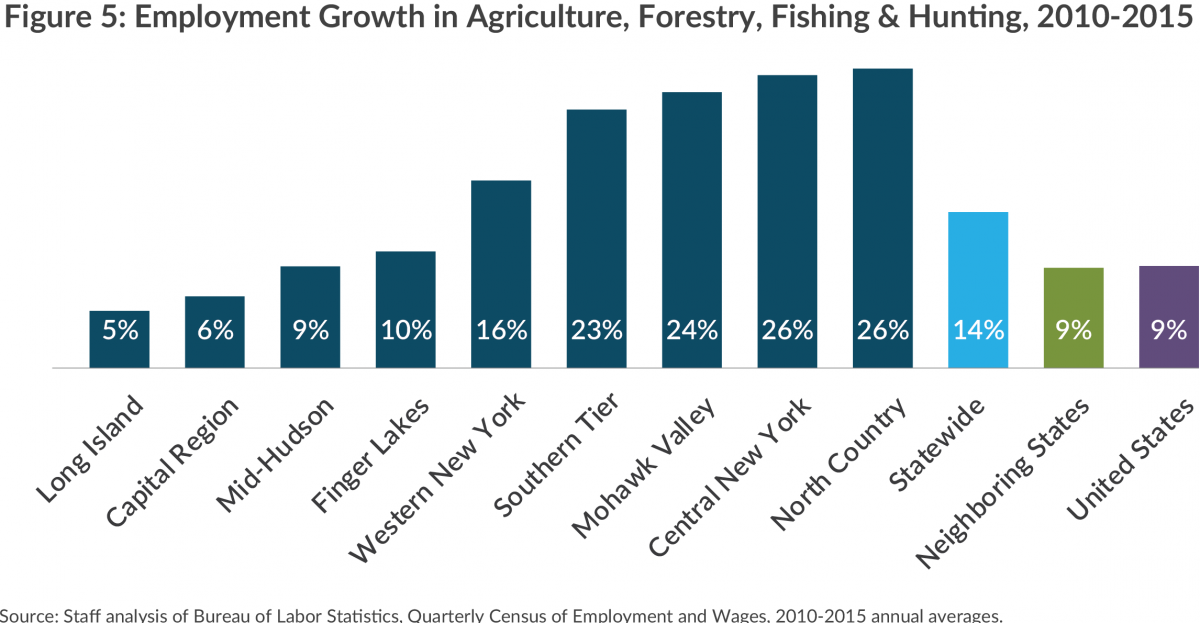
Agriculture
Statewide agricultural employment grew strongly (13.6 percent), at a rate exceeding neighboring states (8.8 percent) and the national average (8.9 percent). The North Country, Central New York, Mohawk Valley, and Southern Tier regions increased jobs more than 20 percent, but the rate of growth in Long Island and the Capital Region did not surpass neighboring states. Nevertheless, agricultural jobs constitute just 0.3 percent of employment statewide and average pay is relatively low at $32,800.
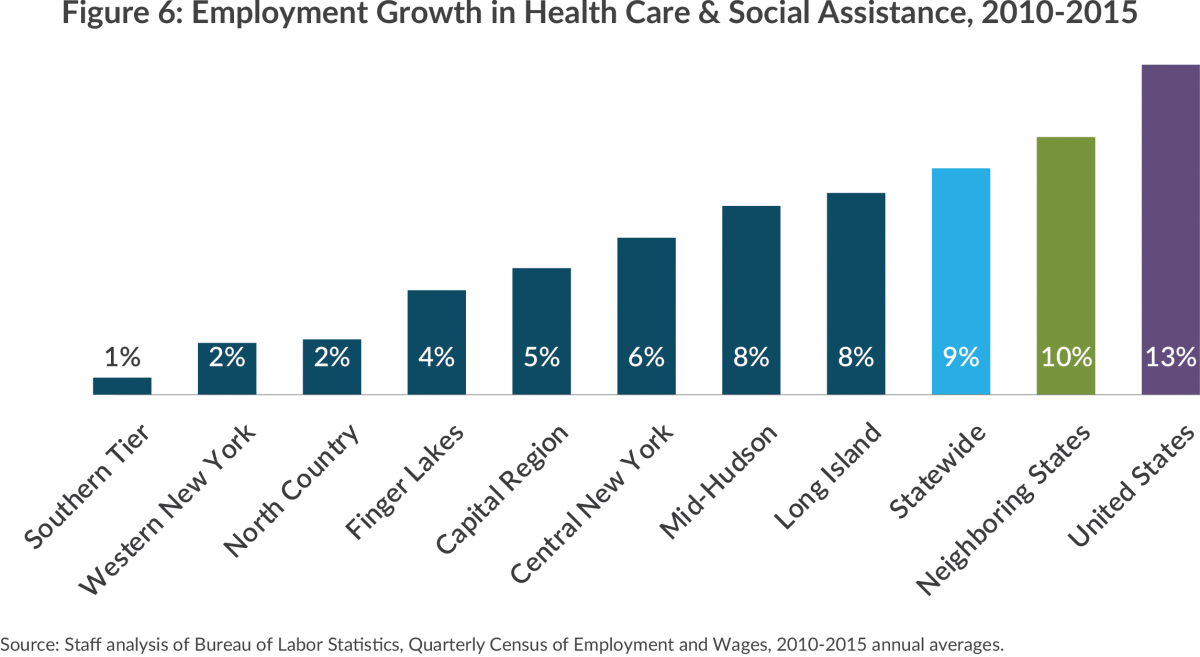
Health care
Every region that emphasized the health care sector experienced job growth below the average of neighboring states (10.5 percent) and the nation (13.4 percent). Mid-Hudson (8.2 percent), Long Island (7.7 percent), and Central New York (6.1 percent) experienced the strongest growth, while growth in the Southern Tier was less than 1 percent.
Conclusion
The employment data show regional economies have been most successful in growing health care, tourism, and agriculture industries. Some regions have also made gains in manufacturing and technology; however, regions that lost employment in these industries continue to target them despite failure to make gains. Rather than continue to focus resources in this way, the REDCs should reassess their strategic plans and revise them with an eye toward investing in business sectors that are more likely to spur growth. Indeed, the tepid results also bring grant-based economic development efforts into question; rather than aiding specific businesses or projects, better results may be available through regulatory and tax reform, enhanced career and technical education, or infrastructure investment that benefit employers throughout the region or state.
Footnotes
- In addition, the Finger Lakes, Southern Tier, and Capital regions last year were recipients of a combined $1.5 billion in Upstate Revitalization Initiative funds to be disbursed over five years.
- The Quarterly Census of Employment and Wages includes all employers covered by state unemployment insurance laws. Industries are defined using the North American Industry Classification System (NAICs). Average annual pay calculated by CBC staff by dividing total wages by total employment. Total wages includes bonuses, stock options, tips, severance pay, profit distributions, and cash value of meals and lodging provided by employers.
- REDCs publish annual progress reports. CBC’s review of the most recent reports revealed that these progress reports provide insufficient information about the regional economy and individual projects to evaluate the direct effectiveness of REDC investments. See Citizens Budget Commission, An Assessment of Performance Reporting by Regional Economic Development Councils (November 2015).
- Technology includes subsectors from the information and professional and business services sectors: software publishers (5112), data processing, hosting and related services (518), internet publishing and web search (51913), computer systems design (5415) and scientific research and development (5417).
- The two REDCs that did not include tech in their plans, Southern and Western New York, also lost tech jobs.
- Employment in New York City, which was the only REDC to exclude leisure and hospitality from its plan, grew by almost a third.
- Mid-Hudson data on Leisure & Hospitality does not include “Traveler Accommodations” due to data inconsistencies likely caused by noneconomic changes in reporting.