12 Things New Yorkers Should Know About Their Garbage
Collecting and disposing of trash is an essential municipal service, and New Yorkers tend to take it for granted. But this seemingly invisible service is surprisingly expensive, and taxpayers should understand the reasons for its high cost. This policy brief presents 12 important facts relating to the high cost of trash removal in New York City.
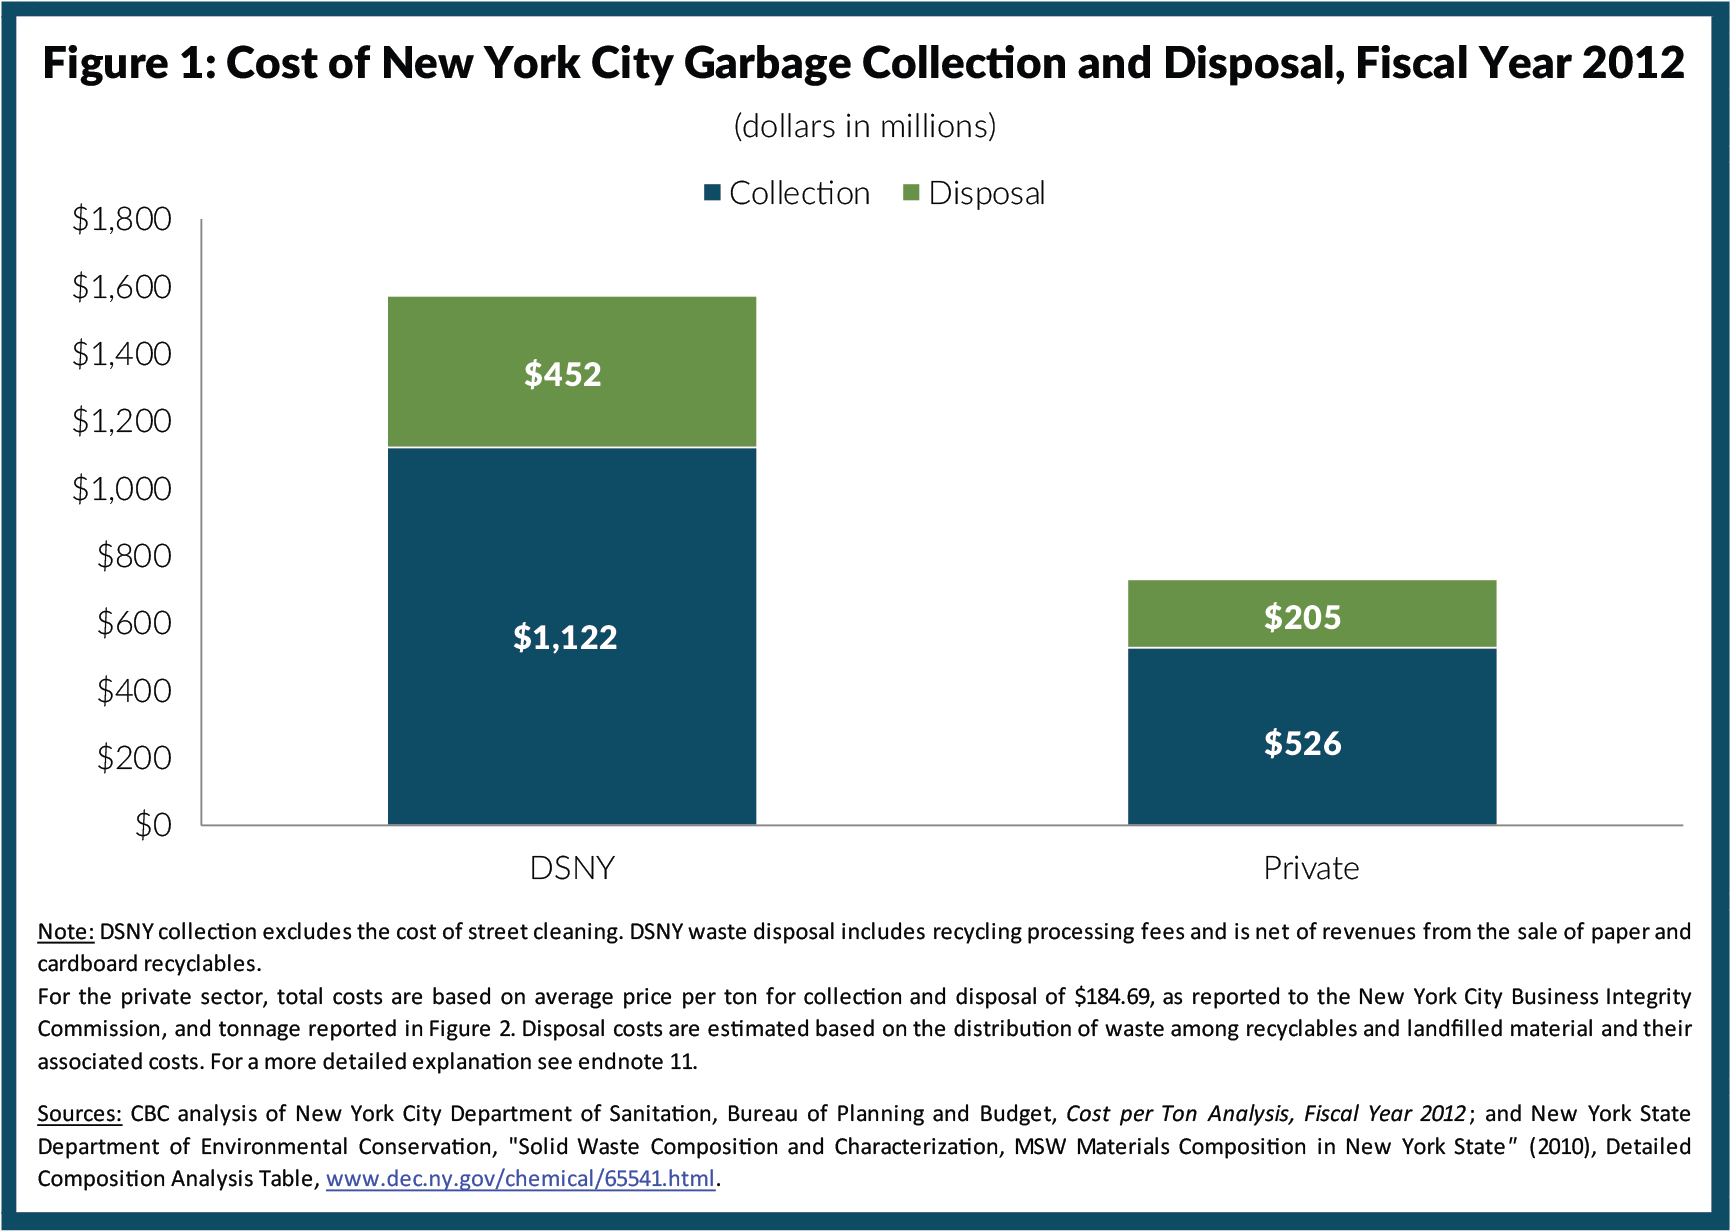
1. New York divides responsibility for handling trash between a public and a private system; together they spend $2.3 billion annually.
In New York City trash is handled by two separate systems—one private, one public. The public agency is the New York City Department of Sanitation (DSNY); it serves residential buildings, government agencies, and many nonprofit facilities. The private system is regulated by the City’s Business Integrity Commission (BIC) and consists of more than 250 waste hauling firms licensed to remove non-construction and non-industrial waste. The private haulers serve businesses ranging from small pizza parlors to large office buildings. DSNY handles about 3.8 million tons of trash annually, or an average of about 10,000 tons daily, and private carters handle about 4.0 million tons annually.1 In fiscal year 2012 DSNY required $1.6 billion of municipal tax dollars to carry out its tasks.2 Private businesses pay an estimated $730 million annually to remove their trash.3 Thus, local spending on residential and commercial garbage is about $2.3 billion annually.(See Figure 1.)
2. It costs DSNY about twice as much to collect the trash as to dispose of it.
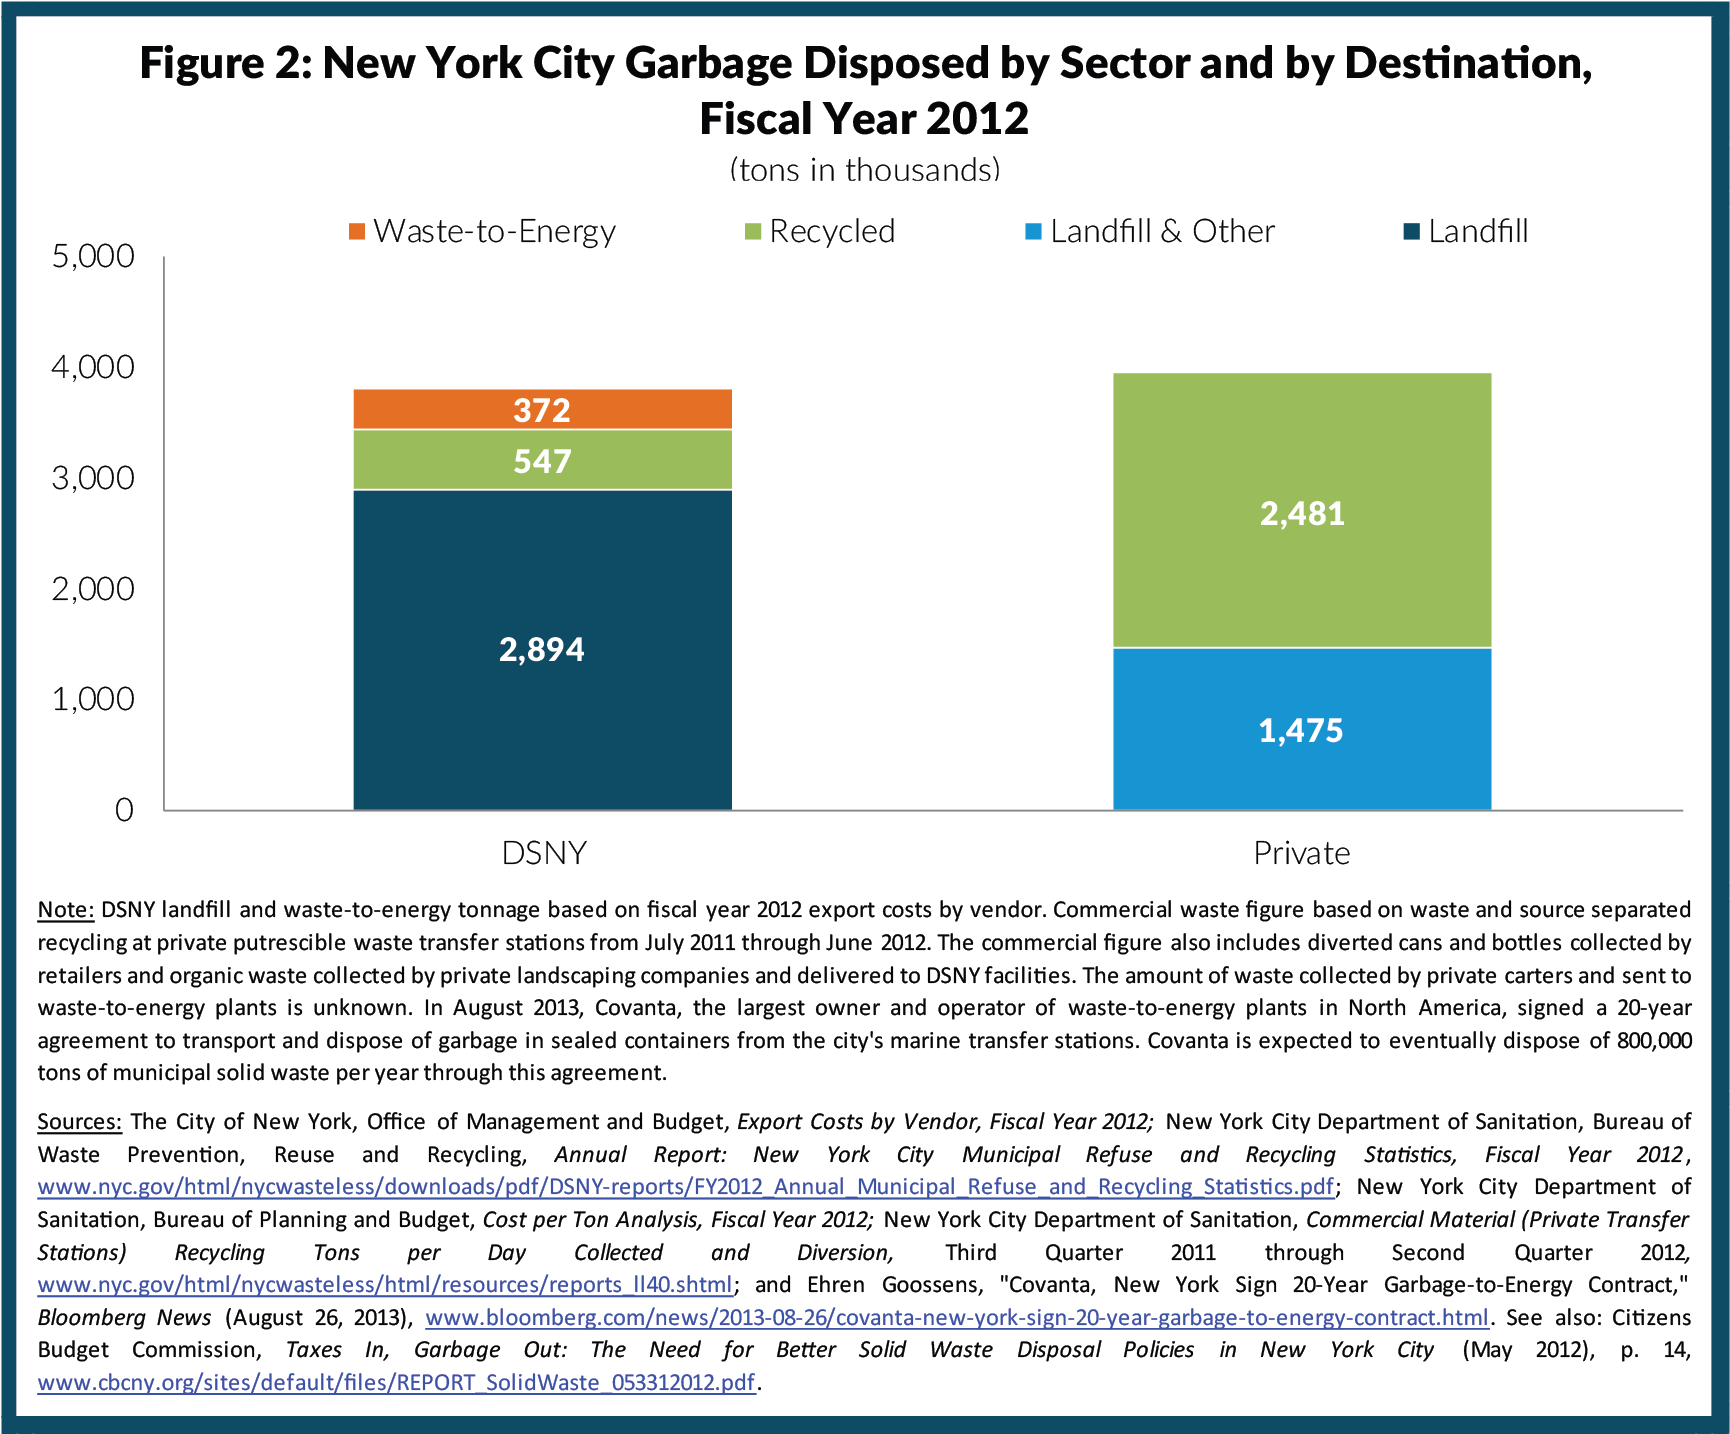
Waste management consists of two basic stages—collection and disposal. Materials are collected from homes and businesses by large trucks at curbside sites or in dumpsters. The collected material is then disposed of in one of three ways—it is recycled (typically with separate recycling methods for paper and for plastic, metal, and glass), transported to and buried in a landfill, or burned at a “waste-to-energy” facility that uses the garbage as fuel to generate electricity. Of the 3.8 million tons that DSNY collects annually, about 14 percent is recycled, 76 percent sent to landfills, and 10 percent burned.4 The large volume going to landfills often travels long distances to landfills in Pennsylvania, Ohio, Virginia, and South Carolina. Of the waste collected by private carters, about 63 percent is recycled. (See Figure 2.)
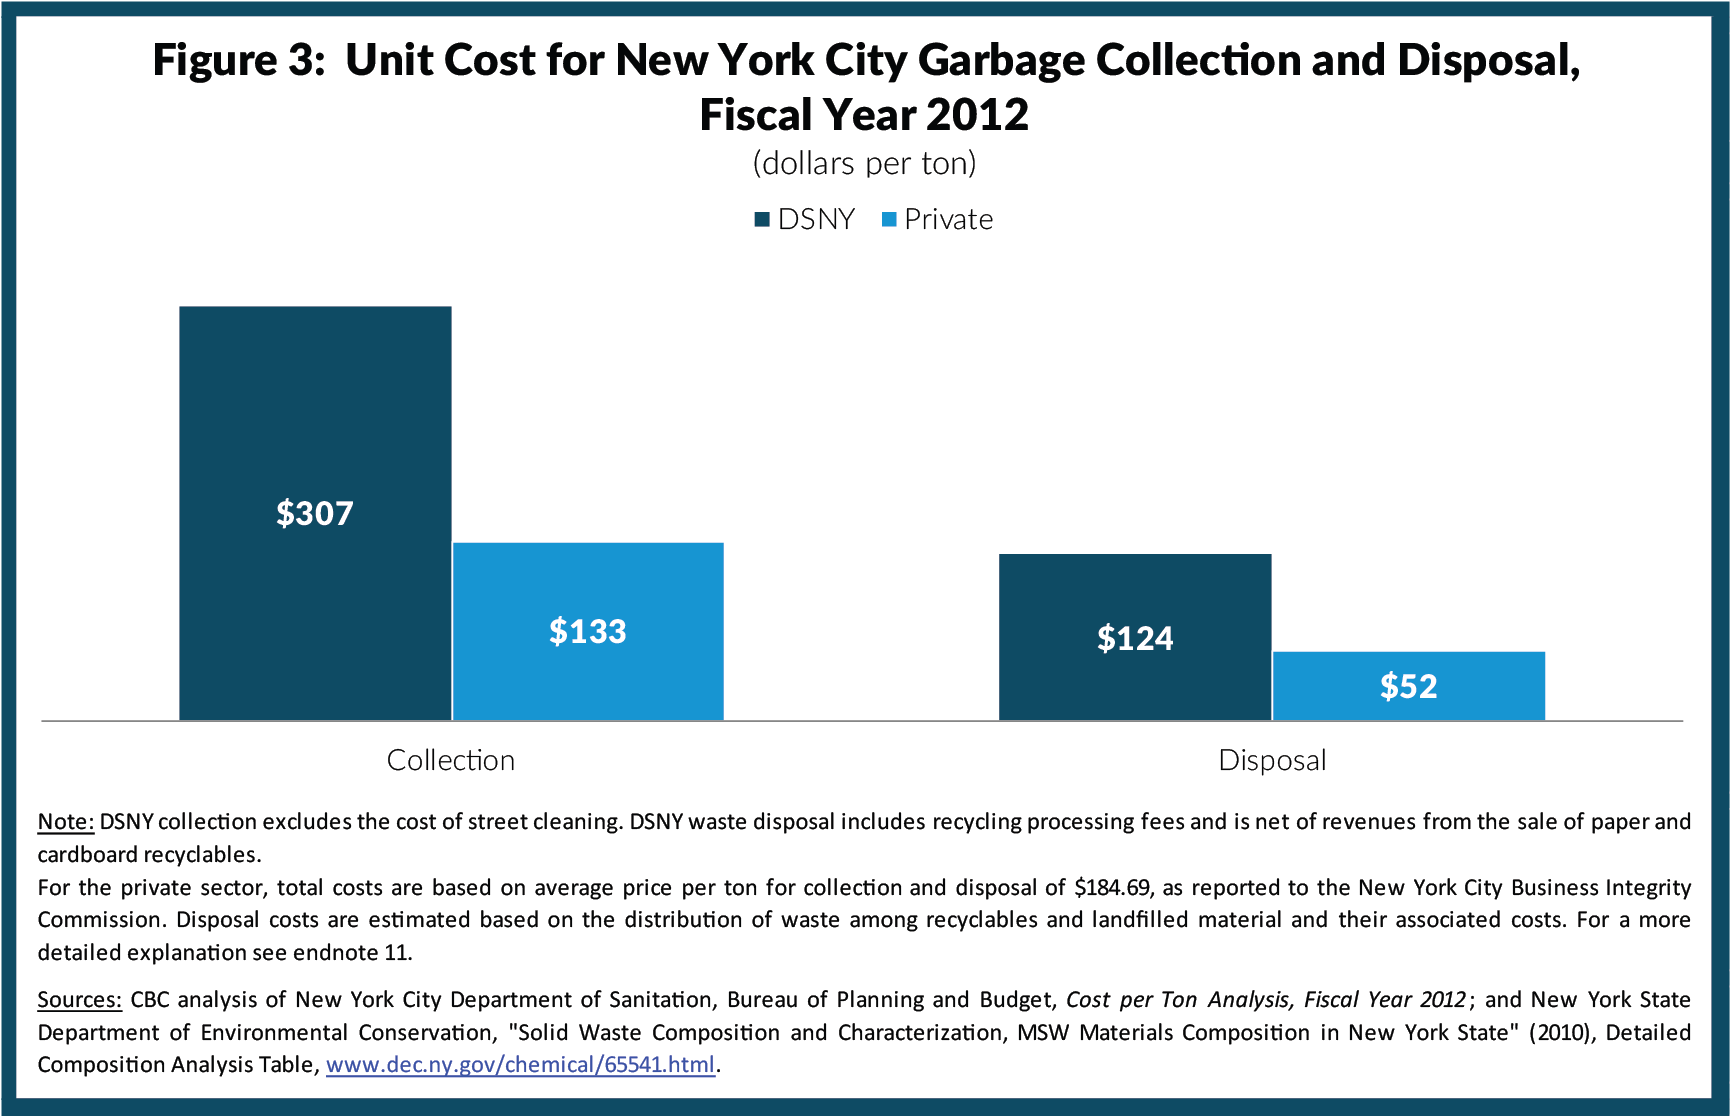
Despite the long distances involved in landfill disposal, the cost of disposal for DSNY is less than half that of collection. On average DSNY spends about $433 per ton for the recyclable and non-recyclable waste it handles, with about $307 for collection and $126 for disposal.5 For certain types of recyclable material, the “disposal” actually yields a profit since the material can be sold rather than DSNY having to pay fees for disposal. In fiscal year 2012 the City received $25 for every ton of paper recycled, lowering the net disposal cost for all waste from $126 to $124 per ton; however, this revenue varies with the market for recyclable materials. In 2013, the City earned only $11.50 per ton of paper recycled. (See Figure 3.)
3. Costs are much higher for DSNY than for private carters.
DSNY’s average combined collection and disposal cost per ton of $431 is more than double that, $185 per ton, of private carters.6 DSNY’s collection costs of $307 per ton also are more than double the estimate for private carters, $133 per ton.7
The big disparity in costs exists despite the fact that the New York City private waste carting industry is heavily regulated. City regulations, which were designed to weed out corruption and organized crime, include a maximum of two years for customer contracts, required City approval for changes in ownership, subcontracting of services, and acquisitions, a variety of vehicle and license fees, and the annual submittal of detailed operations information. In addition to this heavy regulation, unionization is common among the large firms that dominate the market. The largest firm in New York, Action Carting, is fully unionized; its New York City refuse collection truck workers are represented by several unions including the International Brotherhood of Teamsters and the United Workers of America.8
Both systems also handle a similar waste stream. Cardboard and paper is about one-third of the total in each sector, while food waste is 25 percent in the commercial sector and 17 percent in the residential sector.9 The shares of metal, glass, and recyclable plastic are similar in both sectors; however, private carters perform better in recycling a larger share of their waste—about 63 percent versus 15 percent by DSNY.10
4. Collection costs are much higher for DSNY than for public agencies in other big cities.
Comparisons of public sector waste management costs among cities are difficult because cities divide responsibilities differently between the public and private sectors. In New York City, the government provides service to all residential buildings, but many cities require households, as well as businesses, to contract privately for refuse collection. Other cities use a public agency to collect from single family homes but not large apartment buildings. Nonetheless, available data indicate DSNY has higher costs than the public agencies in other large cities. Although the high residential density in New York City ought to make collecting garbage more efficient, this is not the case. (See Figure 4.)
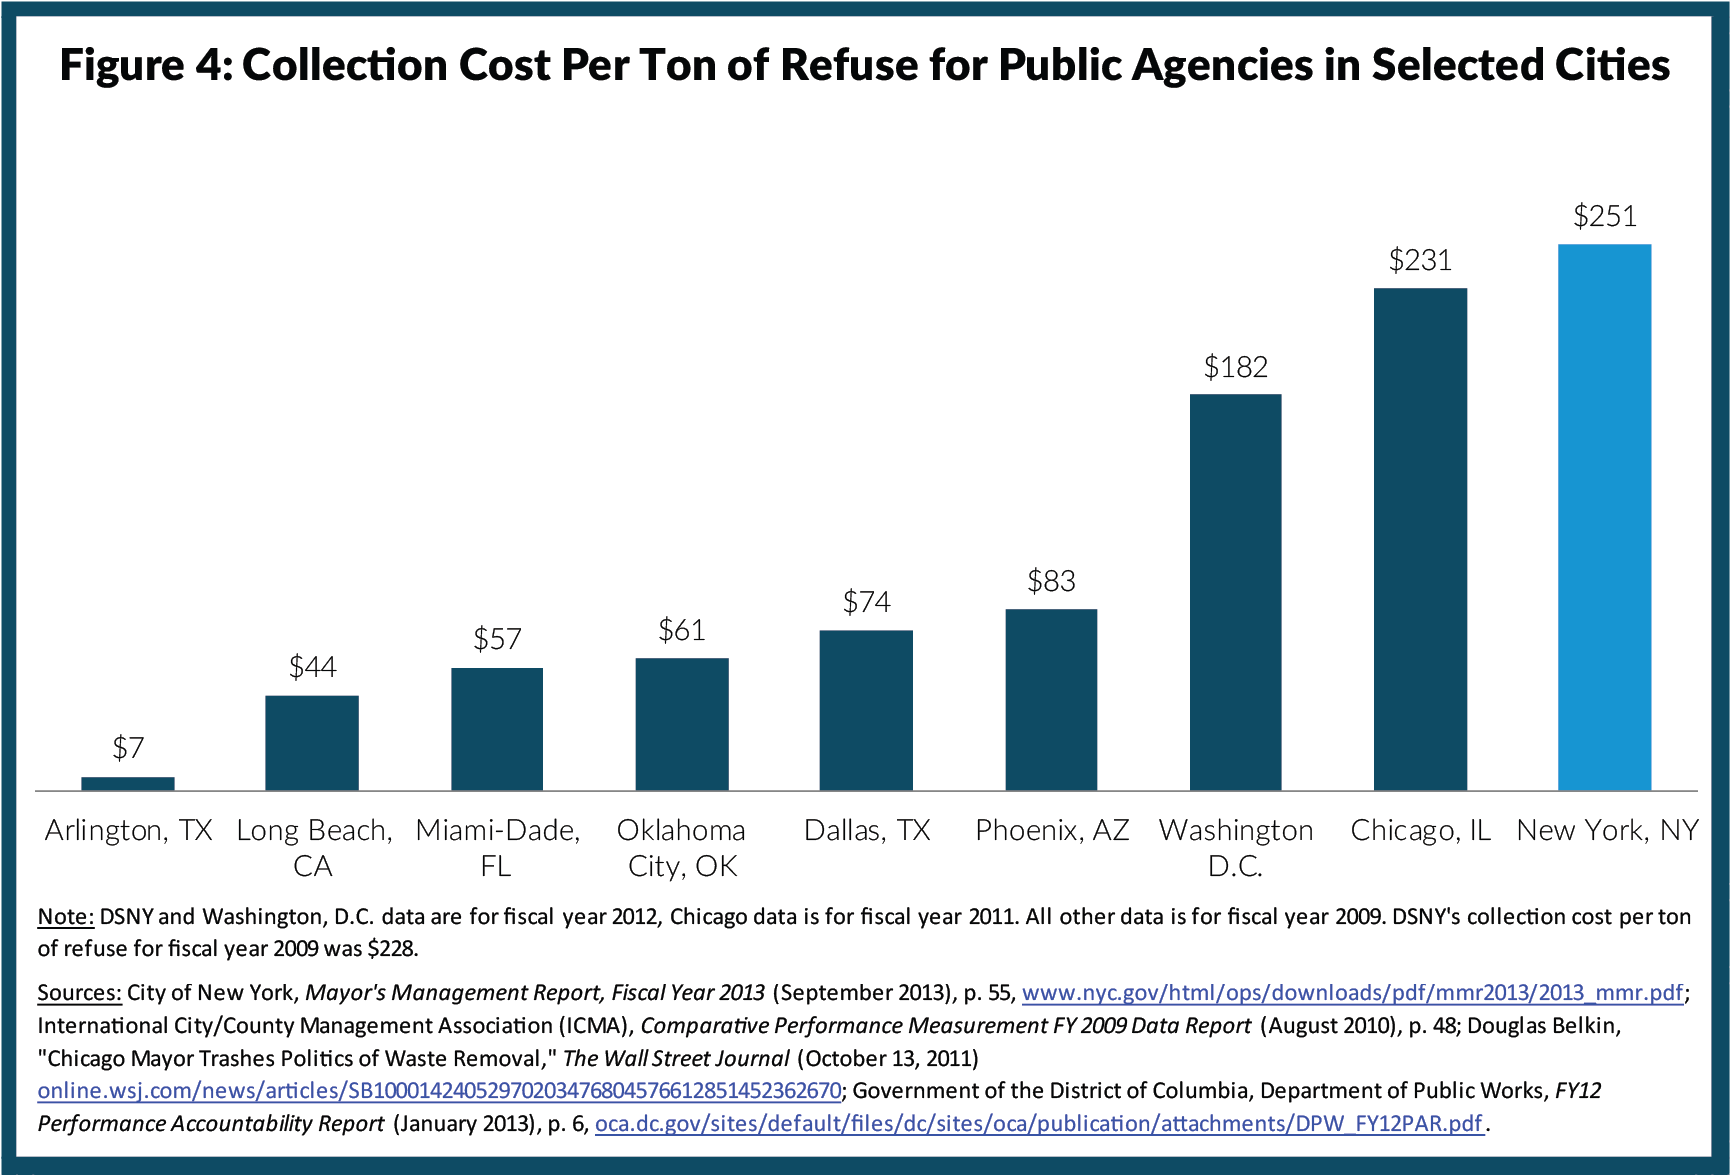
The most recent (fiscal year 2009) International City/County Management Association (ICMA) survey of participating cities found that the public sector cost of collecting a ton of refuse was $57 in Miami-Dade County, $74 in Dallas, and $83 in Phoenix.11 Other large cities do not participate in ICMA but have reported their own collection costs. Before embarking on a series of reforms in 2012, the Mayor of Chicago stated that the city’s collection costs added up to $231 per ton.12 As part of its annual agency performance review, in 2012 the District of Columbia reported that collecting one ton of refuse cost $182.13 The comparable DSNY figure in fiscal year 2012 was $251.14 (In both Chicago and D.C. the public sector serves only small residential buildings).
5. New York is one of only a few large cities that pays for trash collection entirely out of general tax revenue.
DSNY is funded by general city revenues and imposes no charges on its customers. Among other large cities in the U.S., only Boston and Chicago fully fund solid waste management through general city revenues. This system fails to connect the amount of garbage residents generate to the price those residents pay to have it collected and disposed.
In contrast, many cities including San Antonio and Los Angeles charge a flat monthly or annual fee (typically collected through building water bills) that varies based on housing type. Other cities charge based on how many bins or bags the household sets out for pick-up. This payment structure (known as pay-as-you-throw or PAYT) creates financial incentives to generate less refuse. These fees may cover the entire cost of services or just a small portion. Among large U.S. cities, San Francisco, San Jose, and Seattle have the strongest incentives for producing less refuse. In these cities, residents choose the size of their refuse bin, with options as small as 12 gallons and as large as 96 gallons. San Francisco further varies prices by household income. Other cities have weaker incentives; in Houston households receive a 96-gallon refuse bin for free, but must pay $16 per month for an additional one or pay $2.10 for each extra garbage bag.
A study of U.S. municipalities with PAYT charges found that average refuse levels fell 17 percent after implementation, with refuse production down 6 percent and the remainder due to increased diversion.15 The avoidance of waste creation not only eliminates collection and disposal costs but also the environmental costs associated with the manufacture and shipping of goods and the environmental impacts of disposal.
In 2012, the Bloomberg Administration proposed charging large non-profits variable fees depending on their volume of waste generation. (Under city law, non-profits on tax exempt land can receive free garbage service from DSNY.) However, opposition from the City Council prevented implementation.
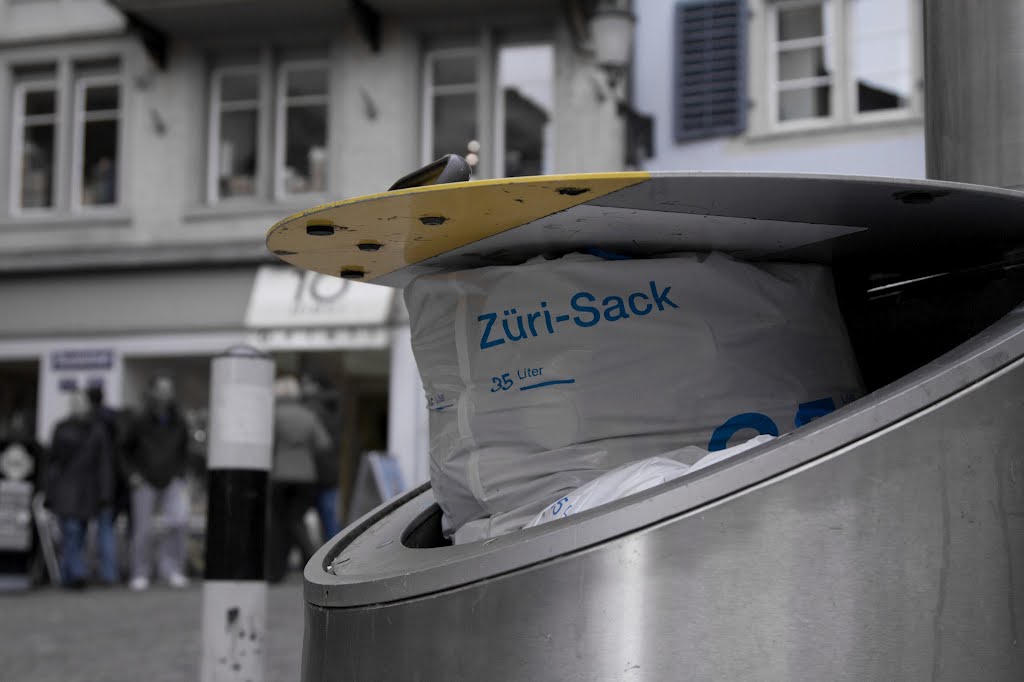
PAYT may be easier to implement in cities with fewer large apartment buildings than New York, but PAYT systems are used in dense cities. Most cities in the U.S. with PAYT, such as San Francisco, San Jose and Seattle, use garbage bins of varying sizes and prices, but European and Asian cities utilize government-sanctioned bags or special tags. In Zurich, Switzerland residents must buy “Zuri-Sacks” at local retailers; in Seoul, South Korea resident must also purchase garbage bags from local retailers.
If New York City were to implement PAYT for its residential service, the City would need to devise a plan to avoid increasing the overall tax burden, such as household rebates or a property tax rate reduction.
6. New York City does not extensively use technology in collecting its trash.
DSNY’s practices rely heavily on human strength; most refuse and recycling is collected in plastic bags that workers hoist into the truck. On average each worker picks up five tons of garbage each shift. This constant heavy lifting, combined with operating in traffic and the hazardous nature of waste, results in a high rate of injuries and illness. A sanitation worker is more likely to suffer a line of duty injury than a uniformed police department employee.16
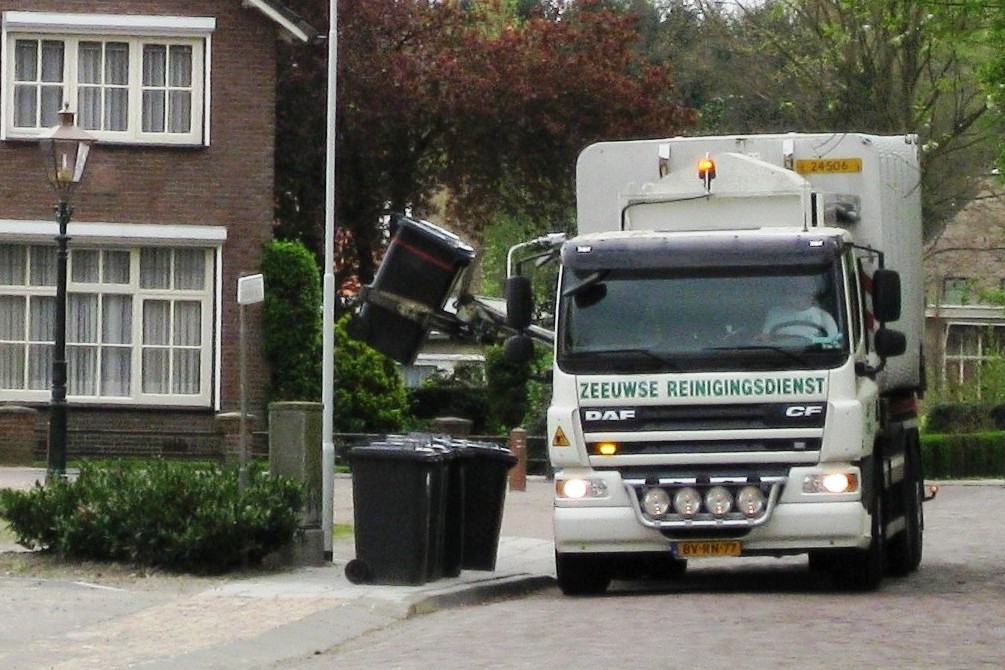
Unlike New York City, many other cities use garbage bins and semi- or fully-automated trucks with mechanisms for lifting and dumping the trash into the truck.17 Fully-automated trucks have movable arms that lift and dump garbage bins, while semi-automated trucks require workers to move the bins to the truck’s lifting mechanism. These trucks eliminate heavy lifting and direct contact with garbage, while also minimizing the continual movement on and off the truck. Thus, these trucks greatly decrease worker injuries. The U.S. Environmental Protection Agency has promoted automated trucks for their positive impacts on safety, and the National Solid Waste Management Association has cited the technology as one factor contributing to declining injury rates over the past decade.18 Additionally, using sealed garbage bins instead of plastic bags reduces odors and deters rodents.
Automated trucks are viable only in areas without low-hanging power lines and with appropriate access to curbs. New York faces logistical challenges in adapting automated trucks, but densely-populated neighborhoods with power lines underground would have curb access if garbage collection were coordinated with the “alternate side” parking schedules. While DSNY would sacrifice flexibility by assigning certain types of vehicles to neighborhoods rather than deploying the same type of vehicle across the city as needed, it may still be cost-effective. Because fully-automated trucks require only one worker, they halve the labor costs involved in collection. Even with the higher upfront and ongoing maintenance costs for automated trucks, DSNY’s labor costs are high enough that each fully-automated, one-worker truck could save more than $100,000 annually.19
DSNY does employ some fully-automated trucks for use with large containers, dumpsters, or compactors), mostly at public housing facilities. In fiscal year 2012, DSNY collected 8 percent of refuse and 1 percent of recycling in large containers. DSNY also employs semi-automated, front-loading trucks for smaller dumpsters for about 4 percent of refuse and 4 percent of recycling, but these trucks require two workers under the sanitation workers’ union contract. Opportunities may exist for more extensive use of dumpsters and similar technology.
DSNY has also begun embracing Global Positioning System (GPS) technology. By tracking the location of DSNY equipment, GPS can aid supervisors in monitoring progress on collection routes and in snow removal operations. It is widely used by private carters.
In 2007, DSNY contracted with Northrop Grumman to install GPS devices in 48 collection trucks and 12 supervisor passenger cars, primarily in Queens East District 8. Supervisors are able to track and monitor vehicle location, speed and diagnostics data such as oil and battery level. Supervisors also receive alerts if a vehicle deviated from the set route or time schedule. DSNY had intended to expand the devices to all vehicles, but did not allocate the funds to do so.20
A blizzard in December 2010 prompted DSNY to expand its use of GPS technology. During and immediately after the storm, DSNY’s inability to track its trucks and communicate with its drivers hampered its response.21 Subsequently DSNY installed GPS-equipped cellphones in 2,425 trucks.22 By January 2012 all DSNY snow plows had a GPS device, and the City created a web application for tracking snow removal that allows citizens to determine when a street was last serviced.23 Although the GPS units are available year-round on most of the DSNY fleet, a similar tracking system does not exist for garbage collection.
GPS technology and the data it allows DSNY to collect cannot make garbage collection more efficient and less costly on its own. Management also requires the authority to wield the data to find and implement productivity gains; however, many changes the City might achieve through this technology are subject to collective bargaining.
7. New York City's system for recycling is inefficient.
DSNY has exceptionally high collection costs for recycled materials, and this inefficiency results from policy decisions about the nature of the service. Specifically, decisions to have rigid collection cycles of once per week citywide and to rely on separate collection of two types of material drive the high costs.
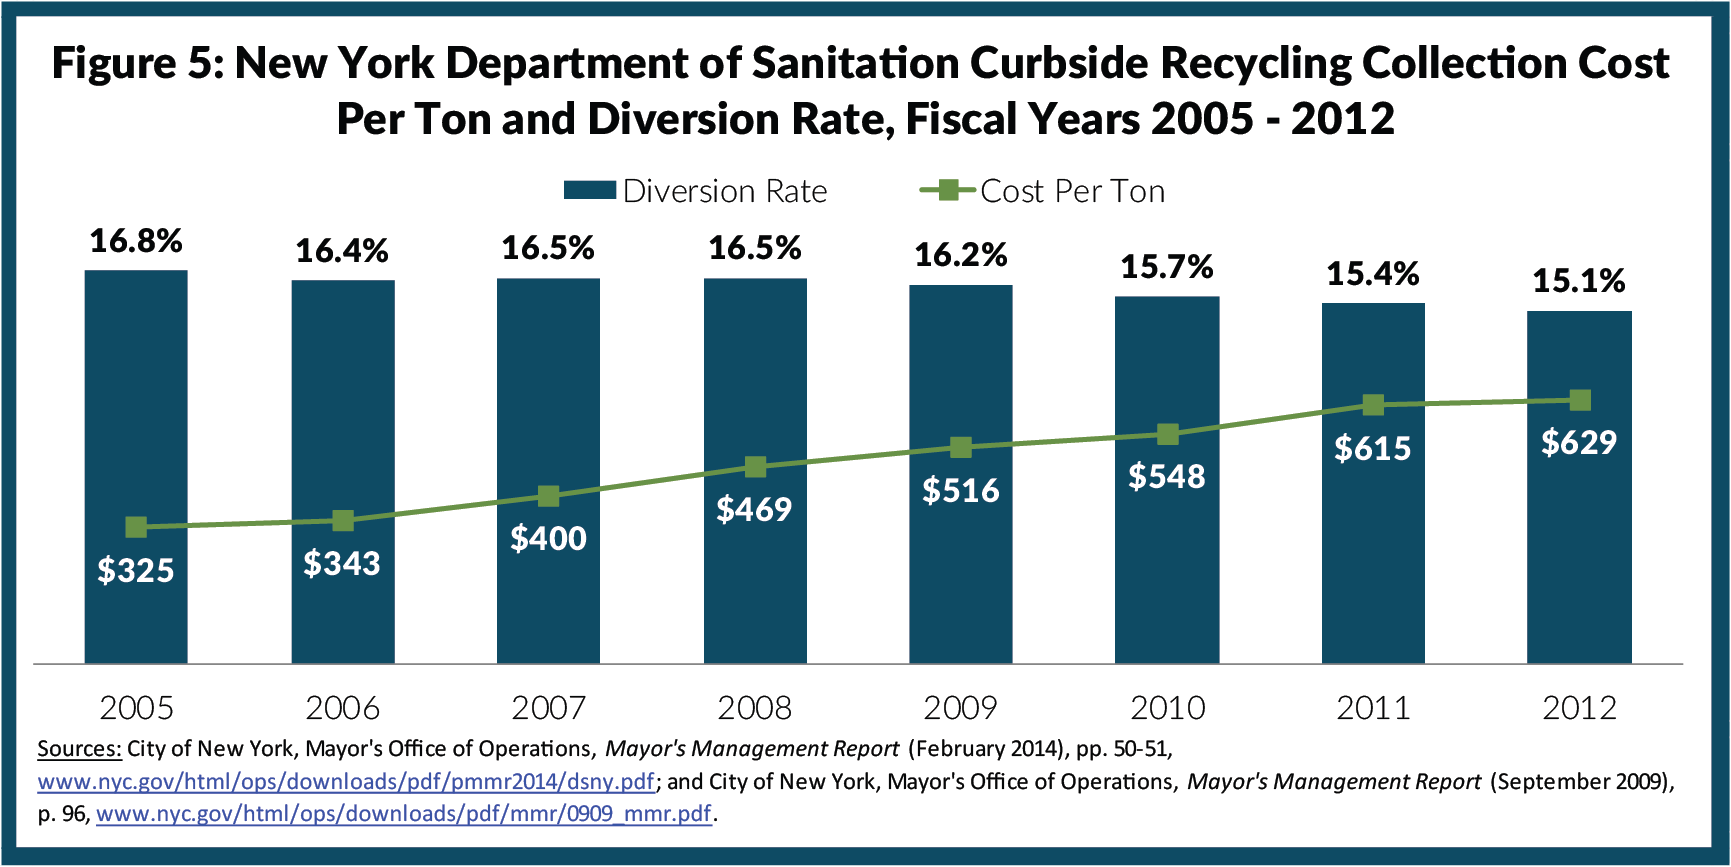
In fiscal year 2012, DSNY spent $629 per ton to collect recyclable material, more than double the $251 per ton for collecting refuse.24 In the past seven years, recycling collection costs per ton have almost doubled as waste diversion has fallen. (See Figure 5.)
On an average truck-shift in fiscal year 2012, refuse curbside collection trucks picked up 10.0 tons, while recycling trucks got only 5.1 tons.25 All DSNY curbside collection trucks, refuse or recycling, are manned by two sanitation workers; therefore, each truck costs the same to operate. With half as many tons to spread the costs over, the labor cost per ton of recycling is double that of refuse. Trucks designated for curbside refuse can hold 12.5 tons, while the capacity is 11.5 tons for paper trucks and 10.0 tons for metal, gals and plastic (MGP) trucks since the material is less dense.26 Thus, refuse trucks are typically 80 percent full and recycling trucks are only half full.
In 1998 the City Council mandated a minimum of once-a-week recycling collection.27 This mandate applies despite diversion rates that vary from 10 percent in the Bronx to 18 percent in Manhattan and Staten Island.28 At the district level, the variation is from 26 percent for Manhattan District 1 to just 5 percent for Bronx District 1.29 Identical recycling collection schedules for these diverse neighborhoods help create the great inefficiency in the service.
DSNY also relies on “dual stream” recycling practices, which likely is less efficient than “single stream”—or commingled—collection. Before collection residents must separate refuse from recycling and further sort MGP from paper and cardboard. The system was originally constructed to enhance post-recycling commodity quality and minimize sorting costs. Today most nearby recycling plants accept either only paper or only MGP.30 To accommodate the two streams of material, recycling collection involves either one truck with two bins—one for paper and one for MGP–or two separate trucks. Dual-bin trucks are used primarily in low-density areas and are currently employed in about half of the city.31
Because paper and cardboard are processed at different plants than MGP, a sanitation worker has to drive a dual-bin truck to two different locations in order to empty it. As a result, a standard DSNY collection truck travels 6,900 miles each year, but a dual-bin truck travels 9,000 miles.32 These extra miles also require additional labor time; the extra time required to dump a truck if workers cannot unload the haul during their regular shift is called relay time. In fiscal year 2012, curbside recyclable material required an average of 23 relay minutes per ton, compared to 5 minutes for curbside refuse.33
This problem can be somewhat eased in parts of the city with the opening of a new recycling facility in Brooklyn in December 2013. The new plant has the capacity to process both paper and MGP. In addition, recyclable material from Manhattan will be delivered to the plant via barge transport from a to-be-constructed Manhattan transfer station at Gansevoort Street and the Hudson River. The City estimates that ultimately the plant will reduce annual DSNY vehicle miles by 260,000.34
Commingled recycling collection may be more economically sensible in some areas of the city, in particular those with low diversion rates. To work from a cost perspective, the benefits–higher recycling rates and lower collection costs–must exceed the increased costs of sorting the materials after collection and the accompanying degradation of the quality and value of some (mostly paper) recyclables. Experimentation and investment in more sophisticated sorting technology will be needed to determine when and where this approach may be beneficial. Notably, in September 2013 Action Carting opened a recycling facility in the Bronx that utilizes infrared technology to sort different types of plastics and paper collected from businesses.35
8. The compensation cost of a city sanitation worker begins at more than $100,000 and averages more than $150,000 annually, driving high costs at DSNY.
Compensation consists of direct wages and fringe benefits. For both elements, DSNY uniformed sanitation employees receive more than local private sector counterparts and the differential is especially great for fringe benefits. This disparity exists despite workers in both sectors being unionized.
With respect to wages, in fiscal year 2012 average earnings at DSNY were $83,870 annually, 39 percent higher than the $60,509 in the local private sector.36 A sanitation worker’s annual wage consists of base pay plus a variety of extra payments. Under the latest contract (which expired in 2011 but remains in force), base pay for a newly-hired worker begins at $33,746 annually and rises periodically to reach $69,339 after 5.5 years. This early rapid climb is the equivalent of a 14 percent raise each year. After five years of service, longevity payments begin. These payments begin at $1,495 and rise every five years to reach $4,195 after 20 years.
In addition to base and longevity pay, workers receive these payments:
- Shift differentials. Sanitation workers typically work five days per week, eight hours per day, Monday through Saturday, either 6 a.m. to 2 p.m. or 7 a.m. to 3 p.m. If their work falls outside these parameters, they receive a differential payment. These include 10 percent extra pay for night shifts, double pay for Sundays, and 50 percent extra pay for holidays. Workers are regularly scheduled to work Saturdays, but receive 12.5 percent extra pay for those days.
- Overtime. Sanitation workers receive extra pay for working outside their regular schedule, including double pay for working on a scheduled day off. If workers are required to report for duty during an emergency outside their regular schedule, they are guaranteed at least eight hours pay at time and one-half.
- Two-worker truck bonuses. Originally negotiated in 1980, when DSNY shifted from three- to two-worker trucks, these bonuses are paid to collection crews working on trucks requiring two workers (now, almost the entire fleet). This represents additional pay of about $8,356 annually.37
- Other bonuses. Additional bonus payments are made to workers who dump their trucks on their regular shift rather than requiring relay time and to workers on the limited number of one-worker trucks. A “productivity” bonus is paid to workers in districts where the average number of tons collected per shift meets a contractually set target.
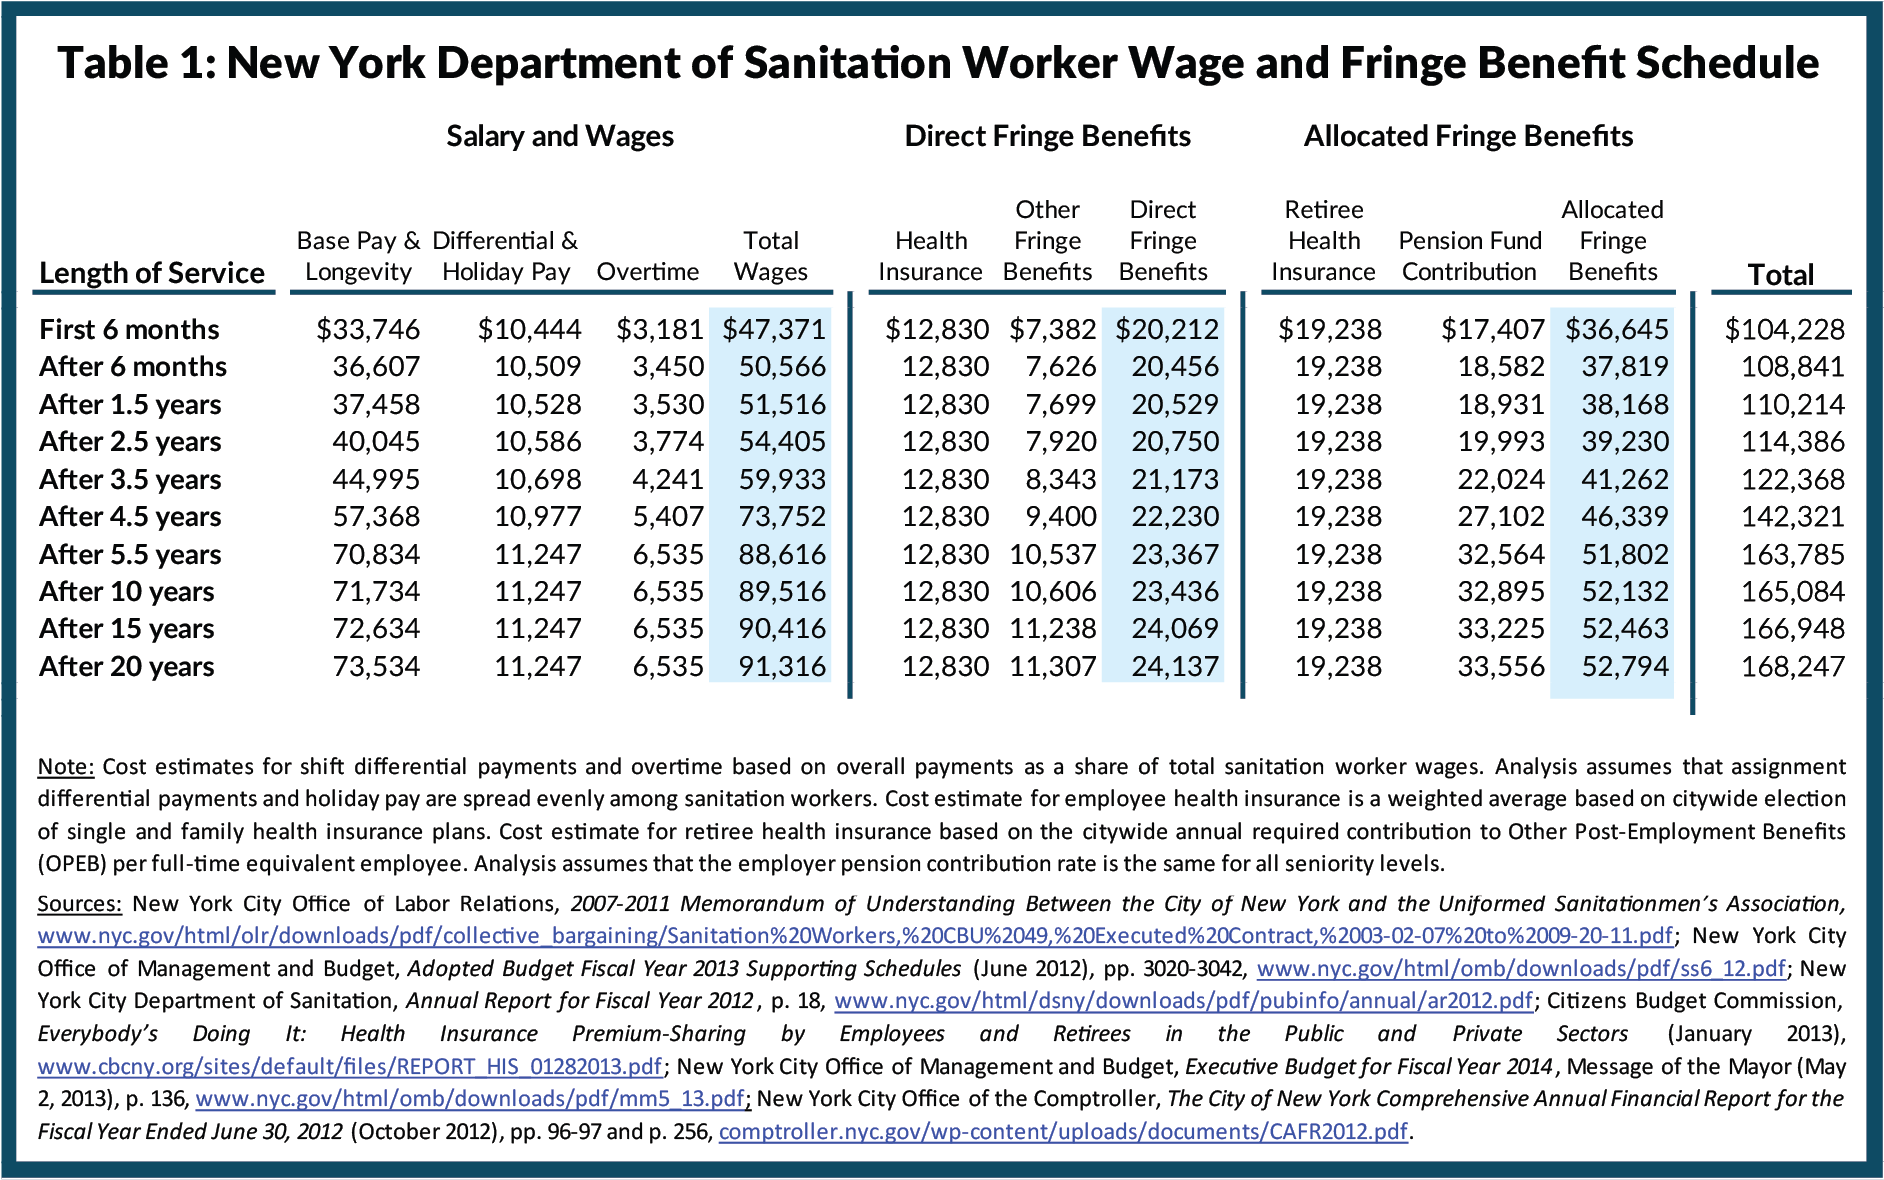
Sanitation workers also have substantially more paid days off than comparable private sector workers. DSNY workers receive 18 vacation days for the first four years of service, growing to 25 vacation days after six years of service; workers in the private waste industry have an average of 12 vacation days after working for 10 years.38 DSNY has 12 official paid holidays; most private sector sanitation workers have fewer than eight. Sanitation workers are also entitled to unlimited paid sick days.39 In 2013 DSNY employees took an average of 15.8 sick days.40 This absentee rate is higher than police department employees, who also have unlimited paid sick leave and took an average of 8.3 sick days in 2013. The combined impact of the base and supplemental payments is earnings much higher than the base salaries alone. Sanitation worker annual wages range from about $47,000 to over $90,000. (See Table 1.)
With respect to fringe benefits, DSNY workers’ benefits are dramatically more generous than those prevailing in the private sector. Like most municipal employees, DSNY workers are eligible for a family health insurance plan that requires no employee contribution toward premiums and participate in a defined-benefit retirement plan with limited employee contributions and benefits starting at 50 percent of final average salary. In contrast, private employers in the industry require an average employee contribution toward health insurance premiums of 36 percent for family coverage, and private pension plans are nearly all (96 percent) defined-contribution rather than defined-benefit plans.41 With the cost of fringe benefits, total compensation for a sanitation worker starts at more than $100,000 annually and reaches over $168,000 at the end of a career. (See Table 1.)
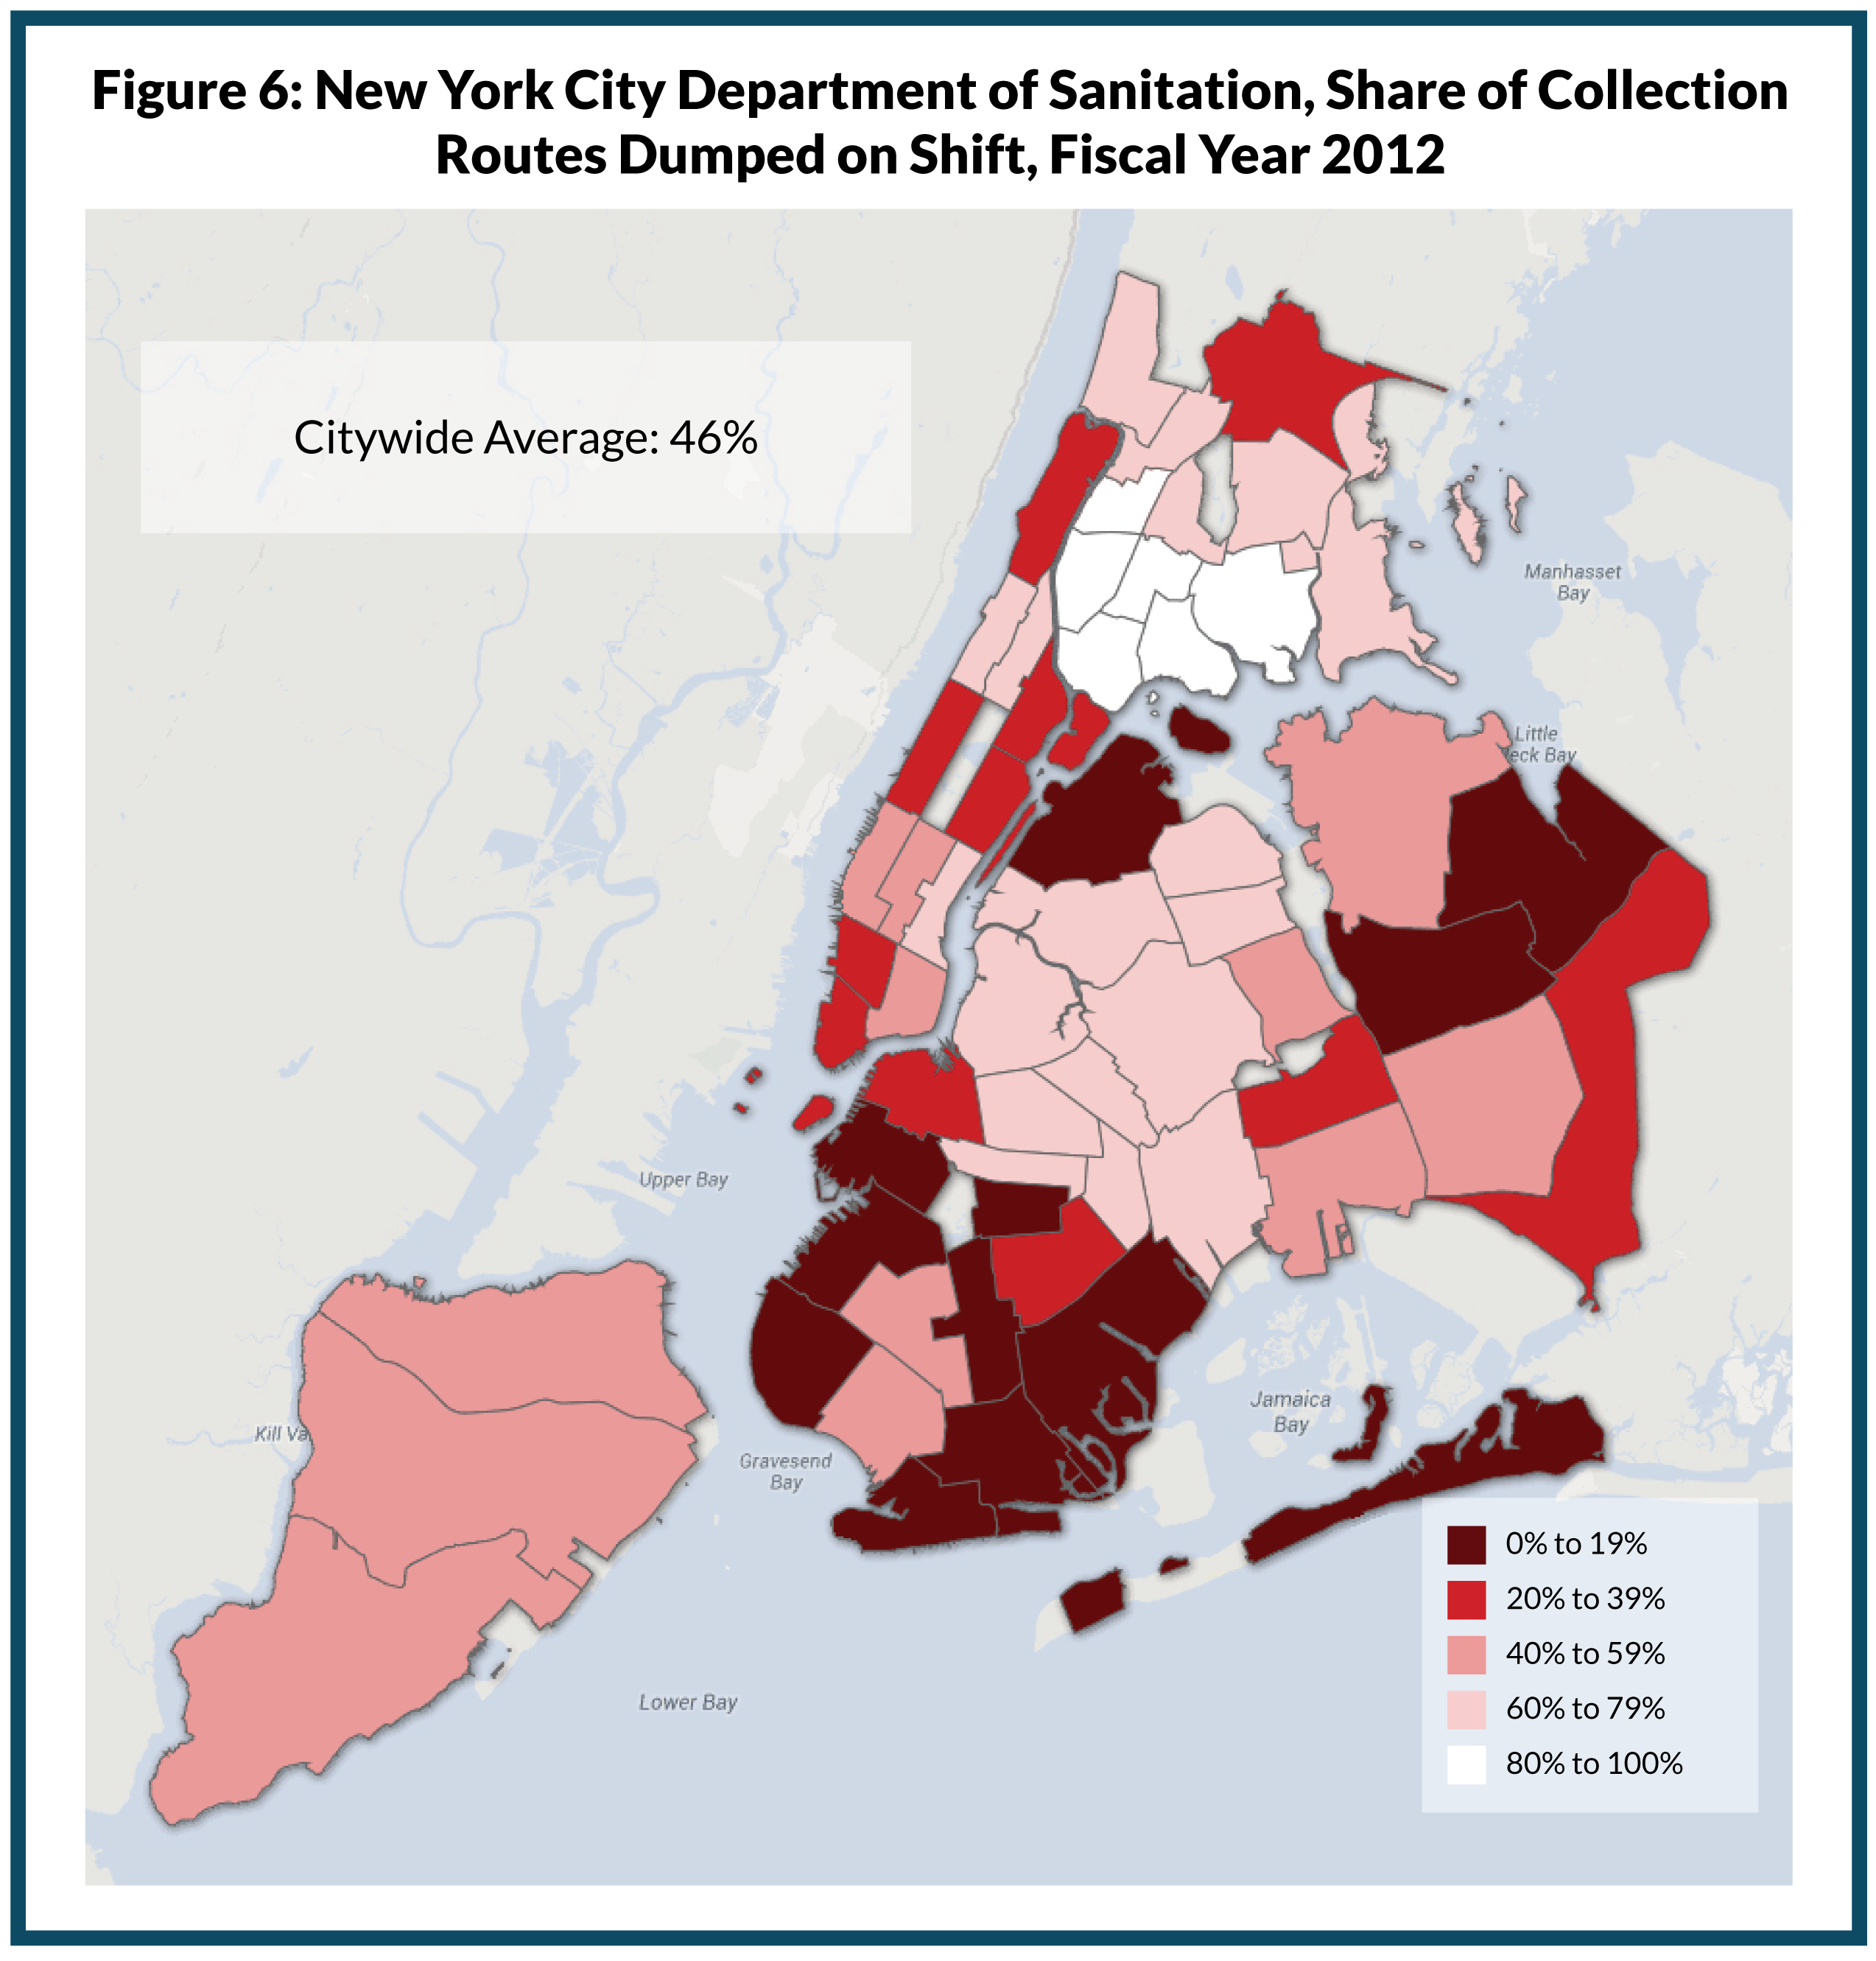
9. DSNY pays “productivity” bonuses, but taxpayers do not get increased productivity in exchange.
Two of the bonus payments available to workers–the “productivity” bonus and the on-shift dumping bonus–are intended to yield greater productivity, but they are not achieving that result. Beginning in 2002 the productivity bonus was contingent on workers meeting a target of an average of 10.7 tons per shift for refuse and 6.2 tons for recycling. However, workers receive the bonus payments as long as their district meets targets for the total number of truck-shifts and abides by set routes. As a result, in most recent years the payments have been made even though the targets have not been met.
After the closure of the Fresh Kills landfill in Staten Island in 2001, DSNY workers began using waste transfer stations to unload their hauls. To compensate for the longer trips and to encourage workers to make the effort to complete the collection route and get to the transfer location without the DSNY having to pay for extra relay time, a bonus payment was implemented for dumping on shift. The extra payment eased this transition for workers and successfully increased the dump-on-shift percentage in the early years after Fresh Kills closure.
Today, a worker’s ability to meet this target is rarely a function of their individual effort; rather, the ability to dump on shift is essentially a function of the location of transfer stations. Routes ending close to transfer stations have a greater chance of dumping on shift than those more distant from the transfer stations. Since 11 of the 20 transfer stations within the city are in either the South Bronx or Newtown Creek, Brooklyn, these areas have the highest percentage of routes dumping on shift. In fiscal year 2012, the dump on shift percentage was 77 percent for the Bronx and 65 percent for sanitation districts 1, 2, 3, 4, 5, and 16 in North Brooklyn, compared to a citywide average of 46 percent and less than 5 percent in districts 14 and 18 in Brooklyn and district 8 in Queens. (See Figure 6.)
10. DSNY’s practices for setting routes and schedules create collection inefficiencies.
DSNY practices, many of which are incorporated in union contracts, create inefficiencies. These include minimum refuse collection frequency of twice per week, eight-hour shifts, and limited night collections. All New York City neighborhoods receive a minimum of twice per week refuse collection. As a result, collection runs in many less-dense areas typically do not result in a full truck. Although a full DSNY truck carries about 12.5 tons of refuse, eastern Queens and Staten Island produce average loads of only eight tons per shift.42 (See Figure 7.)
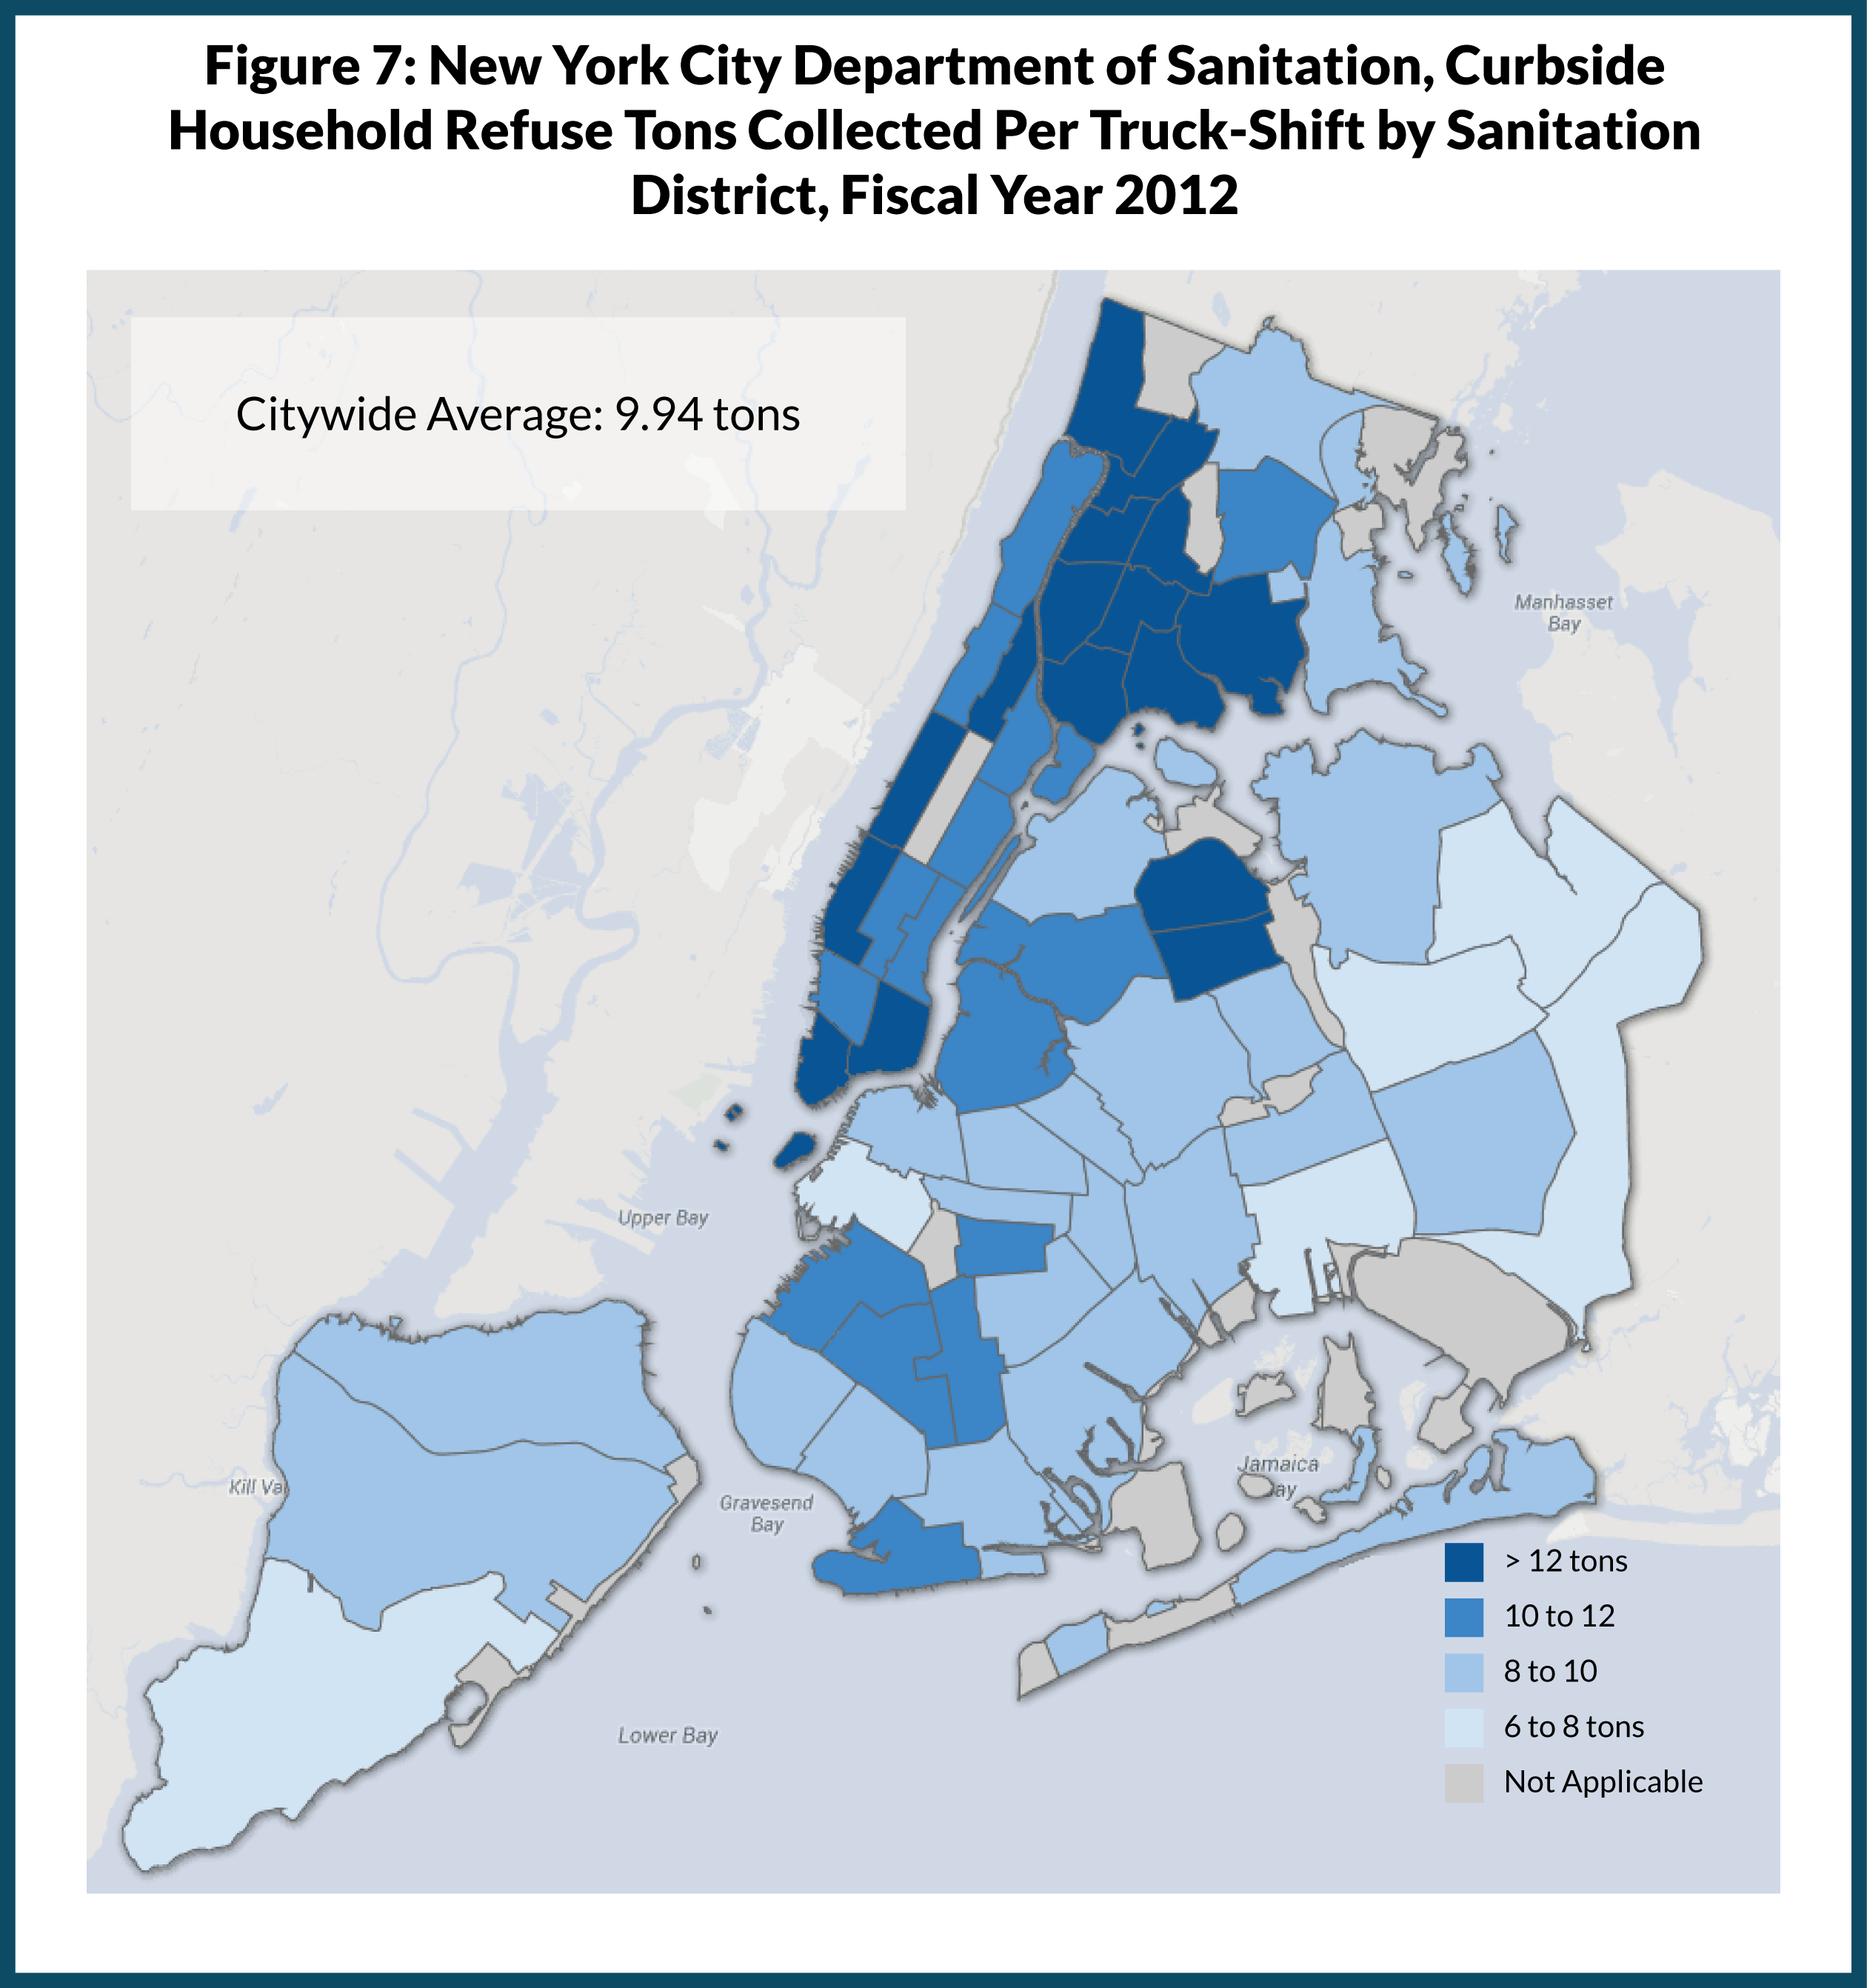
While Staten Island’s population density is well below that of San Francisco, Boston, Chicago, Philadelphia, and Los Angeles, each of these cities collects garbage only once per week.43 In Staten Island, 56 percent of housing units are single-family homes while the rate is only 29 percent in Chicago and 44 percent in Los Angeles. Portions of Queens are also low-density, with 49 percent of Queens housing units being one to two-family homes.
The lack of full trucks and the need for relays to handle many truckloads of refuse relates to the rigid schedule of eight-hour shifts. While private carters pay overtime for hours over 40 per week, they do not schedule only eight hour shifts. Shifts of 10-12 hours permit trucks to obtain full loads and to dump on shift more often.
Night time collections are typically more efficient than day collections primarily because of less traffic congestion; the savings in labor time is about 9 percent.44 Nonetheless, DSNY schedules few routes for collection at night; about 81 percent of collections are during the day. In contrast, private carters perform about 85 percent of their collections at night.45 DSNY avoids night collections in part because of a concern for noise, but also because, unlike private carters, they pay a night shift differential which more than offsets any savings.
11. Heavy reliance on DSNY for snow removal is unique among big cities and generates high overtime expenses.
New York City relies almost entirely on DSNY employees for snow removal. During a snowstorm all sanitation workers rotate through 12-hour shifts of 2,000 workers at a time.46 This practice heavily increases overtime expenses at DSNY. When workers report for unscheduled shifts during an emergency, they are guaranteed at least 8 hours pay at time and one-half. In fiscal year 2011, 61.5 inches of snow fell and DSNY accrued $119.5 million in overtime; in fiscal year 2012, 6.8 inches of snow (and a hurricane) cost $55 million in overtime.47

In other large cities—some with large public sanitation workforces and some without–a more diverse group of workers are assigned to snow removal. Most commonly a combination of employees from transportation, parks, water, and sanitation agencies completes the task, with assistance from private contractors during heavy snowfalls. For example, in Indianapolis, where public employees serve five of 12 garbage districts, the City trains workers engaged full-time in park maintenance, facility maintenance, traffic operations, and street maintenance to remove snow.48 Sanitation workers are used only during severe storms in order to maintain regular trash collections, and private contractors are called in if the snowfall exceeds 6 inches. In Toronto, which has twice the average snowfall of New York, and which removes snow both from streets and sidewalks, only a third of the snow removal force are public employees; the remainder are private contractors.49
New York City already maintains a list of pre-authorized private contractors that can be called on during a snow emergency; this could be the building block for a more efficient system. Following the December 2010 blizzard, which overwhelmed the City’s resources, DSNY expanded this list and took additional steps to ensure that these contractors would be available when needed.50 As in other cities, a mix of public employees outside DSNY trained to use plows on city-owned vehicles and private contractors (both those performing waste collection and others) can be a reliable reserve force for snow removal.
12. The overlapping routes of private carters are inefficient and environmentally damaging.
The private carters serving businesses under the supervision of the City’s Business Integrity Commission have performed well, providing services at a reasonable cost and with limited instances of corruption or crime. While this system encourages competition, it also breeds inefficiency, traffic, and air pollution as multiple firms may serve neighboring commercial entities, including those on residential blocks also served by DSNY. For instance, according to staff at the local Business Improvement Districts (BIDs), businesses in North Flatbush, Brooklyn are served by 30 to 45 carters and businesses within five avenues on 125th Street in Manhattan are served by 34 carters.51
Other cities limit the number of private waste carters through either exclusive or non-exclusive franchise agreements. Under either system, the city is divided into subdivisions. In an exclusive system, one company gets the franchise agreement for a particular area; in a non-exclusive system, more than one company holds a franchise agreement for the same area. Los Angeles recently approved switching from an open permit system to exclusive franchises beginning in 2017.52 At that time the city will award 11 franchise agreements for 11 subdivisions of the city. In addition waste carters will have to meet performance benchmarks for recycling, waste disposal, clean fuel, and worker safety.
The benefits of franchise agreements include:1) reduced truck traffic and emissions from fewer companies servicing the same blocks, 2) an enhanced ability to monitor the business practices of private carters, 3) increased reliance on large companies with better technology and greater capabilities for waste diversion, and 4) the ability to require specific performance metrics. However, franchises would require significant resources to implement and administer, and some cost efficiencies may be offset by new regulatory burdens.
Download Report
12 Things New Yorkers Should Know About Their GarbageFootnotes
- Residential and government facility waste figure based on curbside and containerized collection data provided by DSNY for fiscal year 2012, plus diverted waste collected at DSNY special events, such as electronic waste and textiles. Commercial waste figure based on waste and source separated recycling at private putrescible waste transfer stations from July 2011 through June 2012 (third quarter 2011 through second quarter 2012). Available from http://www.nyc.gov/html/nycwasteless/html/resources/reports_ll40.shtml. The commercial figure also includes diverted cans and bottles collected by retailers and organic waste collected by private landscaping companies and delivered to DSNY facilities.
- CBC analysis of New York City Department of Sanitation, Bureau of Planning and Budget, Cost per Ton Analysis, Fiscal Year 2012 (undated).
- Based on average price per ton for collection and disposal of $184.69, as reported to the New York City Business Integrity Commission.
- New York City Office of Management and Budget, Export Costs by Vendor, Fiscal Year 2012.; New York City Department of Sanitation, Bureau of Waste Prevention, Reuse, and Recycling, Annual Report: New York City Curbside Municipal Refuse and Recycling Statistics, by Borough and District: Fiscal Year 2012 (June 2012), www.nyc.gov/html/nycwasteless/downloads/pdf/DSNY-reports/Annual_by_Boro_District_FY12.pdf; See also Citizens Budget Commission, Taxes In: Garbage Out: The Need for Better Solid Waste Disposal Policies in New York City (May 2012), p. 14, www.cbcny.org/content/taxes-garbage-out-need-better-solid-waste-disposal-policies-new-york-city.
- Based on costs per ton of refuse and recycling for fiscal year 2012 reported in the Mayor’s Management Report and curbside and containerized collection data provided by DSNY for fiscal year 2012, plus diverted waste collected at DSNY special events, such as electronic waste, and textiles. New York City Mayor’s Office of Operations, Mayor’s Management Report, Fiscal Year 2013 (September 2013), p. 58, www.nyc.gov/html/ops/html/data/mmr.shtml.
- The private sector cost figure is the average private sector price for 2012 provided by the New York City Business Integrity Commission.
- Based on average price per ton for collection and disposal of $184.69, as reported to the New York City Business Integrity Commission. Private sector collection costs are total cost minus disposal costs. Disposal costs are estimated based on the distribution of waste among recyclables (paper, cardboard, combined plastic, metal and glass) and other material that is landfilled. The distribution is as reported by the New York State Department of Environmental Conservation for New York urban areas in 2008; it is assumed that 80 percent of recyclable material is appropriately recycled and the remainder is sent to landfill. The disposal cost per ton for each type of material is assumed to be the same as for the DSNY. Calculation assumes that 14 percent of commercial waste is cardboard; 14 percent is paper; 24 percent is metal, glass or plastic; and 49 percent is refuse. Analysis assumes carters receive $100 per ton of cardboard and $25 per ton of paper and pay recycling processers $72.58 per ton, which is the same as DSNY. Calculation assumes that carters pay $88 per ton of refuse, based on the fees at non-rail waste transfer stations used by DSNY in fiscal year 2011. See: New York State Department of Environmental Conservation, Solid Waste Composition and Characterization, MSW Materials Composition in New York State (2008), Detailed Composition Analysis Table, ftp://ftp.dec.state.ny.us/dshm/wastecomposition/wastecomp08.xls.
- Interview with Ron Bergamini, CEO of Action Environmental Group, (October 22, 2012).
- New York State Department of Environmental Conservation, Solid Waste Composition and Characterization, MSW Materials Composition in New York State, Urban: Residential and Commercial/Institutional, (2008), www.dec.ny.gov/chemical/65541.html.
- DSNY diversion figure based on data provided by DSNY for fiscal year 2012, plus diverted waste collected at DSNY special events, such as electronic waste and textiles. Commercial waste figure based on refuse and source separated recycling at private putrescible waste transfer stations from July 2011 through June 2012 (third quarter 2011 through second quarter 2012). Available from www.nyc.gov/html/nycwasteless/html/resources/reports_ll40.shtml. The commercial figure also includes diverted cans and bottles collected by retailers and organic waste collected by private landscaping companies and delivered to DSNY facilities. New York City Department of Sanitation, Annual Report for New York City Municipal Refuse and Recycling Statistics: Fiscal Year 2012, www.nyc.gov/html/dsny/html/Pub_Info/pub_info.shtml.
- International City/County Management Association (ICMA), Comparative Performance Measurement FY 2009 Data Report (August 2010), p. 48.
- Douglas Belkin, “Chicago Mayor Trashes Politics of Waste Removal,” The Wall Street Journal (October 13, 2011), online.wsj.com/article/SB10001424052970203476804576612851452362670.html.
- Does not include the cost of vehicle replacement. Department of Public Works - Government of the District of Columbia, FY12 Performance Accountability Report (January 2013), p. 6, track.dc.gov/Agency/KT0.
- DSNY’s comparable collection per ton rate for fiscal year 2009 was $228. See: City of New York, Mayor’s Management Report, Fiscal Year 2010 (September 2010), p. 108, www.nyc.gov/html/ops/downloads/pdf/mmr/0910_mmr.pdf.
- Lisa A. Skumatz and David J. Freeman, Pay as You Throw (PAYT) in the US: 2006 Update and Analyses (submitted by Skumatz Economic Research Associates to the United States Environmental Protection Agency, Office of Solid Waste, December 30, 2006), www.epa.gov/osw/conserve/tools/payt/pdf/sera06.pdf.
- New York City Mayor’s Office of Operations, Mayor’s Management Report, Annual Paid Absence Rates, Fiscal Year 2013 (September 2013), www.nyc.gov/html/ops/downloads/pdf/mmr2013/annual_paid_absence_rates.pdf.
- Michael Fickes, “Waste and the Windy City,” Waste Age (April 1, 2008), waste360.com/Collections_And_Transfer/waste_windy_city.
- United States Environmental Protection Agency, Getting More for Less: Improving Collection Efficiency (November 1999), www.epa.gov/osw/nonhaz/municipal/landfill/coll-eff/r99038.pdf.; National Solid Waste Management Association, Safety and the Solid Waste Industry: An Improving Picture, www.environmentalistseveryday.org/docs/research-bulletin/Research-Bulletin-Safety.pdf.
- One study found that average maintenance costs are about $8,000 for a manual truck but $14,000 for semi-automated trucks and $40,000 for fully-automated trucks. Jeremy K. O’Brien, The Benchmarking of Residential Solid Waste Collection Services (Solid Waste Association of North America 2007), www.docstoc.com/docs/15704384/THE-BENCHMARKING-OF-RESIDENTIAL-SOLID-WASTE-COLLECTION-SERVICES.
- A City Comptroller audit identified several problems with the devices including some inaccurate vehicle-position information and tablets not functioning properly, but it is not clear that this is the reason for the delay. See City of New York, Office of the Comptroller, Audit Report on the Deprtment of Sanitation’s Automatic Vehicle Location Application (November 9, 2011), www.comptroller.nyc.gov/bureaus/audit/PDF_FILES_2011/ME11-093A.pdf.
- Nagle, Robin. Picking Up: On the Streets and Behind the Trucks with the Sanitation Workers of New York City (Farrar, Straus and Giroux, 2013), p. 205.
- David Halbfinger, “GPS Units so Faulty, They Showed Fire Trucks in New York Harbor,” The New York Times (November 10, 2011) p. A32, www.nytimes.com/2011/11/10/nyregion/audit-faults-fire-and-sanitation-departments-gps-purchase.html?_r=0.
- PlowNYC, maps.nyc.gov/doitt/nycitymap/template?&applicationName=SNOW or www.nyc.gov/html/oem/html/nycsevereweather/weather_plowtracker.shtml.
- New York City Mayor’s Office of Operations, Mayor’s Management Report, Fiscal Year 2013 (September 2013), www.nyc.gov/html/ops/downloads/pdf/mmr2013/dsny.pdf.
- New York City Mayor’s Office of Operations, Mayor’s Management Report, Fiscal Year 2013 (September 2013), www.nyc.gov/html/ops/downloads/pdf/mmr2013/dsny.pdf.
- New York City Mayor’s Office of Environmental Coordination, 2012 City Environmental Quality Review, Technical Manual, Chapter 14: Solid Waste and Sanitation Services (January 2012), www.nyc.gov/html/oec/downloads/pdf/2012_ceqr_tm/2012_ceqr_tm_ch14_solid_waste_and_sanitation_services.pdf.
- New York City Local Law 59 of 1998, legistar.council.nyc.gov/LegislationDetail.aspx?ID=432053&GUID=436CBA79-825E-46B1-8F74-5ECE20ABAE9B&Options=ID|Text|&Search=59.
- New York City Department of Sanitation, Annual Report: New York City Curbside Municipal Refuse and Recycling Statistics by Borough and District (2012), www.nyc.gov/html/nycwasteless/downloads/pdf/DSNY-reports/Annual_by_Boro_District_FY12.pdf.
- New York City Mayor’s Office of Operations, Citywide Performance Reporting, www.nyc.gov/html/ops/cpr/html/home/home.shtml.
- New York City Mayor’s Office of Environmental Coordination, 2012 City Environmental Quality Review, Technical Manual, Chapter 14: Solid Waste and Sanitation Services, Paper and MGP Recycling Network (January 2012), www.nyc.gov/html/oec/downloads/pdf/2012_ceqr_tm/2012_ceqr_tm_ch14_solid_waste_paper_MGP_recycling_network.pdf.
- Independent Budget Office of the City of New York, Looking for Savings: Has the Switch to Dual-Bin Trucks for Some Recycling Pickups Increased Productivity (January 2012), www.ibo.nyc.ny.us/iboreports/dualbinjan2012.pdf.
- New York City Department of Sanitation, 2012 Annual Report on Alternative Fuel Vehicle Programs Pursuant to Local Law 38 of 2005 (March 25, 2013), p. 1, www.nyc.gov/html/dsny/downloads/pdf/pubinfo/annual/Hybrid/LL38_2013_Final.pdf.
- CBC analysis of fiscal year 2012 collection data by route. Data provided by the New York City Department of Sanitation.
- New York City Economic Development Corporation, Sims Municipal Recycling Facility, www.nycedc.com/project/sims-municipal-recycling-facility.
- Action Environmental Services, “Action Environmental Group, Inc. announces its launch of an Optical Sorter to improve the way NYC businesses recycle at the NYC GoGreen conference” (press release, September 26, 2013). www.actioncarting.com/Action/News-and-Awards/All-News/Action-OpticalSorter.
- Data based on Private Industry, Administrative and Waste Services, NAICS code 560000. See: United States Department of Labor, Bureau of Labor Statistics, Quarterly Census of Employment and Wages (2012), http://data.bls.gov/cgi-bin/dsrv?en; and New York City Office of Management and Budget, Executive Budget for Fiscal Year 2014, Message of the Mayor, May 2, 2013, p. 136. Available from http://www.nyc.gov/html/omb/downloads/pdf/mm5_13.pdf.
- New York City Office of Labor Relations, 2007-2011 Memorandum of Understanding Between the City of New York and the Uniformed Sanitationmen’s Association, www.nyc.gov/html/olr/downloads/pdf/collective_bargaining/Sanitation%20Workers,%20CBU%2049,%20Uniformed%20Sanitationmen%27s%20Association,%20MOU,%2003-02-07%20to%2009-20-11.pdf.; Steven Greenhouse, “City Reaches Innovative Deal on Sanitation Contract,” The New York Times (October 12, 2005), www.nytimes.com/2005/10/12/nyregion/12cnd-sanitation.html?_r=0.; Data for the original two-worker truck bonus from the Independent Budget Office of the City of New York, Budget Options (May 2013), p. 38, www.ibo.nyc.ny.us/iboreports/options2013.pdf.
- Data based on Private Industry, Administrative and Waste Services, NAICS code 560000. See: United States, Department of Labor, Bureau of Labor Statistics, National Compensation Survey – Benefits (2012), http://data.bls.gov/cgi-bin/dsrv?nb.
- Chapter 551 of the Laws of 1962 of the State of New York. Administrative Code of the City of New York, Section 16-108.
- New York City Mayor’s Office of Operations, Mayor’s Management Report, Annual Paid Absence Rates, Fiscal Year 2013, http://www.nyc.gov/html/ops/downloads/pdf/mmr2013/annual_paid_absence_rates.pdf.
- Data based on Private Industry, Administrative and Waste Services, NAICS code 560000. See: United States, Department of Labor, Bureau of Labor Statistics, National Compensation Survey – Benefits (2012), http://data.bls.gov/cgi-bin/dsrv?nb.
- CBC analysis of fiscal year 2012 collection data by route. Data provided by the New York City Department of Sanitation.; New York City Mayor’s Office of Environmental Coordination, 2012 City Environmental Quality Review, Technical Manual, Chapter 14: Solid Waste and Sanitation Services (January 2012), www.nyc.gov/html/oec/downloads/pdf/2012_ceqr_tm/2012_ceqr_tm_ch14_solid_waste_and_sanitation_services.pdf.
- The District of Columbia offers twice per week collection to portions of three out of eight wards and once per week collection to the rest of the city.; District of Columbia, Department of Public Works, Residential Trash Collection, dpw.dc.gov/node/418382.; In contrast to New York City, progressive cities in the field of solid waste management have moved toward every other week refuse collection. Seattle conducted a six-month pilot called the “One Less Truck Project” to test the idea, and Portland, Oregon switched to every other week refuse collection in October 2011. Both cities offer separate collection for food waste and have high recycling rates.; Portland Bureau of Planning and Sustainability, New Curbside Collection Service Year One Report (December 5, 2012), www.portlandoregon.gov/bps/article/423510.
- CBC analysis of fiscal year 2012 collection data by route. Data provided by the New York City Department of Sanitation.
- New York City Department of Sanitation, Commercial Waste Management Study, Volume II: Commercial Waste Generation and Projections, Appendix C (prepared by Henningson, Durham & Richardson Architecture and Engineering, P.C. and its Subconsultants, March 2004), p. 12, www.nyc.gov/html/dsny/downloads/pdf/swmp/swmp/cwms/cwms-ces/v2-cwgp.pdf.
- New York City Department of Sanitation, Fiscal Year 2012 Annual Report, p. 16, www.nyc.gov/html/dsny/downloads/pdf/pubinfo/annual/ar2012.pdf.
- New York City Mayor’s Office of Operations, Mayor’s Management Report, Fiscal Year 2013, www.nyc.gov/html/ops/downloads/pdf/mmr2013/dsny.pdf.
- Email communication with Lesley Gordon, Public Information Officer of the Indianapolis Department of Public Works, September 17, 2013.; City of Indianapolis, Department of Public Works, Snow Division and Solid Waste Districts, www.indy.gov/eGov/City/DPW/Snow/Pages/SnowHome.aspx and www.indy.gov/eGov/City/DPW/Trash/Pages/SolidWasteDistricts.aspx.
- City of Toronto, 311 Knowledge Base, Salt – Snow Management Plan – Road Salting – Facts – Statistics – Salt Brine – Snow Clearing Budget, www.toronto.ca/311/knowledgebase/19/101000039419.html.
- The Council of the City of New York, Report of the Infrastructure Division and Committee on Sanitation and Solid Waste Management, Oversight: Private Contracts and Snow Management (June 27, 2013), legistar.council.nyc.gov/View.ashx?M=F&ID=2556664&GUID=42CF9AE1-23D6-455B-883D-3E4C8AFDB550.
- Email communication with Flatbush Business Improvement District, July 25, 2013.; Samina Iqbal and Alanna Talty, Impacts of New York City Waste on 125th Street BID (Urban Design Lab, The Earth Institute at Columbia University, April 2007), Appendix A, www.urbandesignlab.columbia.edu/?pid=city_waste. Data for 125th Street BID is as of April 2007.
- Los Angeles, Department of Public Works, Bureau of Sanitation, Authority to Implement an Exclusive Franchise Waste Hauling System in the City of Los Angeles (February 13, 2012), lacitysan.org/solid_resources/pdfs/2012/Adopted_Board_Report_2-13-12.pdf.