The Challenge of Producing a $2 Billion Surplus
Governor Cuomo has stated the $2 billion in tax cuts he proposed in his State of the State address on January 8 can be paid for with surplus funds that will become available in fiscal year 2016-17 if State Operating Funds disbursements can be held to an annual growth rate of no more than 2 percent and receipts grow as projected. With school aid and Medicaid – the two largest items in the state budget – growing at annual rates at or above 4 percent under separate statutory caps, all other categories of spending, including agency operations, will face offsetting reductions to the plan if the net increase in overall state spending is to be kept to 2 percent.
Holding spending growth to 2 percent to generate $2.4 billion surplus - According to the last update to the State’s four-year financial plan issued in November 2013, State Operating Funds spending is projected to increase from $93.8 billion in fiscal year 2014-15 to $101.5 billion in fiscal year 2016-17, a change of $7.7 billion or 4 percent on average annually. Over the same period receipts are projected to increase at an average annual rate of 3.9 percent. Because disbursements are projected to outstrip receipts, the plan shows budget gaps that range from $1.6 billion in fiscal year 2014-15 to $2.7 billion in fiscal year 2015-16. If, as anticipated, the new four-year financial plan released with the Governor’s Executive Budget next Tuesday reduces the annual spending growth assumption from 3.7 percent to 2.0 percent, budget gaps become surpluses. (See Table 1.)
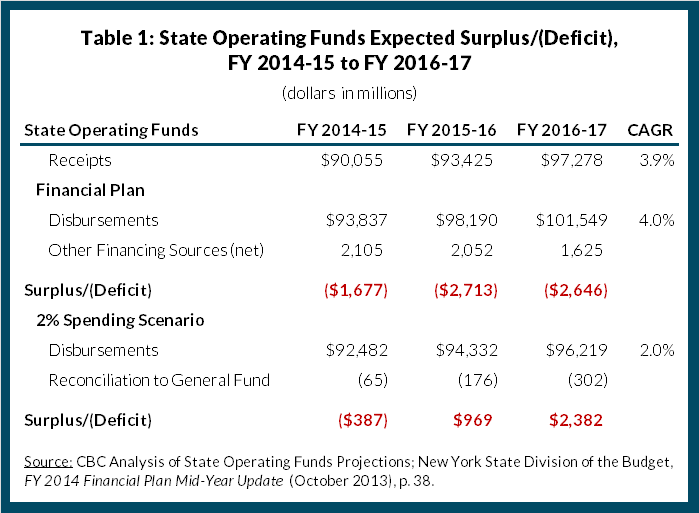
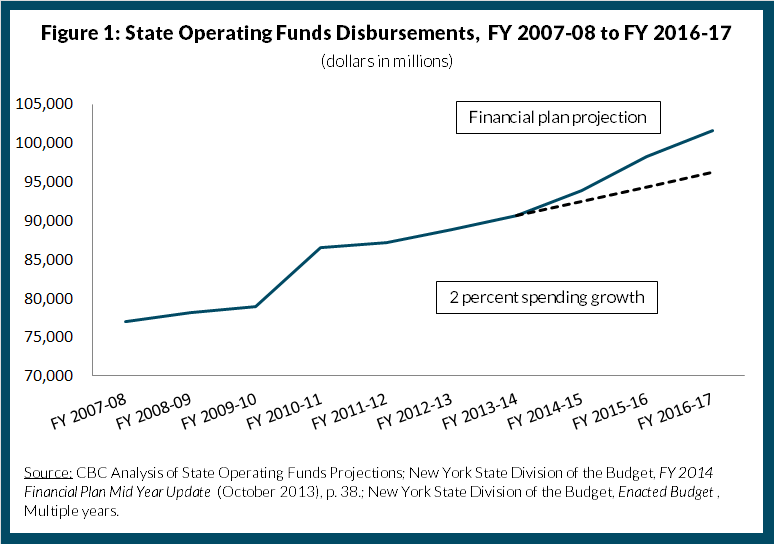
Under the 2 percent scenario, State Operating Funds disbursements would rise by $3.7 billion over the financial plan instead of $7.7 billion, increasing from $92.5 billion in fiscal year 2014-15 to $96.2 billion in fiscal year 2016-17. (See Figure 1.) In other words, a $5 billion reduction in planned spending is needed to generate a $2.4 billion surplus.[1]
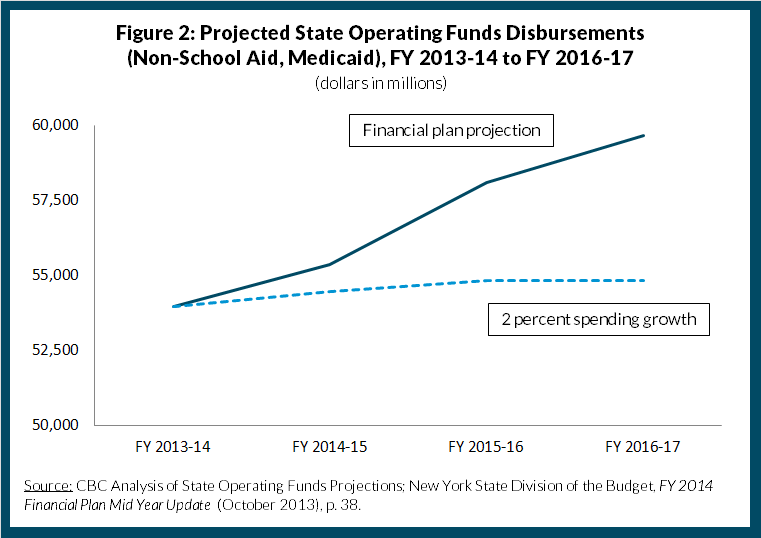
Although the change may look simple on paper, making reductions of this scale will be challenging. Medicaid and school aid comprise $36.7 billion of total State Operating Funds spending, or 40 percent. Medicaid growth, capped by statute at the medical component of the consumer price index, is projected to be 4 percent annually, accounting for $2 billion of the total projected increase over the financial plan period. Similarly, school aid, capped at the annual increase in New York’s personal income, is projected to increase from $20.5 billion to $23.6 billion, an average annual growth rate of 4.9 percent. The legislature is unlikely to set spending levels in these two large programs below what is allowable by statute, meaning all other areas of state spending will bear the brunt of the reduction needed to achieve 2 percent spending growth.
Subtracting school aid and Medicaid, all other spending could increase by just $362 million over the four-year period, or 0.2 percent annually, if the State is to meet the 2 percent spending growth goal. (See Figure 2.)
Achieving near-total cost containment across all other categories of State Operating Funds spending will be difficult. Growth in some categories, including debt service and fringe benefits, is relatively fixed, and direct state agency spending for corrections, facilities for the mentally ill and developmentally disabled, state police, and other services has been held essentially flat since fiscal year 2010-11; it will be harder to produce savings in these areas going forward. Spending expectations for all other areas of local government assistance will also need to be managed.
- Pension and fringe benefit costs are hard to control - At a cost of $13.1 billion in fiscal year 2013-14, debt service and fringe benefit costs for health insurance, pensions, and other benefits comprise 24 percent of all other spending. By fiscal year 2016-17 they are expected to reach $15.1 billion, an increase of $2.0 billion or 4.7 percent on average annually. Debt service payments on long-term debt, largely driven by capital spending in prior years, are expected to rise at an average annual rate of 3.8 percent, adding $6.8 billion to spending by fiscal year 2016-17. Options for controlling this growth are limited; planned capital spending could be reduced, but the impact on operating spending in the near term is likely to be small. Other debt management actions to lower costs such as refinancing to capture lower interest rates have already been taken during the recent period of ultra-low interest rates.
Fringe benefit costs comprise 13.1 percent of all other spending and are expected to increase at an average annual rate of 5.5 percent over the financial plan period, adding $1.2 billion in spending. The mid-year update assumes health insurance premiums will grow 8.5 percent per year, after two years of low increases; 3.1 percent and 5.4 percent in fiscal years 2012-13 and 2013-14, respectively. Although recent national trends point to moderating growth in health insurance premiums[2] a switch to less conservative assumptions for the financial plan would be premature. Management actions in this area have already been taken – premium sharing for State employees increased in the last collective bargaining agreement from 10 to 12 percent for single policies and 25 to 27 percent for family policies depending on income. Pension costs have also been trimmed by the addition of a less expensive tier of pension benefits for new employees.
- State agency operating budgets will face continued cost containment pressure - Spending on agency operations including spending for SUNY, corrections, mental health and hygiene, and services for people with developmental disabilities amounted to $17.8 billion in fiscal year 2013-14, comprising 19.7 percent of total State Operating Funds spending. Agency operations spending is projected to increase to $19.2 billion, a change of $1.3 billion or 2.4 percent per year on average. Under the 2 percent scenario – to provide offsetting reductions to the areas that are expected to grow at rates higher than 2 percent – spending in nominal terms on these services would need to be brought down by $913 million, $3.2 billion, and $4.8 billion in fiscal years 2014-15, 2015-16, and 2016-17, respectively. Under this assumption spending on operations would decrease at an average annual rate of 7 percent to reach its lowest level since fiscal year 2007-08.
Reductions of this magnitude pose a significant challenge for agencies that have already significantly contracted since fiscal year 2010-11. Agencies have experienced limited growth and have reduced payroll significantly since fiscal year 2010-11. All Funds spending on agency operations has grown from $19.1 billion in that year to $19.6 billion, an annualized average growth rate of 0.8 percent.[3] In inflation-adjusted terms, agency operations have actually dipped below their fiscal year 2010-11 funding levels, falling 4.2 percent to $18.3 billion in fiscal year 2010-11 dollars. To accommodate limited growth agencies have decreased payroll by shedding employees. Since fiscal year 2010-11, the State workforce has fallen from 209,231 to 200,742, a total decline of 4.1 percent.[4]Much of the low-hanging fruit – elimination of redundant personnel, automation of administrative functions, shared services and consolidation, and the elimination of nonessential services – has already been gathered as agencies experienced round after round of cuts.
- Projections for other local government assistance will be under pressure - The remainder of State Operating Funds – about $23 billion – goes to other local assistance. Spending for these programs has actually declined since 2010; from fiscal years 2010-11 to 2013-14 the average annual rate of decrease in all other local government assistance was 0.9 percent. In contrast, mid-year projections show growth of 3.4 percent on average from fiscal year 2013-14 to 2016-17. These expectations will also have to be curtailed.
Spending restraint has helped New York State’s finances begin to recover from the devastating effects of the Great Recession. Keeping State Operating Funds spending growth under 2 percent will require continued discipline and serious efforts at agency reform and redesign. Amid the discussion of how to “spend” a surplus it will be a challenge to rein in the expectations of legislators and interest groups that growth in state spending is needed.
Footnotes
- Analysis is based on State Operating Funds receipts projected by the FY 2014 Mid-Year Update to the Financial Plan. New York State Division of the Budget, FY 2014 Financial Plan Mid-Year Update (October 2013), p. 38, publications.budget.ny.gov/budgetFP/enacted1314.html.
- Over the past two years, the cost of health insurance nationally has grown at rates slower than long-term trends. According to the Kaiser Family Foundation’s 2013 Employer Health Benefits Survey, single coverage increased 3.4 percent and 4.8 percent in 2012 and 2013 respectively, while family coverage increased at 4.5 percent and 3.8 percent in 2012 and 2013. Both of these are well below the 15-year average annualized rates of 7.3 percent for single coverage and 7.7 percent for family coverage. Kaiser Family Foundation and Health Research & Educational Trust, 2013 Employer Health Benefits Survey (2013),
- The use of All Funds – Operations as opposed to State Operating Funds – Operations is intentional, as it gives a truer indication of the amount spent to operate a State agency relative to other State agencies. Some agencies derive, or have derived in the past, a significant portion of their operations budgets from federal funds.
- State headcount based on All Funds totals. New York State Division of the Budget, FY 2014 Financial Plan Mid-Year Update, Workforce Impact Summary – All Funds (October 2013), p. T-66, publications.budget.ny.gov/budgetFP/enacted1314.html.