Cleaning House
How to Close the New York City Housing Authority's Operating Gaps
Introduction
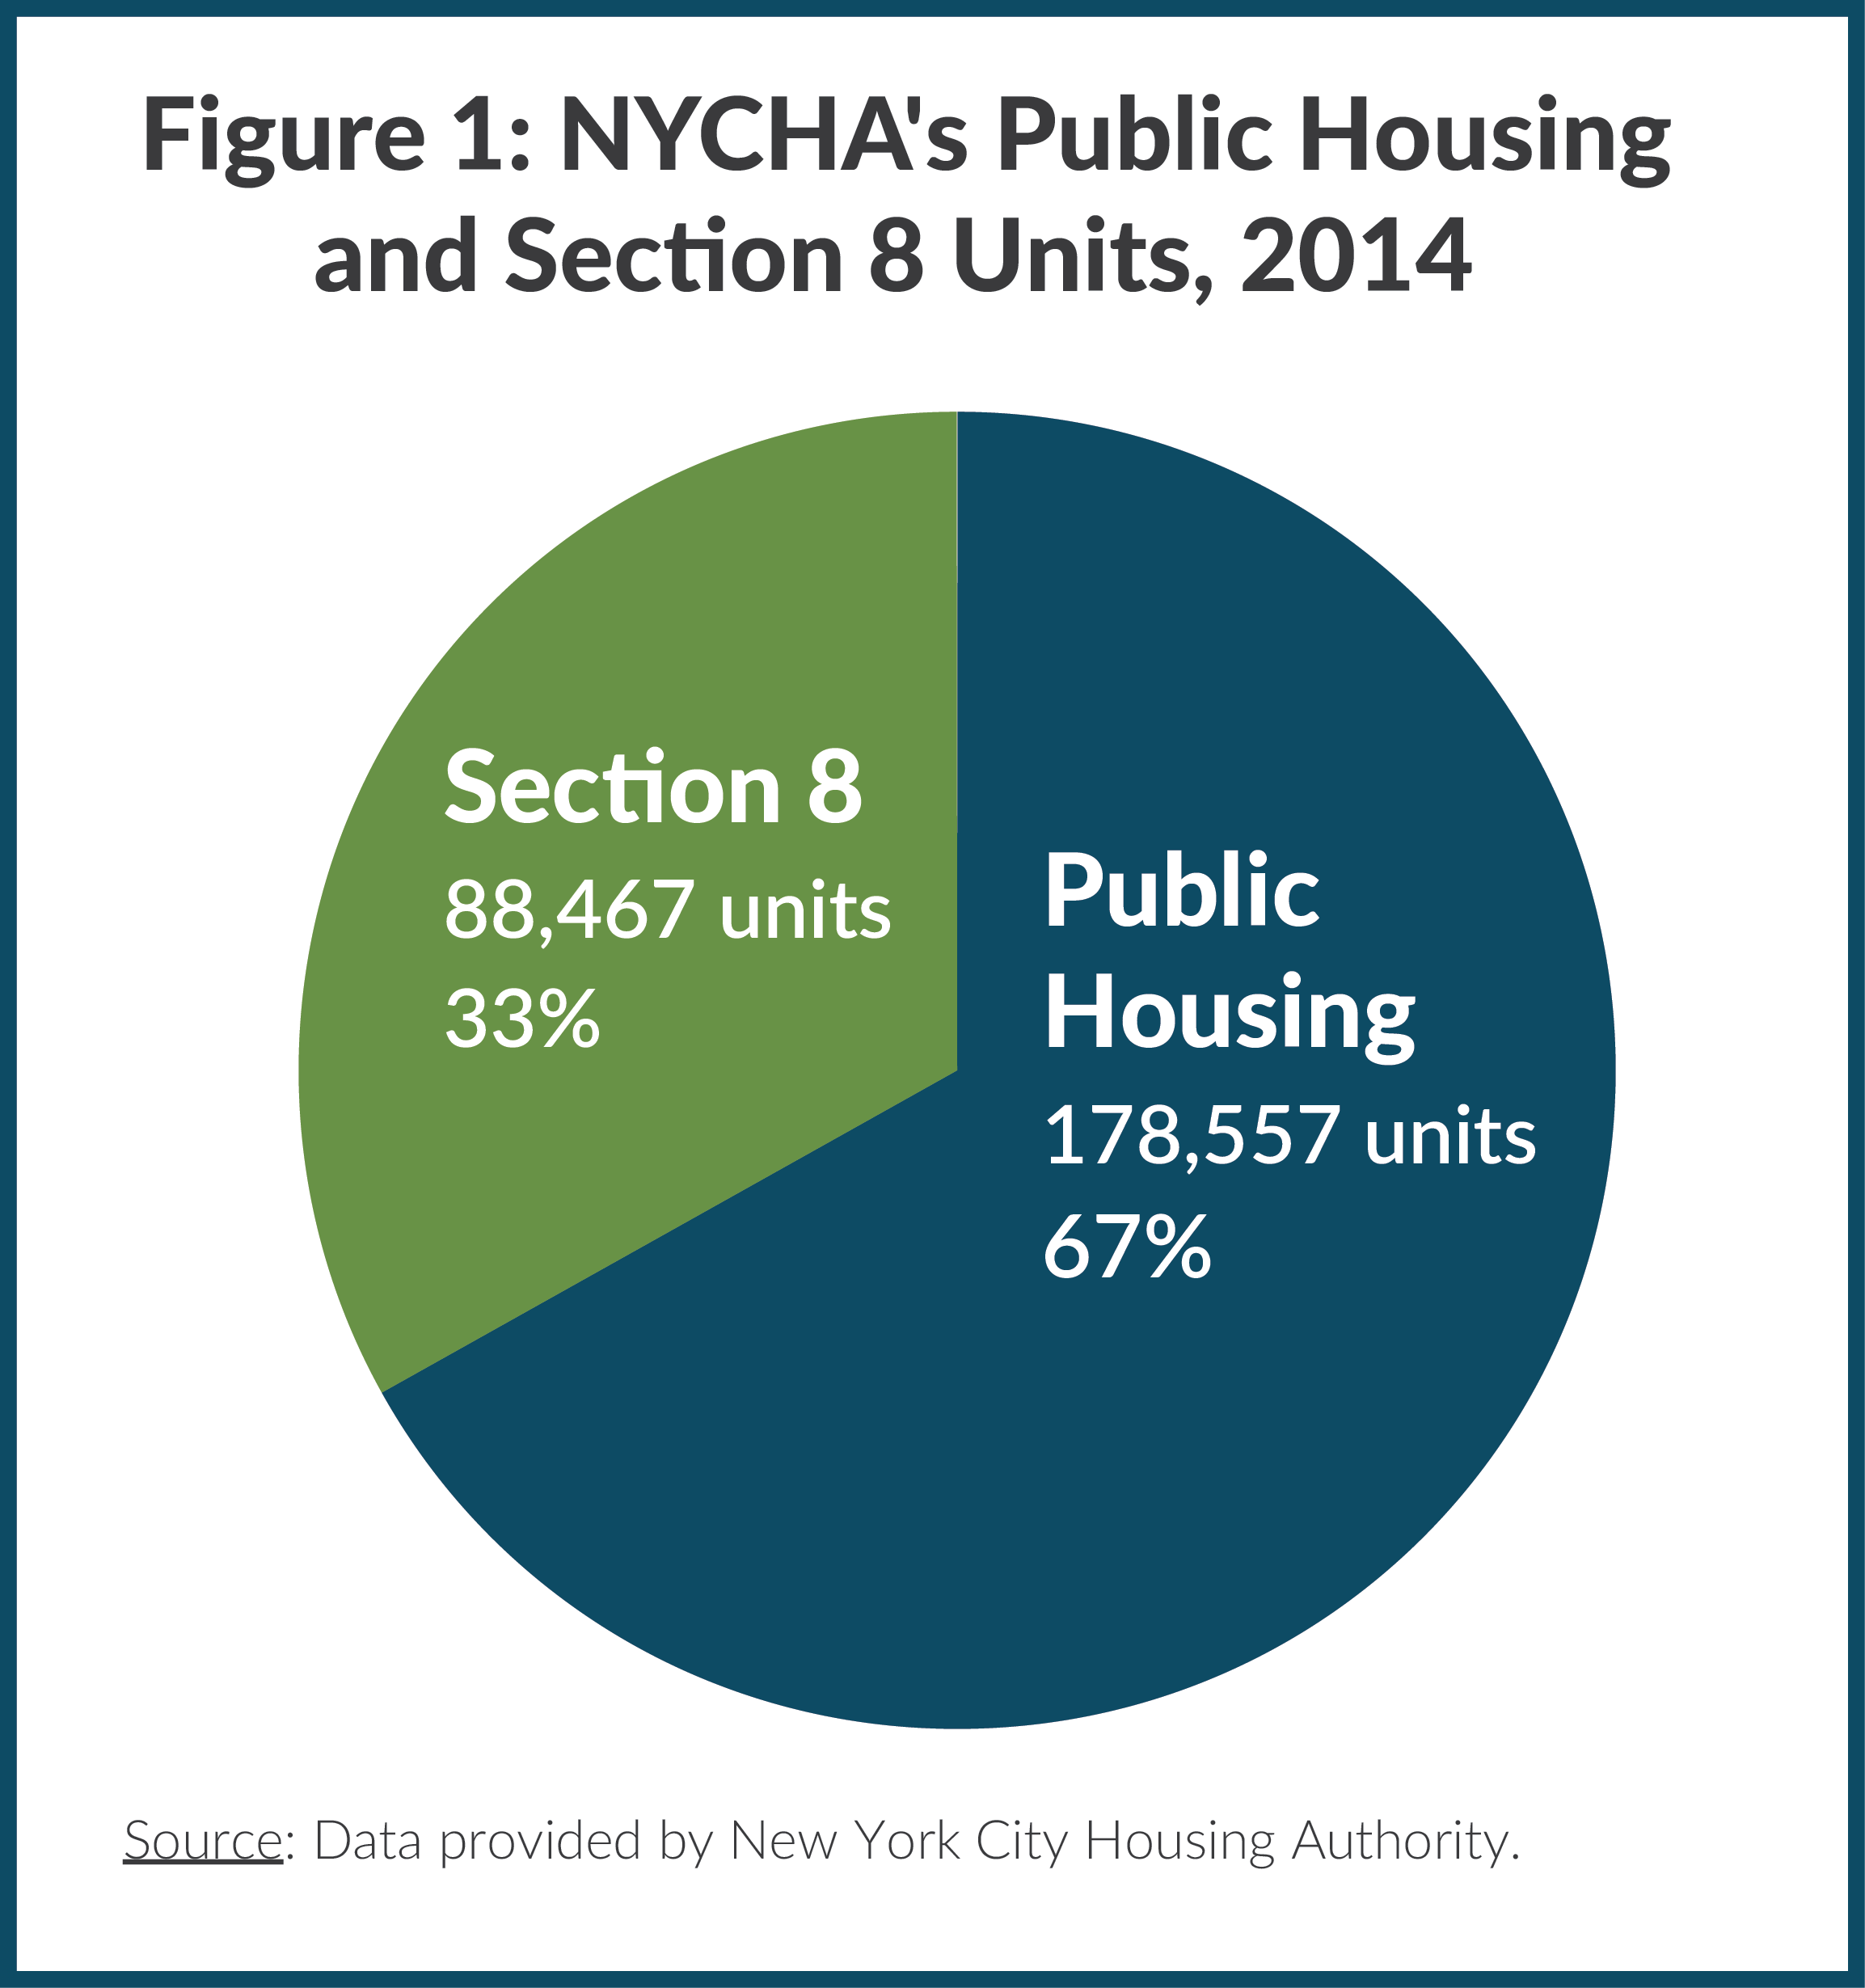
The New York City Housing Authority (NYCHA) was established in 1934 to construct, operate, and maintain public housing for low- and middle-income individuals and families. Today NYCHA provides housing for more than 615,000 people through two programs: conventional public housing and Section 8 Housing Choice Vouchers. The public housing program includes 334 developments with approximately 178,500 housing units at an annual operating cost of $2.6 billion.1 The Section 8 program expands NYCHA’s capacity beyond its physical buildings to the private rental market, subsidizing rent for about 90,000 households at an annual cost of $1 billion. Combined, these programs serve a population larger than cities such as Sacramento, Atlanta, and Miami and comprise more than 12 percent of the City’s rental housing units.
The City of New York has substantial influence over NYCHA’s operations. First, the mayor appoints the entire seven-member board, including the salaried Chair, who serves at the pleasure of the mayor.2 The other six board members, which include three tenant representatives, serve staggered three-year terms and receive stipends based on their hours of work. Mayor Bill de Blasio appointed the current Chair and Chief Executive Officer, Shola Olatoye, in February 2014 and has made two additional appointments to the board.
Second, NYCHA has significant financial ties to the City. Most of the Authority’s 11,000 employees are represented by the same unions as City employees and are compensated similarly. NYCHA receives a property tax exemption and periodic operating and capital support from the City, must meet the same stringent standard as the City to submit updates to its four-year financial plan using generally accepted accounting principles four times a year to the New York State Financial Control Board, and can be audited by the New York City Comptroller.3 Unlike the City, NYCHA’s fiscal year begins on January 1.
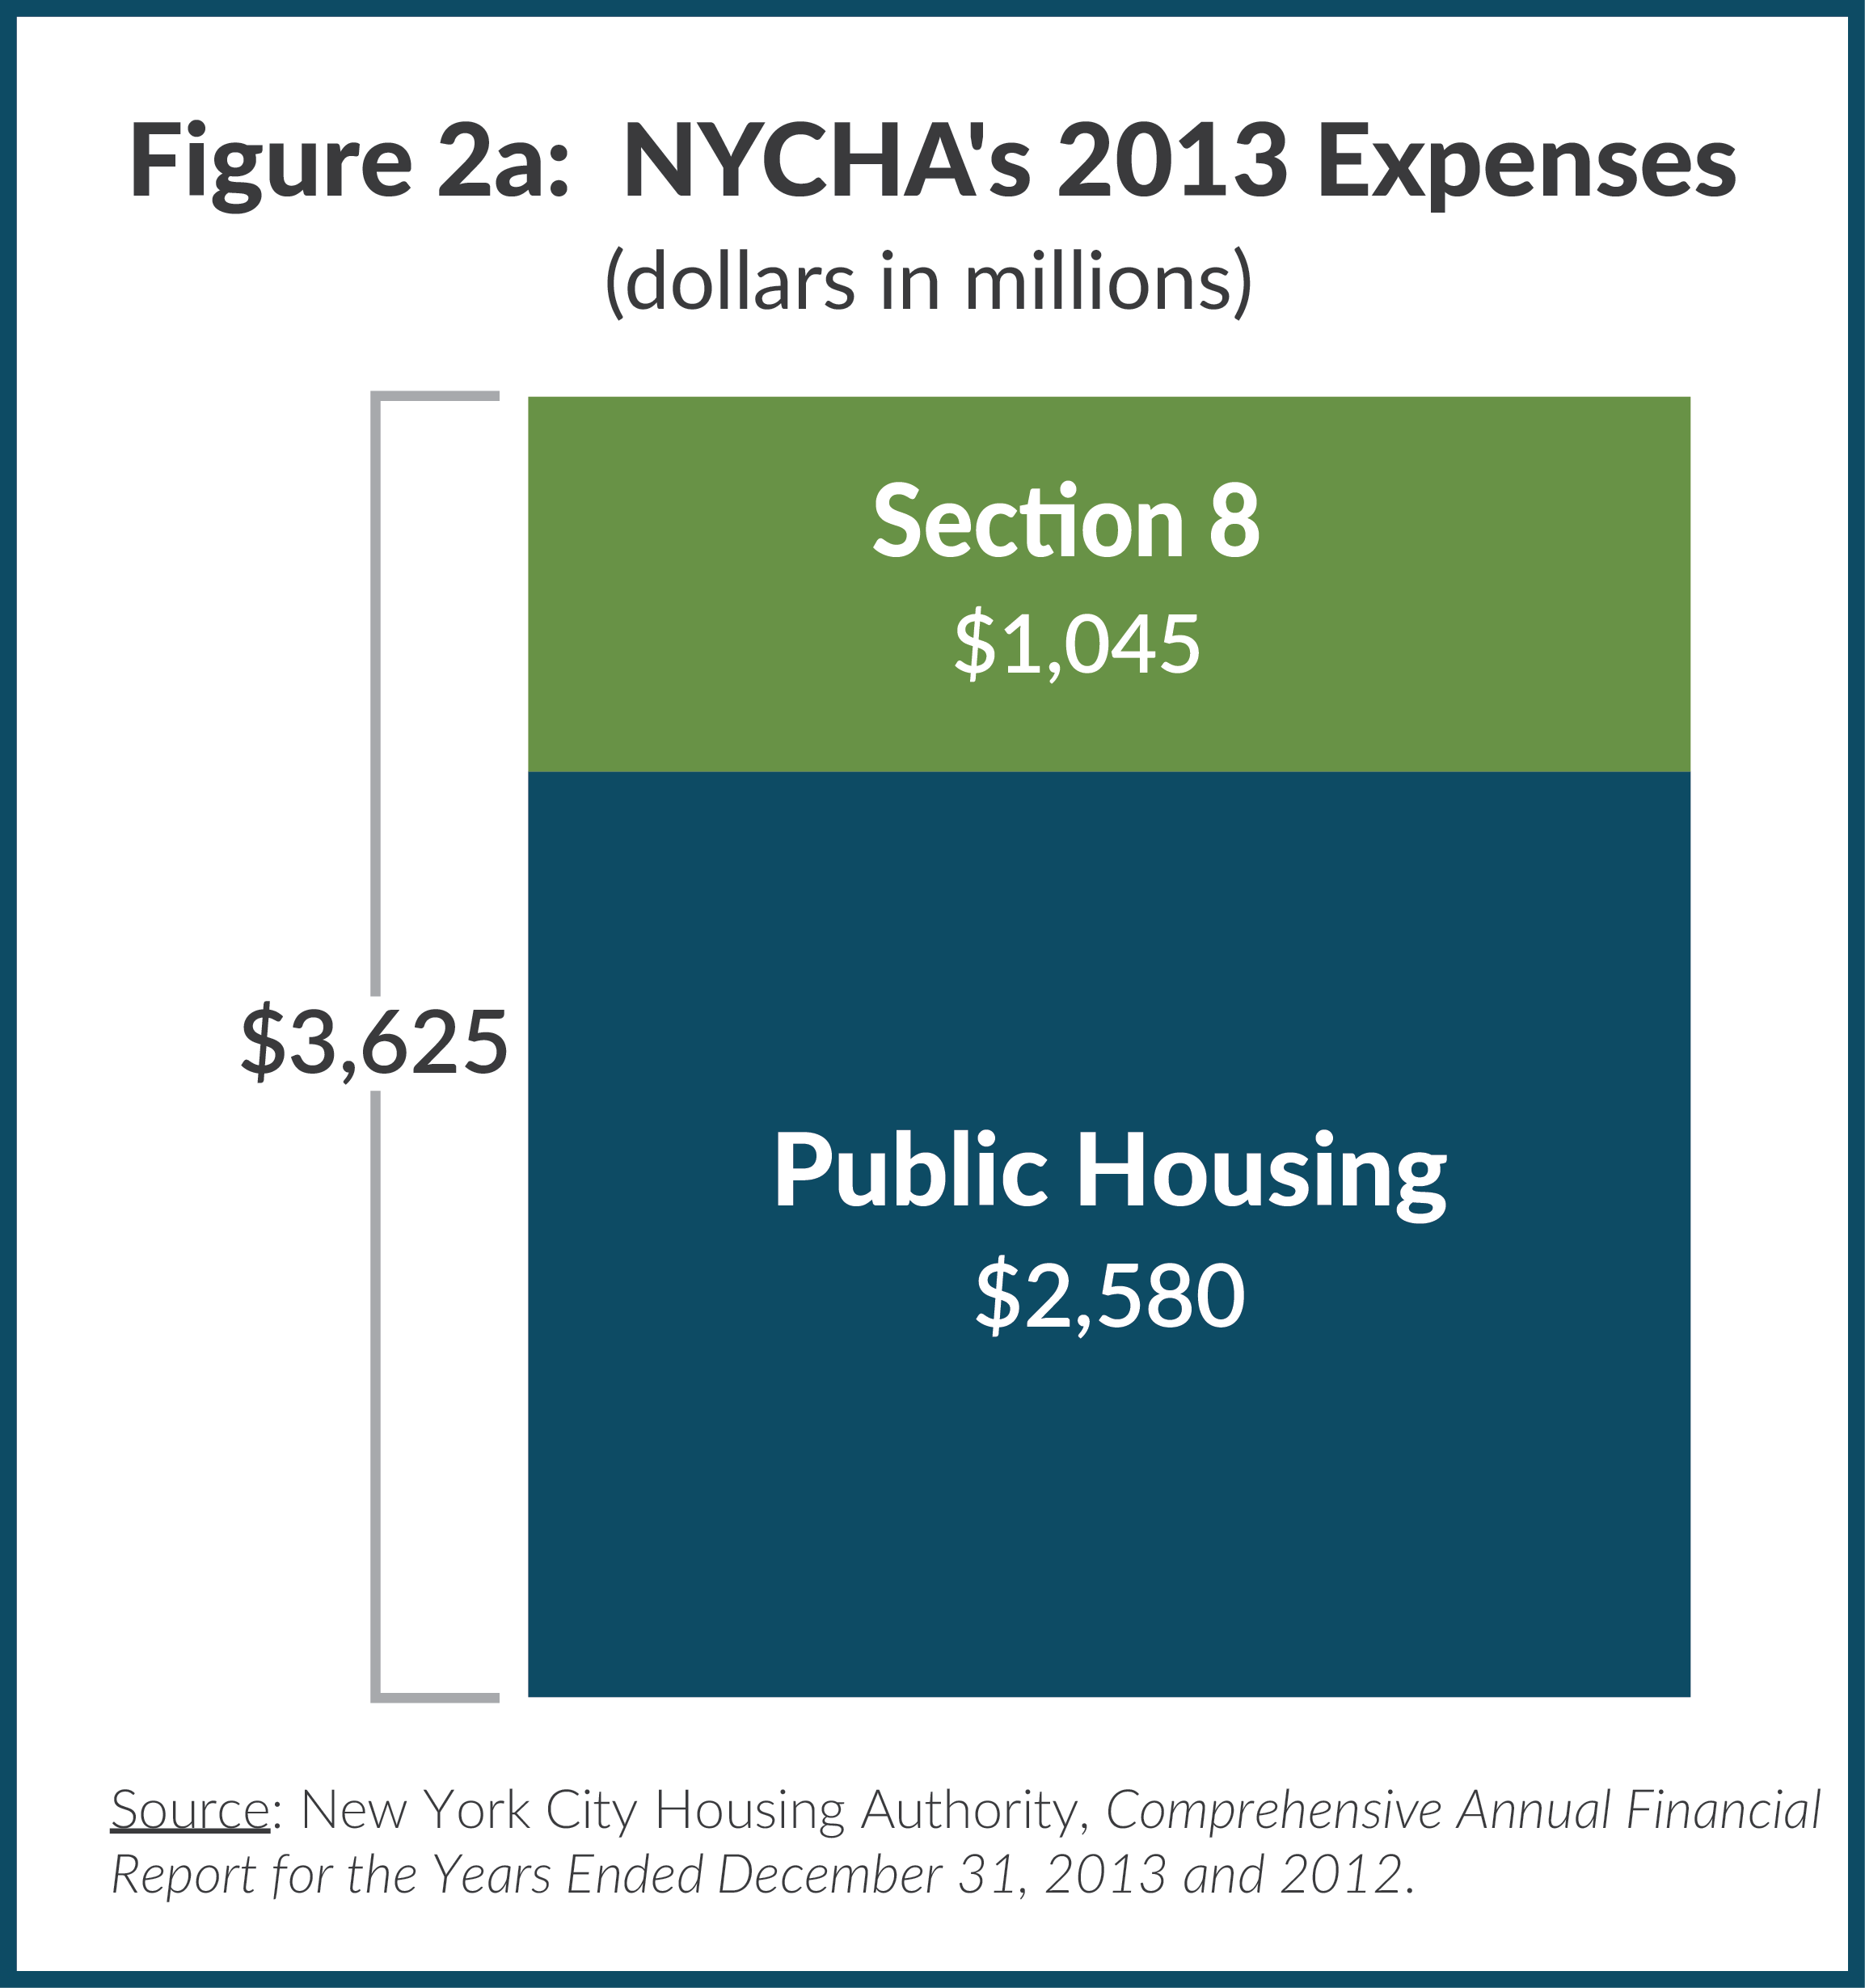
Figures 2a and 2b show expenses and revenues for 2013, the most recent fiscal year for which there are audited financial statements. Total expenses were $3.6 billion, comprised of $2.6 billion, or 71 percent, for public housing and $1 billion for Section 8. The $3.6 billion budget includes $500 million in noncash expenses for depreciation and other post-employment benefits (OPEB). Depreciation is an accounting concept that reflects the use and diminishing value of capital assets over time, but does not directly correspond to cash outlays. OPEB is the expense associated with funding future retiree health obligations; while NYCHA recognizes the expense on its books, there is no requirement to fund this obligation, and NYCHA does not do so.
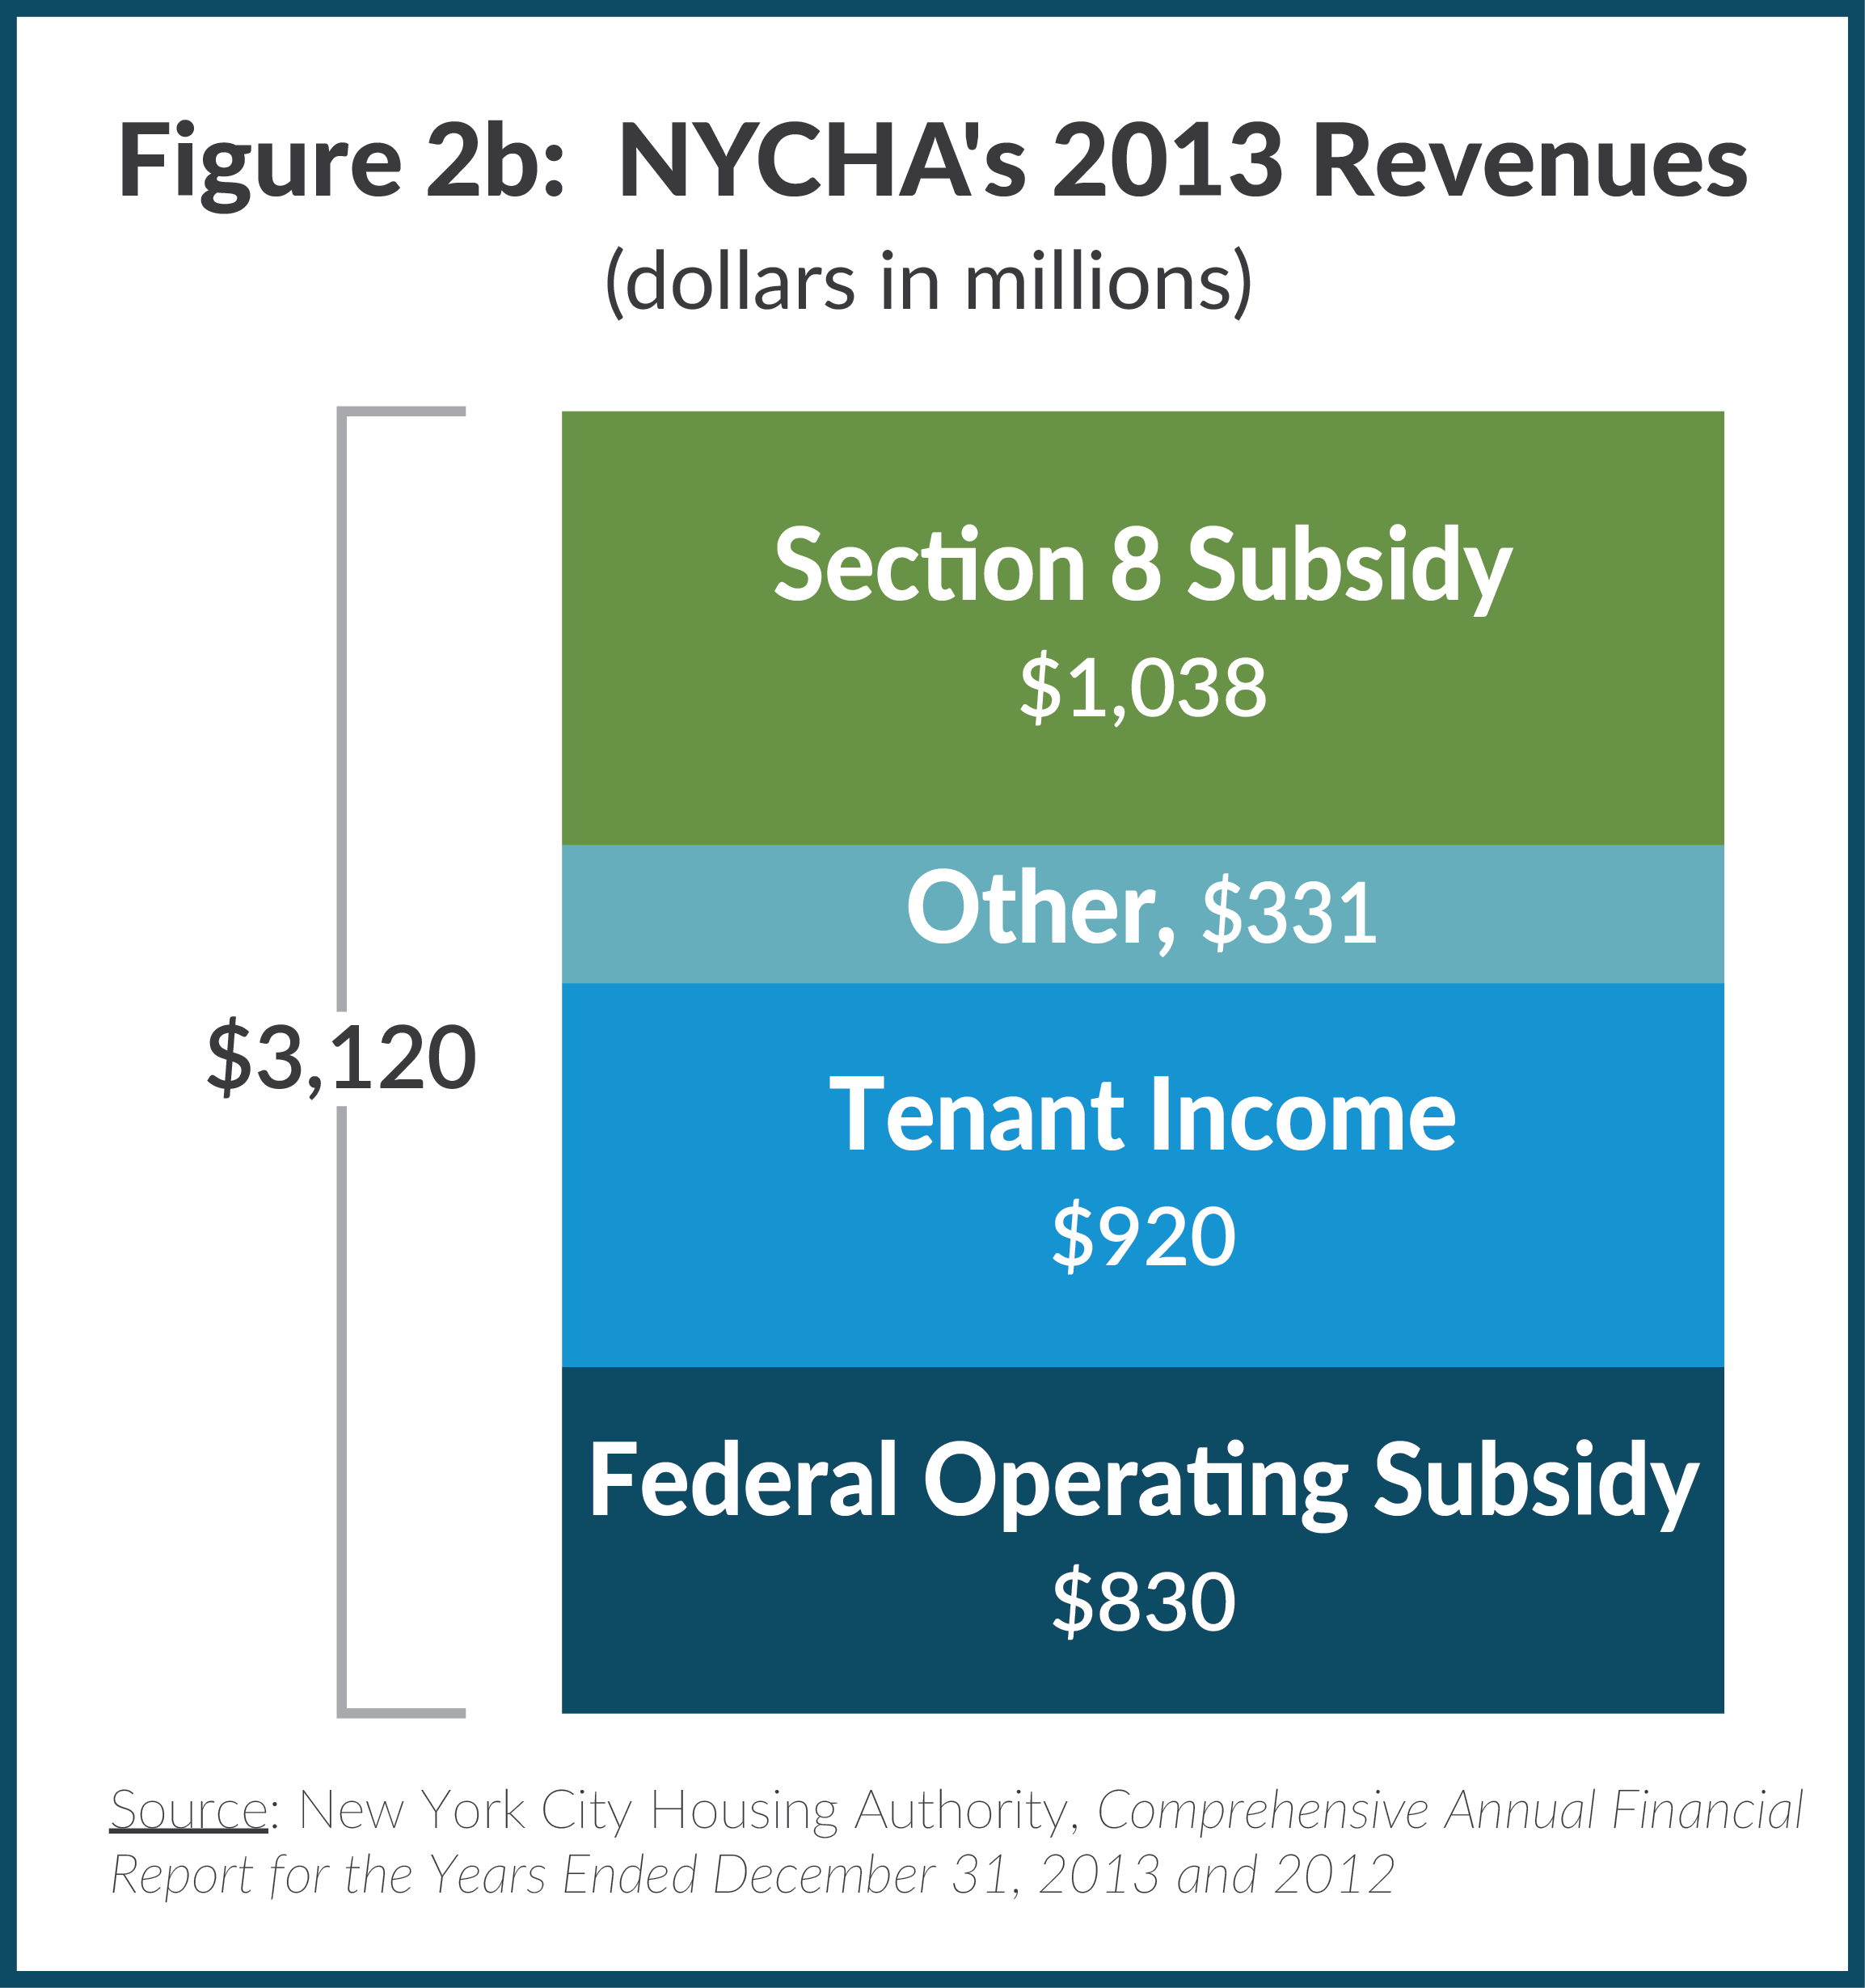
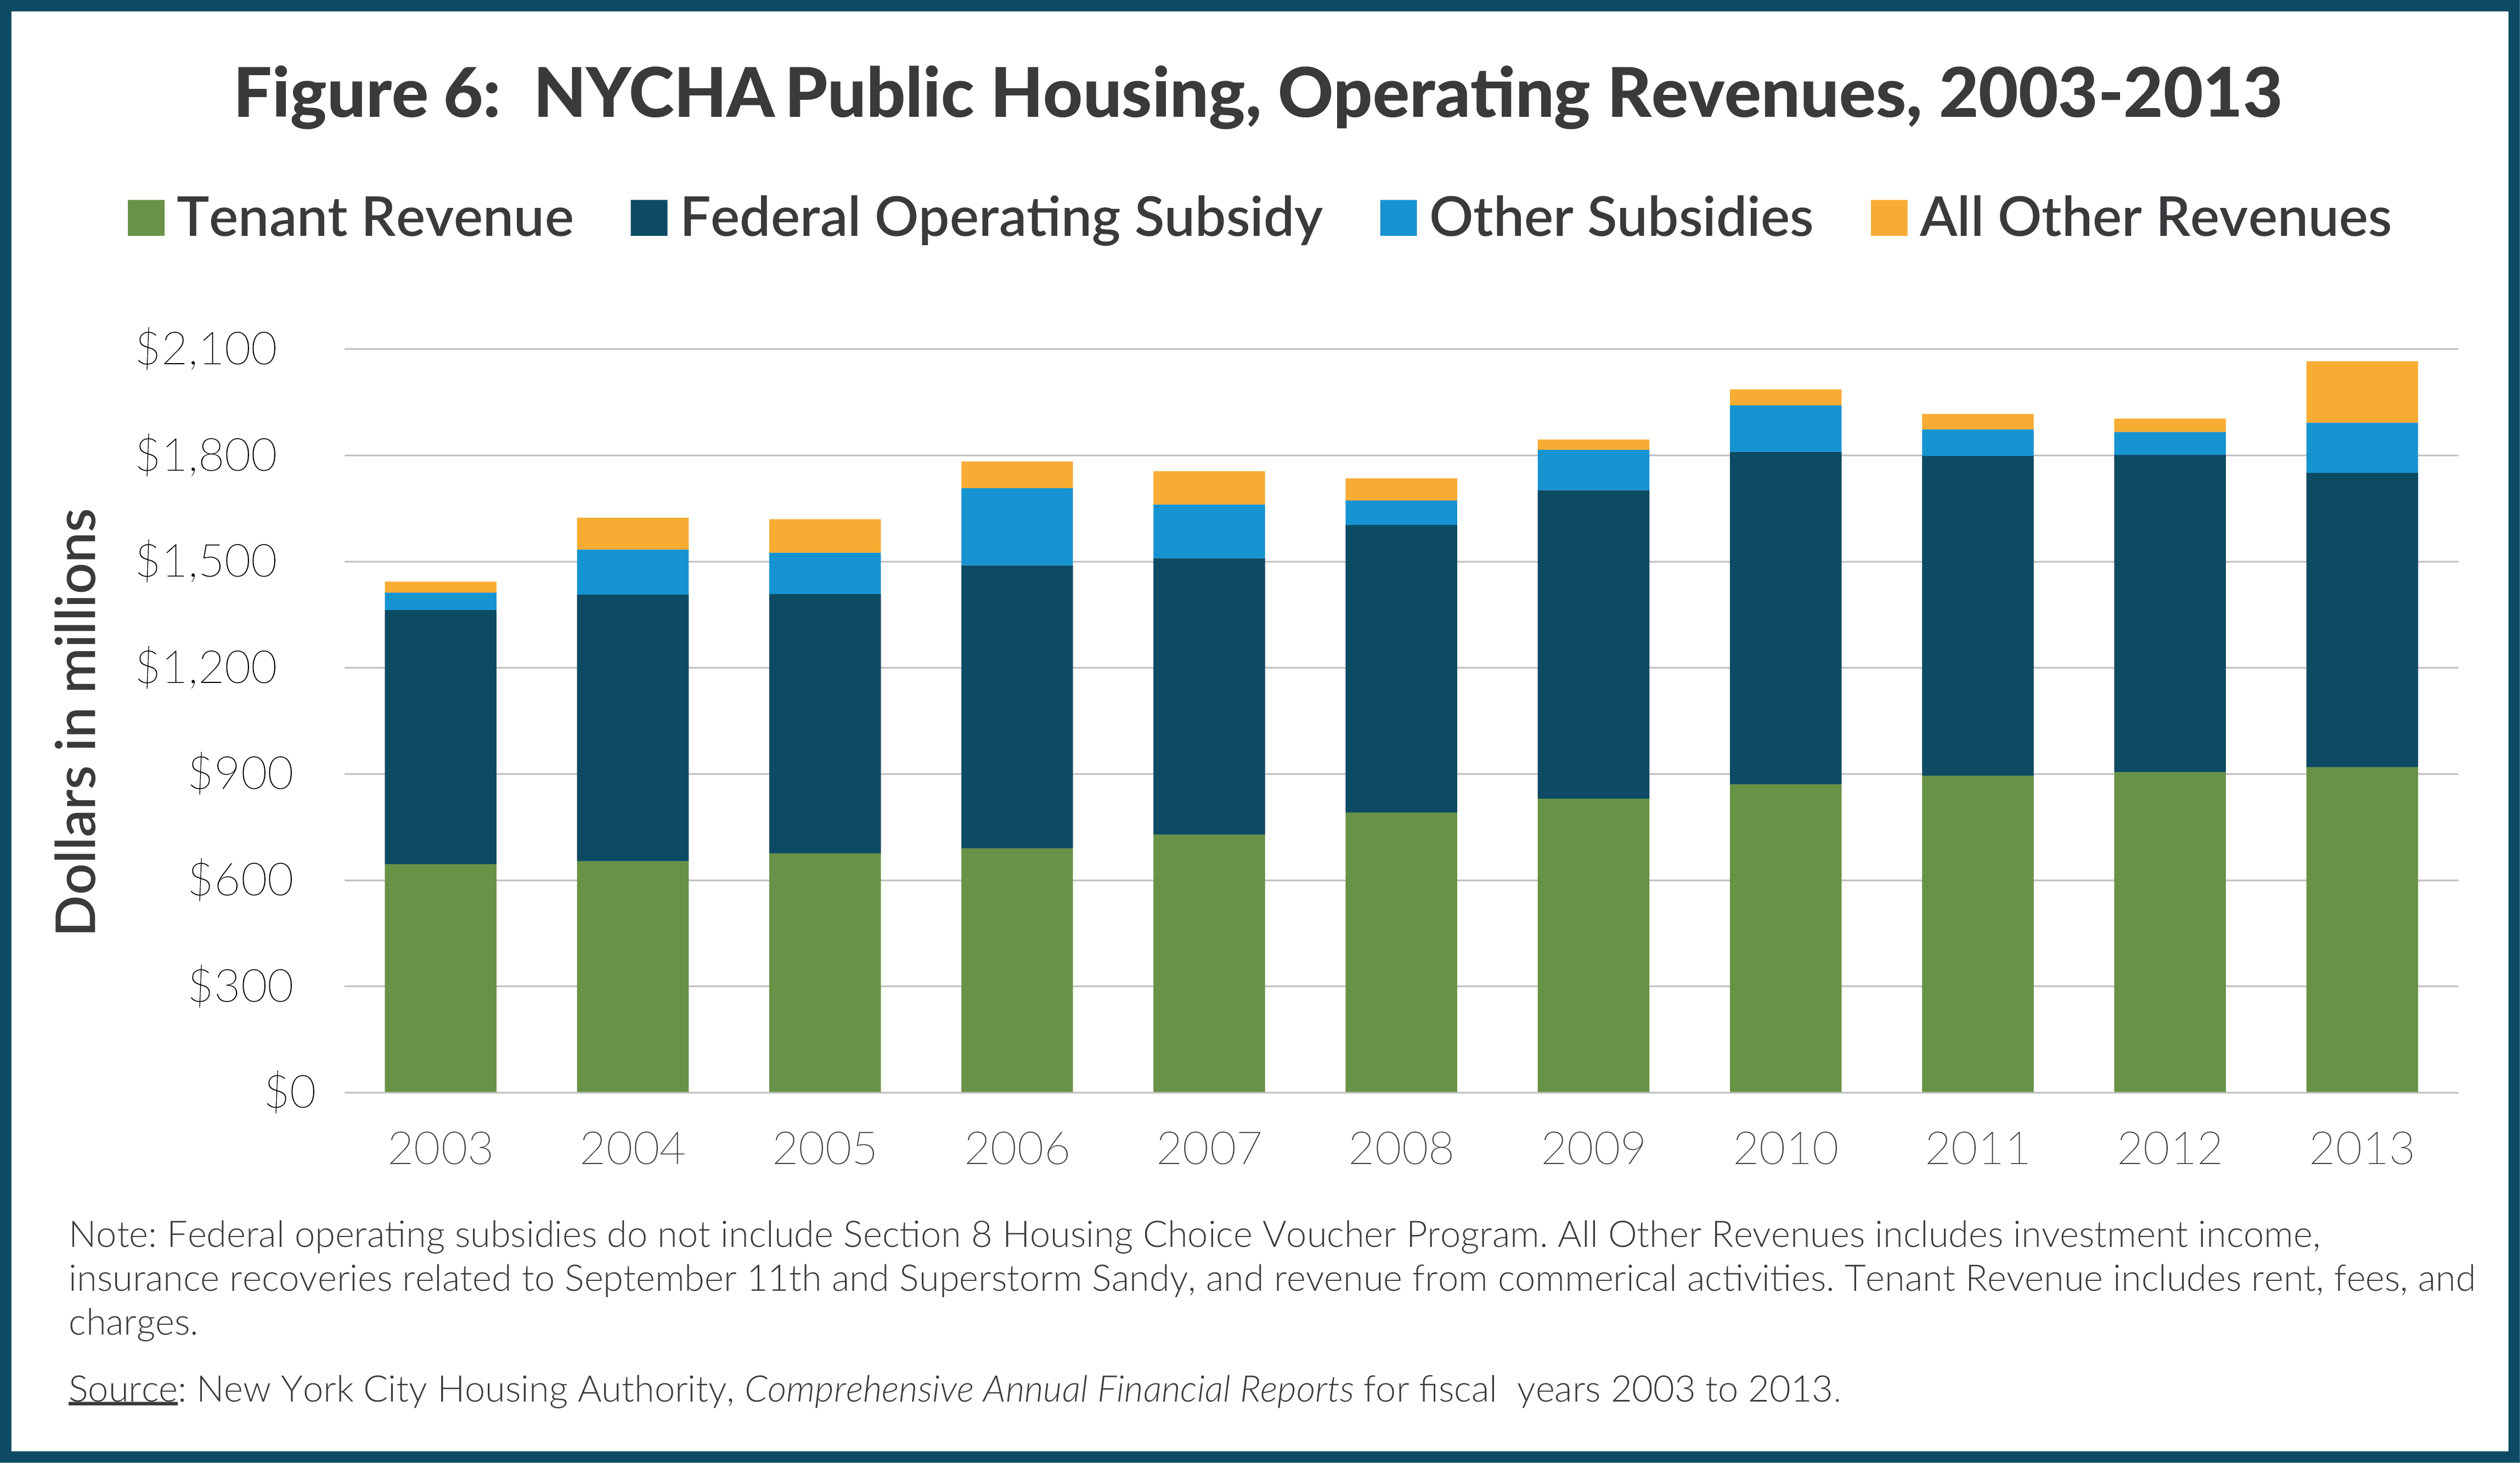
NYCHA’s total revenues were $3.1 billion in 2013. Tenant income, which includes rents and fees, paid for a large part of the public housing program, accounting for $920 million. NYCHA also received substantial federal funds, including $830 million in public housing operating subsidy and $1 billion in Section 8 subsidy. Other funds totaled $331 million and include insurance recoveries from Superstorm Sandy, other federal grants, and City funding. The difference between revenues and expenses reflects the noncash expenses of depreciation and OPEB, as well as a $69 million operating deficit in that year.
This report focuses on the finances and management of NYCHA’s public housing program. The Section 8 Housing Choice Voucher Program is excluded because it is distinct from public housing and operates under a separate contract with the U.S. Department of Housing and Urban Development (HUD). Using federal funds, NYCHA awards tenants vouchers that provide for the difference between 30 percent of their income and private market rent.
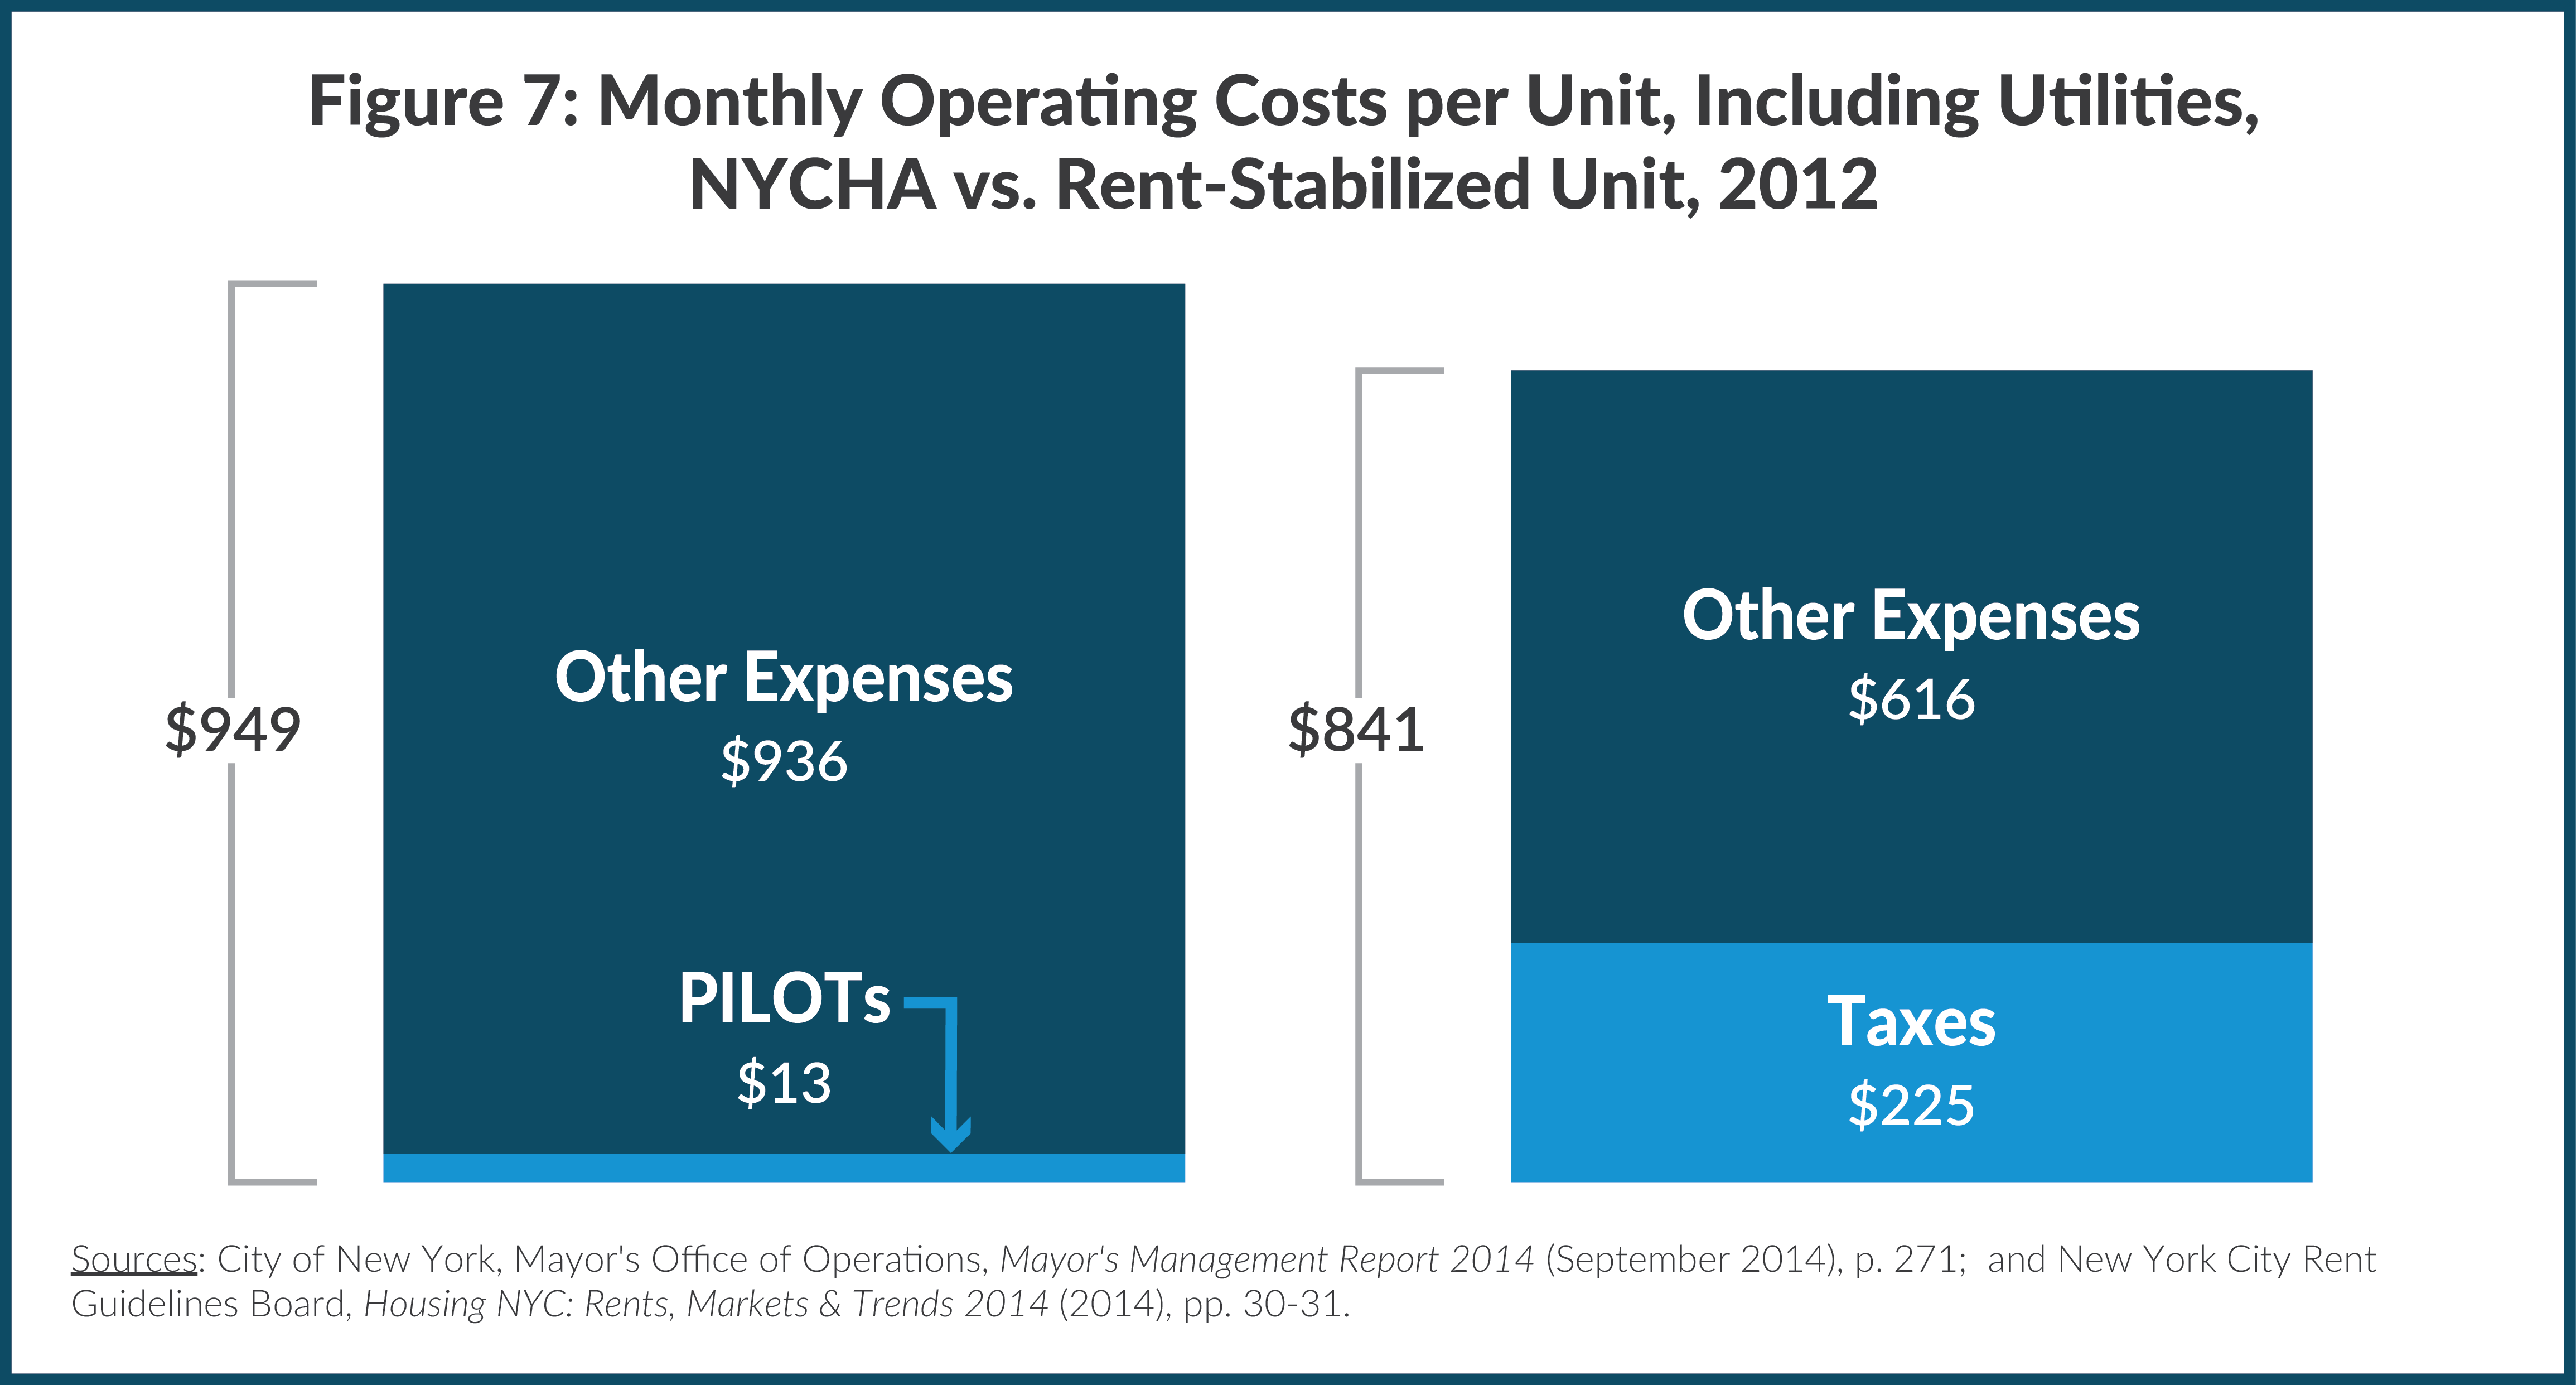
Unlike other landlords NYCHA is limited in its ability to raise rents and relies on a federal operating subsidy for 40 percent of its operating income. While federal subsidies were once a generous funding stream, waning political support for public housing has reduced the subsidies available. NYCHA has not revamped its operations in response; its rent collection rate is poor, it has not vigorously pursed opportunities to increase non-rental income, and it has not executed its gap-closing plans in an effective manner. Its monthly operating costs remain high— $936 per unit in 2012, compared to $616 per rent-stabilized unit elsewhere in the City.
NYCHA has turned to the City for help, and Mayors Michael Bloomberg and Bill de Blasio and members of the City Council have dedicated additional City resources for operations, capital repairs, and safety concerns. Despite that additional assistance, NYCHA continues to struggle to balance its books, and its financial plan projects an operating deficit for public housing of $98.2 million in 2015 that grows to $194.2 million by 2019.
This report provides a financial analysis that explains NYCHA’s operating model, identifies reasons for operating deficits, and offers recommendations for improving NYCHA’s fiscal condition.
A Brief History of Public Housing in New York City
NYCHA was created to address two substantial problems plaguing New York City during the 1930s: poor living conditions in tenements and high unemployment. In the midst of the Great Depression, the unemployment rate reached 25 percent citywide.4 Housing conditions in the city’s tenement buildings were abysmal, characterized by crowding, rodent infestations, little sunlight, and poor or nonexistent sanitary facilities. Attempts to improve conditions through zoning law changes and to increase housing supply through limited dividend corporations were ineffective.5
State and local leaders responded with increased government intervention. The New York State Municipal Housing Authority Law (MHAL) of 1934 allowed cities to create local housing authorities that could exercise eminent domain to clear slums and build low-income housing. The MHAL empowered local housing authorities to issue debt to be repaid by tenant rents without voter approval; neither the State nor municipalities would be liable for the debt as the authorities would be distinct legal entities.6 Mayor Fiorello LaGuardia created NYCHA in 1934.
Subsequent legislative actions further expanded the available funding streams for low-income housing. In 1938 a constitutional change enabled the State and local governments to allocate money from their general funds for capital or periodic subsidies to housing authorities, as well as to incur debt directly to finance low-income housing.7 The New York State Public Housing Law of 1939 gave municipalities greater control over development; in New York City, the Board of Estimate and the City Planning Commission were authorized to approve all public housing projects, ensuring the City’s loans or subsidies were approved in the same manner as other capital projects.8 For State-subsidized projects, the law required the City to provide a subsidy of equal value, though this could be in the form of a property tax exemption.9
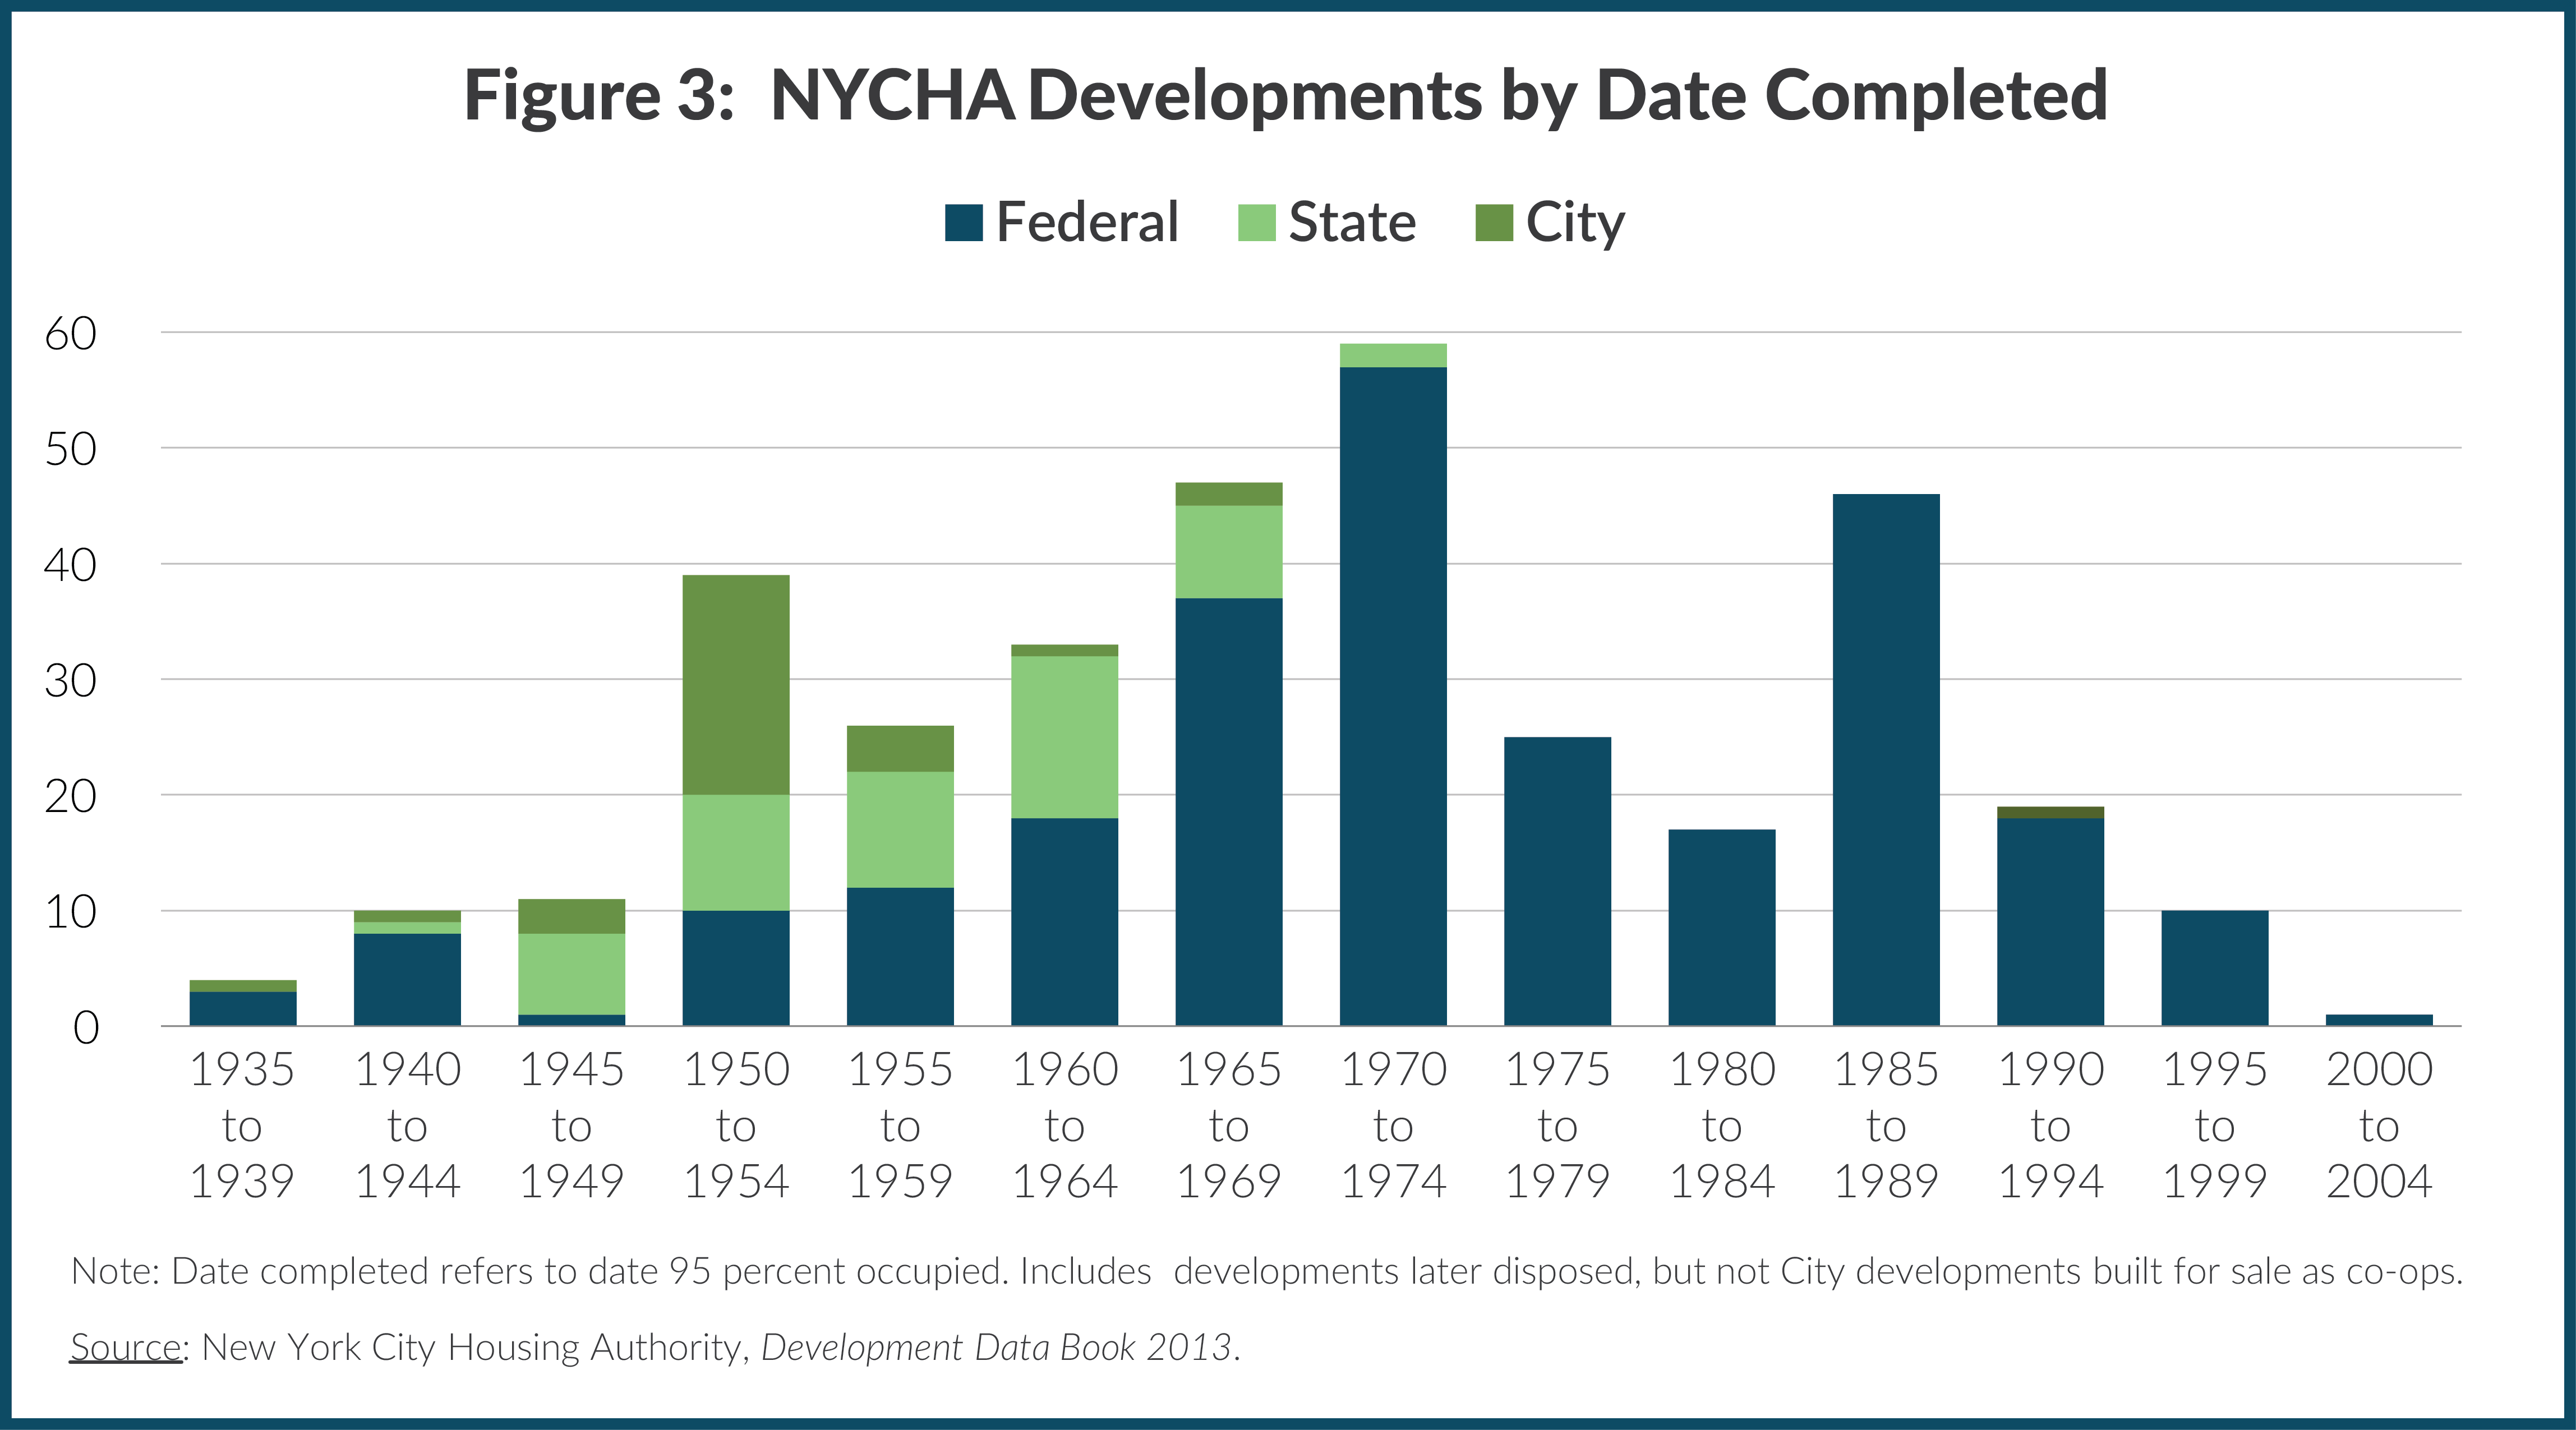
Federal funding from the Public Works Administration and other New Deal programs was available to support the development of early public housing projects, but the federal government did not create a true public housing program until the enactment of the U.S. Housing Act of 1937.10 The 1937 law established the U.S. Housing Authority, later succeeded by the Department of Housing and Urban Development (HUD), to disburse capital funds and annual subsidies to local housing authorities with the goal of eradicating slums and creating safe and sanitary housing conditions for low-income families.11 With this additional federal funding, NYCHA began to ramp up construction and operation of public housing. While only 4 developments were constructed and occupied in the 1930s, 21 were completed in the 1940s, and 65 in the 1950s. Construction peaked in the 1960s and 1970s, when a total of 164 developments, about half of today’s total, were built. (See Figure 3.) The pace of construction subsequently declined, but continued into the last decade. Three-fourths of the developments were backed by federal dollars.
Differing Financial Models
The differences in financing sources had important implications for tenant mix, rent levels, and ultimately, the financial viability of the developments. The federal model, through which the vast majority of units were built, provided debt service subsidies large enough to pay for the entire capital cost of buildings. Debt service costs were substantial: in 1961 they comprised 40 percent of the federal program’s expenses. As a result, in federally sponsored developments, NYCHA rents were set to cover only operating expenses, enabling these developments to serve low-income families.
In contrast, in City-funded developments, NYCHA was expected to collect sufficient rent to fund operations and to repay the debt issued to construct the developments.12 There were few restrictions on rent and rent increases, allowing these developments to serve working families. State-backed developments received debt service subsidies, but rents and tenants were not as strictly regulated as in federally sponsored developments.
Income eligibility varied significantly between the federal and city programs. For example, in 1961 the maximum income level for a family of three was $4,680 in the federal program, $4,990 in the state program, and $6,452 in the city program ($37,054, $39,509, and $51,084, respectively in 2014 dollars)— a difference of 38 percent between the federal and city programs. Income requirements varied until 1984, when NYCHA adopted uniform maximum income criteria.
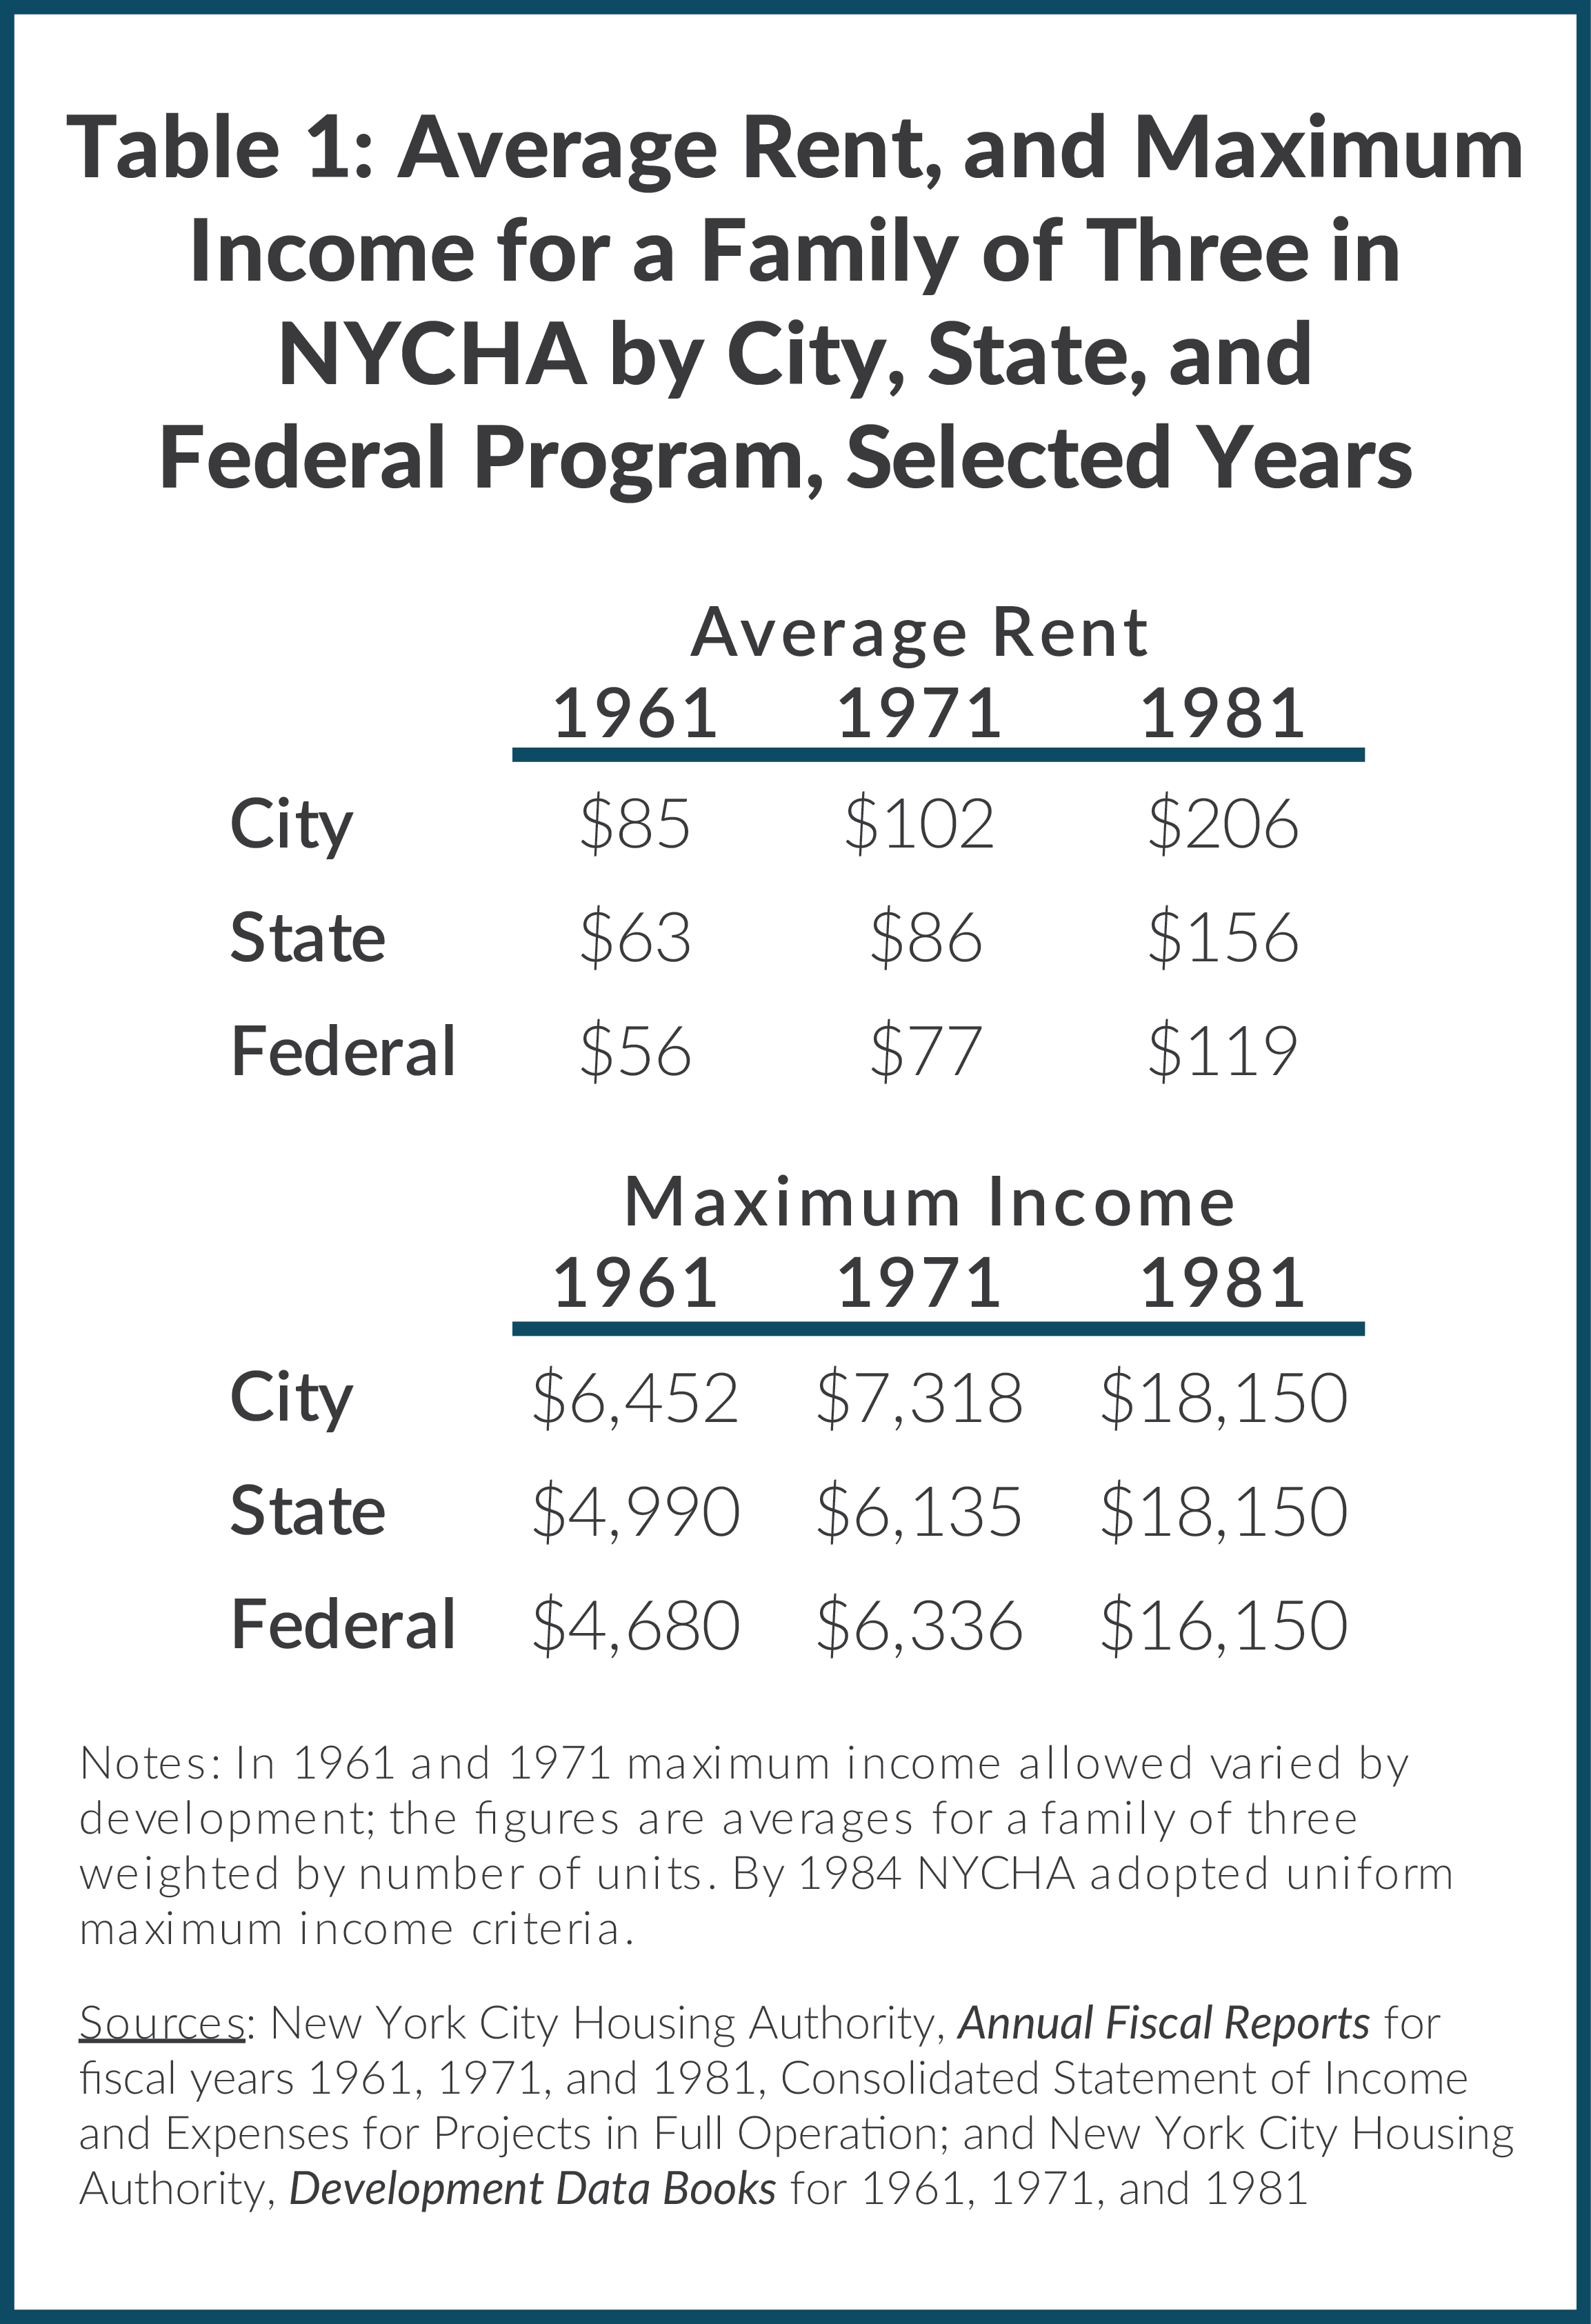
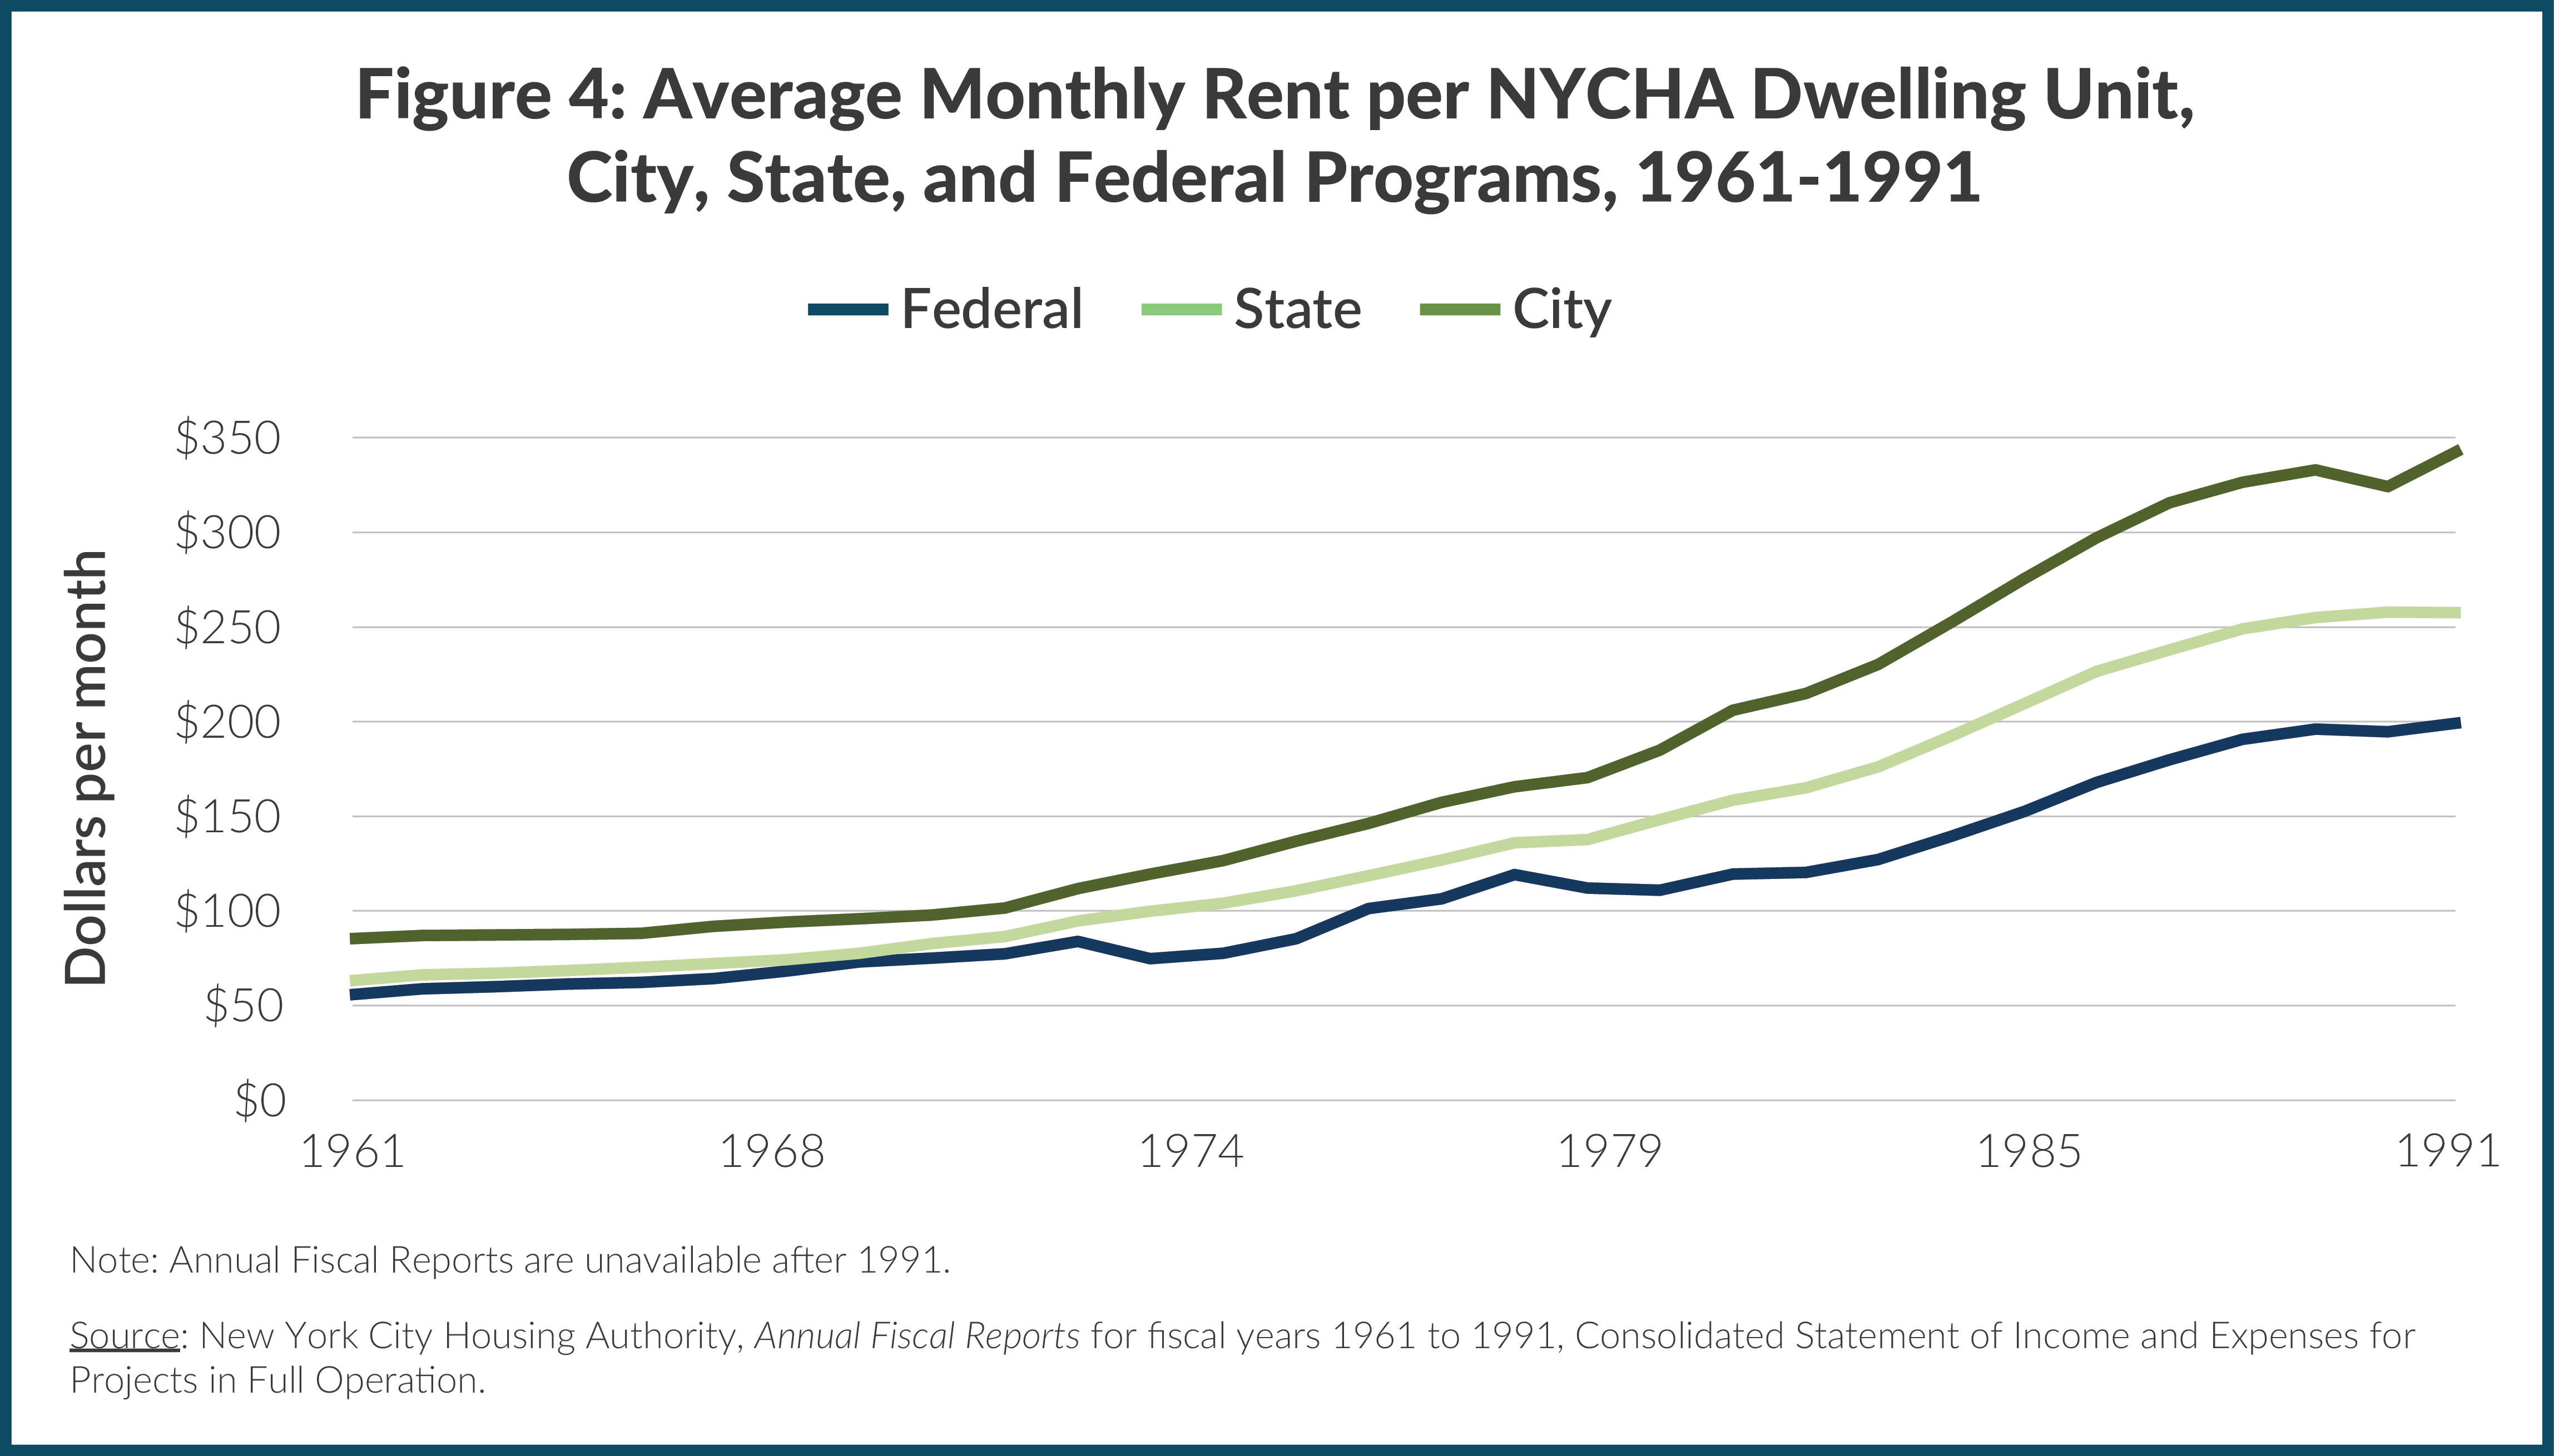
Average rents in State and City units were lower than on the private market, but consistently higher than those in the federal program. For example, in 1961 average monthly rents per unit were $56, $63, and $85 in federal-, state-, and city-sponsored units, respectively. In 2014 dollars, this would be $443, $499, and $673, respectively.13 As Figure 4 shows, the difference in rents among the three programs widened over time.
How the Federal Model Became Dominant
NYCHA began to experience regular operating deficits by the late 1960s, as operating expenses began to rapidly outpace rental income; however, the federal, State and City programs fared differently. Higher rents in City-sponsored units meant that the City program did not experience regular operating deficits until 1982, although the City began providing a debt service subsidy in 1969. In contrast, deficits began in 1967 for the State and federal programs. Rents at these developments were insufficient to cover growing expenses, and limited operating subsidies began for the State program in 1969 and for the federal program in 1971.
Federal subsidies were authorized to compensate housing authorities for depressed rental income resulting from the 1971 Brooke Amendment, which capped rent at 25 percent of income (increased to 30 percent in 1981) for tenants in all federal developments.14 Subsequently HUD established the Performance Funding System, which set a base subsidy for each authority’s operating costs, to be inflated annually.15
The availability of regular, predictable federal operating subsidies had important financial and social consequences. First, the per-unit subsidy was typically greater than what was provided by the State and City. This made it made it attractive for NYCHA to convert State- and City-sponsored developments to federal sponsorship. By 1981, 59 of the 85 City and State developments had been transferred. In 1995 NYCHA transferred 5 more, leaving 21 State- and City- funded developments.
Second, federal subsidies required NYCHA to abide by strict federal guidelines for tenant admission. Starting in 1981 these guidelines limited at least 90 percent of admissions to extremely low-income families (below 50 percent of the area median income, which was approximately $13,000, or $38,000 in today’s dollars) and introduced additional preferences for families that were homeless, severely cost burdened, or living in substandard housing.16 Over time admission requirements across all developments conformed to federal guidelines. Consequently, the share of working families declined from 48 percent in 1985 to 30 percent in 1995. Tenant revenue stagnated, increasing at an average annual rate of just 1 percent in the 1990s. In 1998 federal rules on admissions were relaxed to allow for greater rates of admission to working families and to eliminate preferences.17
As a result of these changes, NYCHA serves predominantly low-income households and is highly reliant on large federal operating subsidies to subsidize their rent. Despite strong early involvement by the State and City, they ceased providing annual operating subsidies in 1998 and 2003, respectively. NYCHA successfully gained federal support for 15,100 of the 20,000 former State and City units by 2010, with the remainder expected to receive federal support over time. As a result, federal support is a critical source of revenue to NYCHA. As the following section will show, this support has faltered in the last decade, and NYCHA can take action to address the resulting deficits.
Sources of Operating Stress
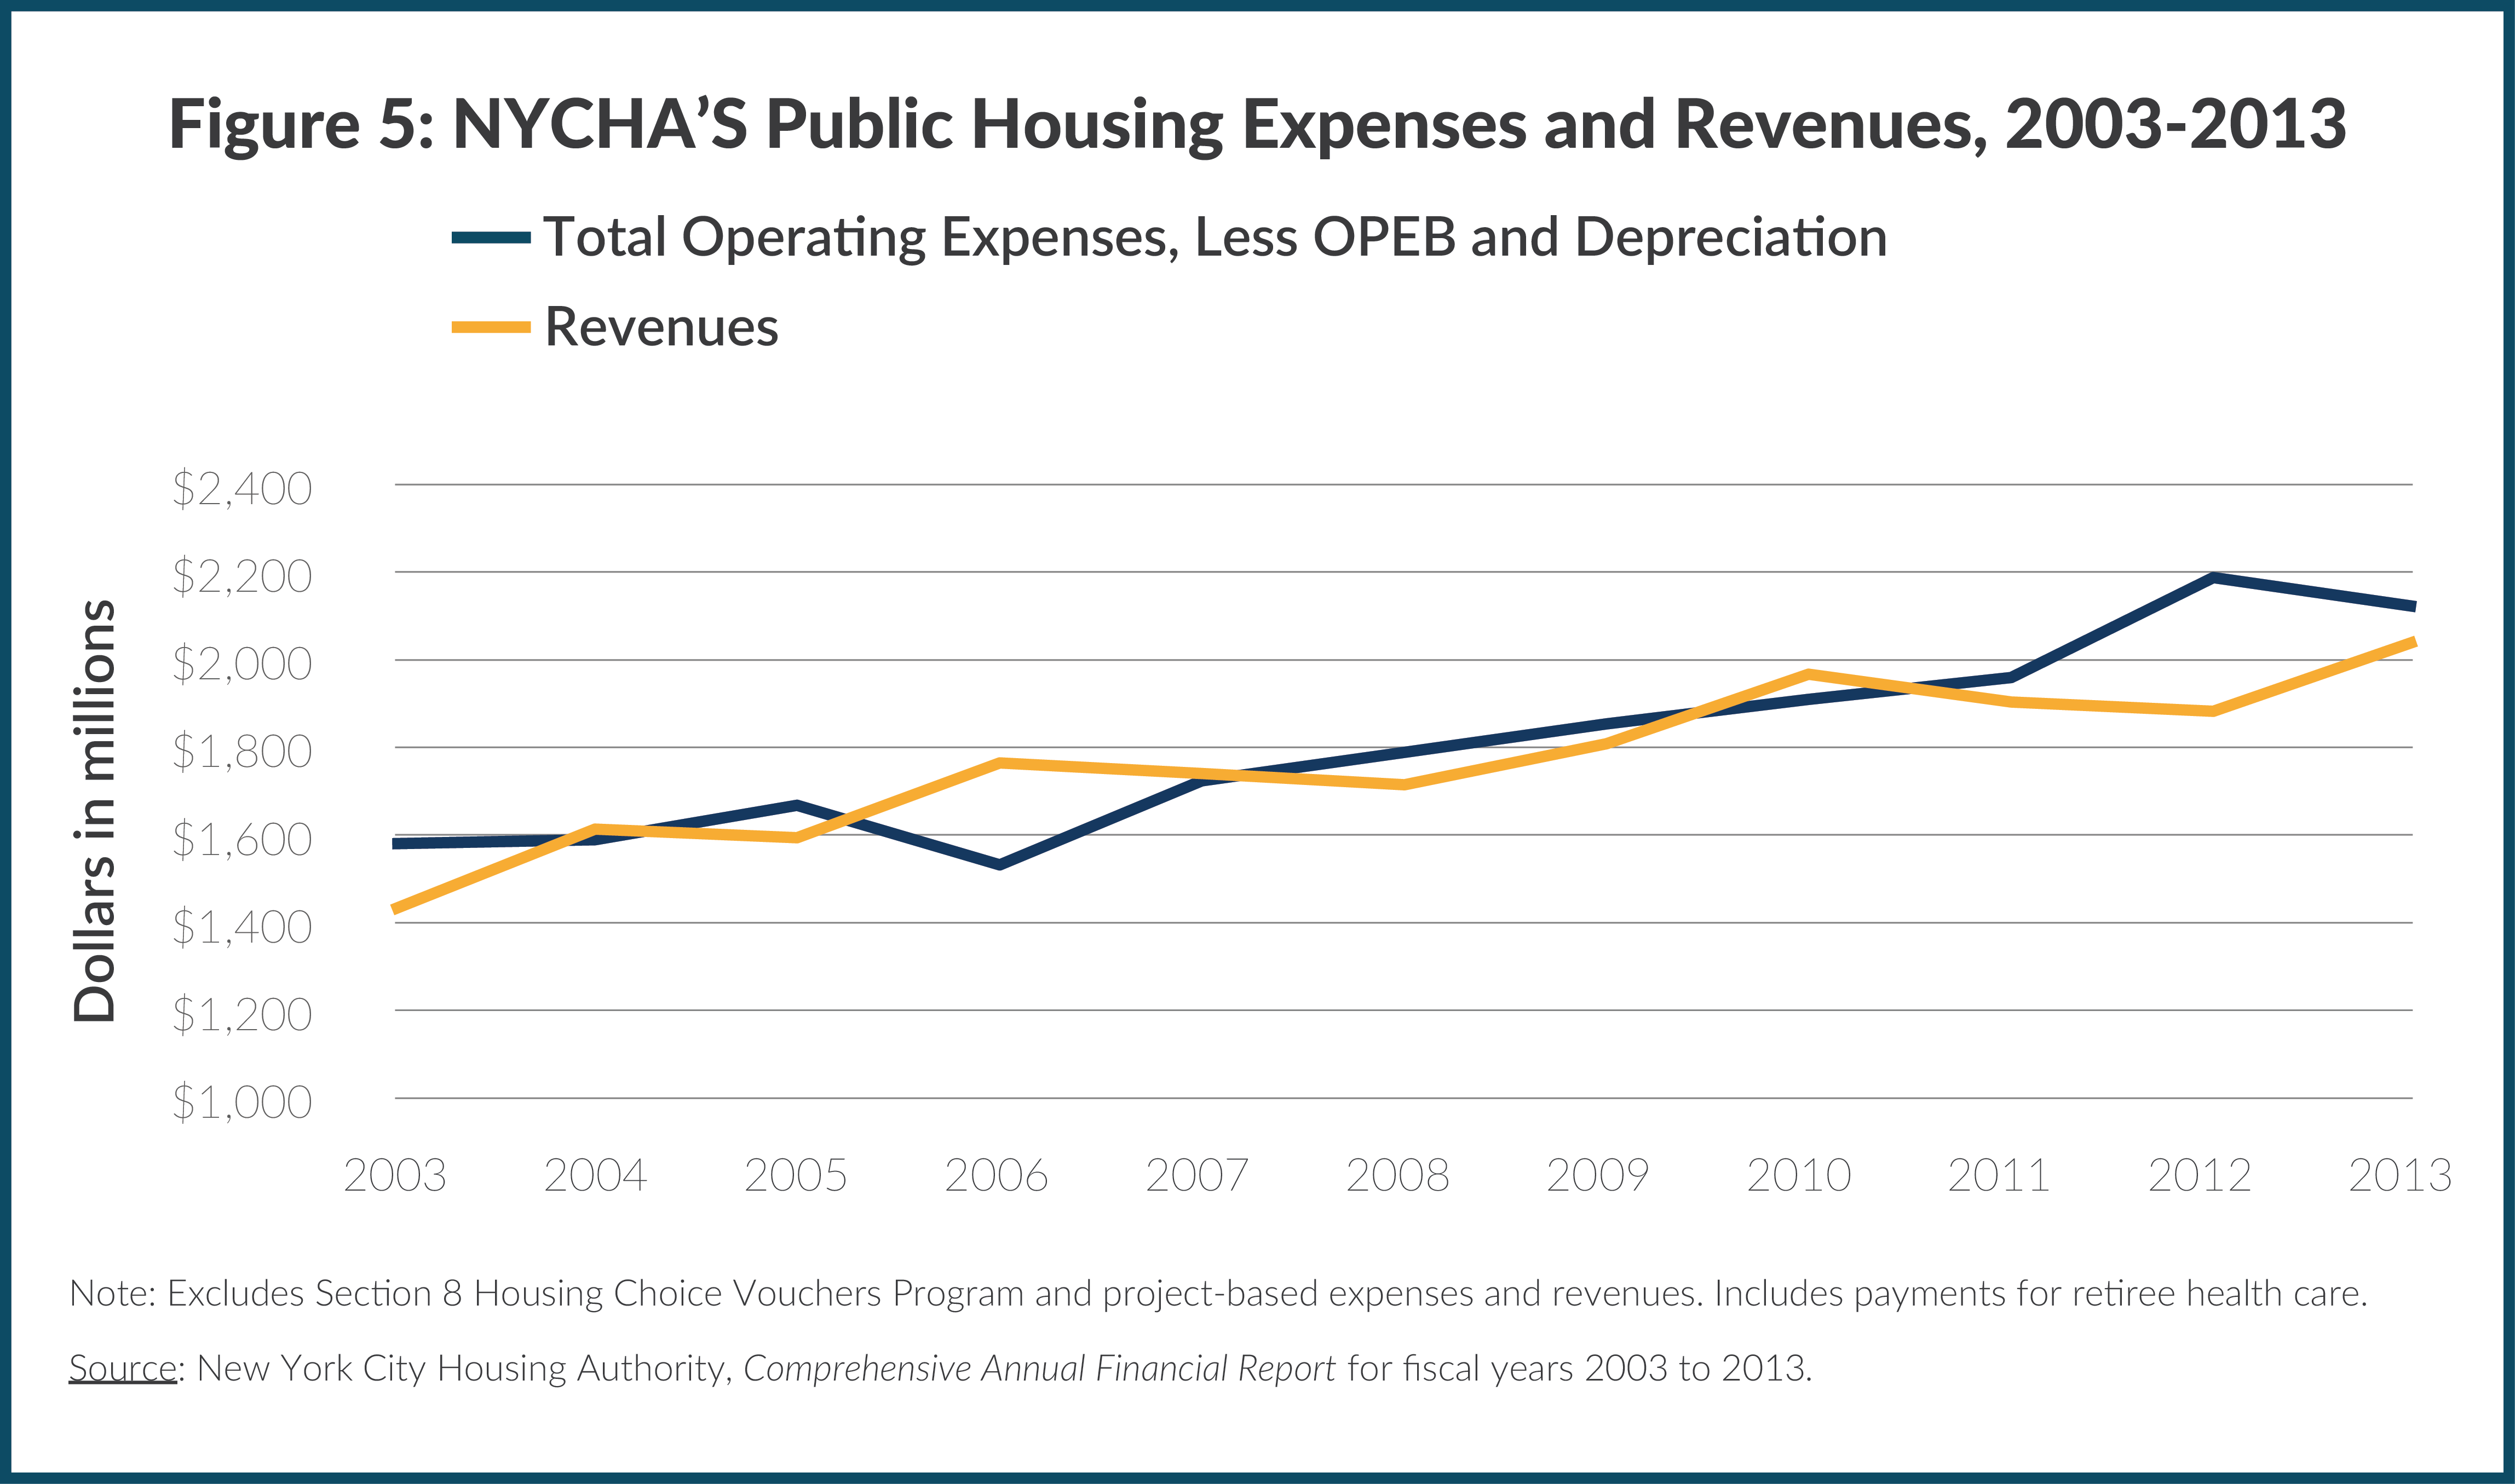
This section analyzes the financial condition of NYCHA’s public housing program from 2003 to 2013, the last year for which there are audited financial statements. As exhibited in Figure 5, NYCHA experienced deficits in seven of these years. The deficits averaged approximately $40 million annually and totaled $450 million over the period. The most recent deficits stemmed from a HUD initiative to take “excess” reserves from public housing authorities in 2012 and from federal sequestration in 2013. Note these estimates exclude the two large noncash expenses for depreciation and other postemployment benefits (OPEB); if these costs are included deficits averaged more than$600 million annually. NYCHA recognizes these expenses for accounting purposes in its annual reports, but it is not required to make any cash outlays to fund these expenses and does not include them in its financial plan.
The most important sources of fiscal stress are:
- Operating subsidies have been restricted. For several decades federal subsidies provided regular, relatively generous funding support, but the reliance on this source became problematic as federal support declined. When Congressional appropriations fell short of the full amounts due under the federal operating subsidy formula, HUD prorated subsidies to public housing authorities throughout the country, including NYCHA. In addition, obtaining federal support for units built by the City and State has proceeded more slowly than originally planned.
- Operating income has not been maximized. NYCHA has not vigorously pursued opportunities to increase non-rental income, such as parking and utility fees and commercial and nonprofit rent. Commercial activity generates less than one-half of one percent of the public housing budget.
- Operating costs are high. NYCHA’s monthly per-unit operating costs are $936, $320 greater than those of the average rent-stabilized apartment (excluding property taxes paid by private units). Factors contributing to this disparity include:High personnel costs due to high fringe benefit costs and inefficient work rules that result in maintenance requests being addressed on overtime;
- High utility costs, likely due to excessive energy use and a limited energy conservation program;
- Inefficient use of outside maintenance contracts;
- A multilayered management structure with redundant functions at the central, borough, and property levels; and,
- Continued operation of community and senior centers that are outside its mission.
- Gap-closing plans have not been implemented. Though NYCHA proposed a series of initiatives to close recurring gaps in 2006 and in 2011, it failed to implement them fully or in a timely manner.
Revenues
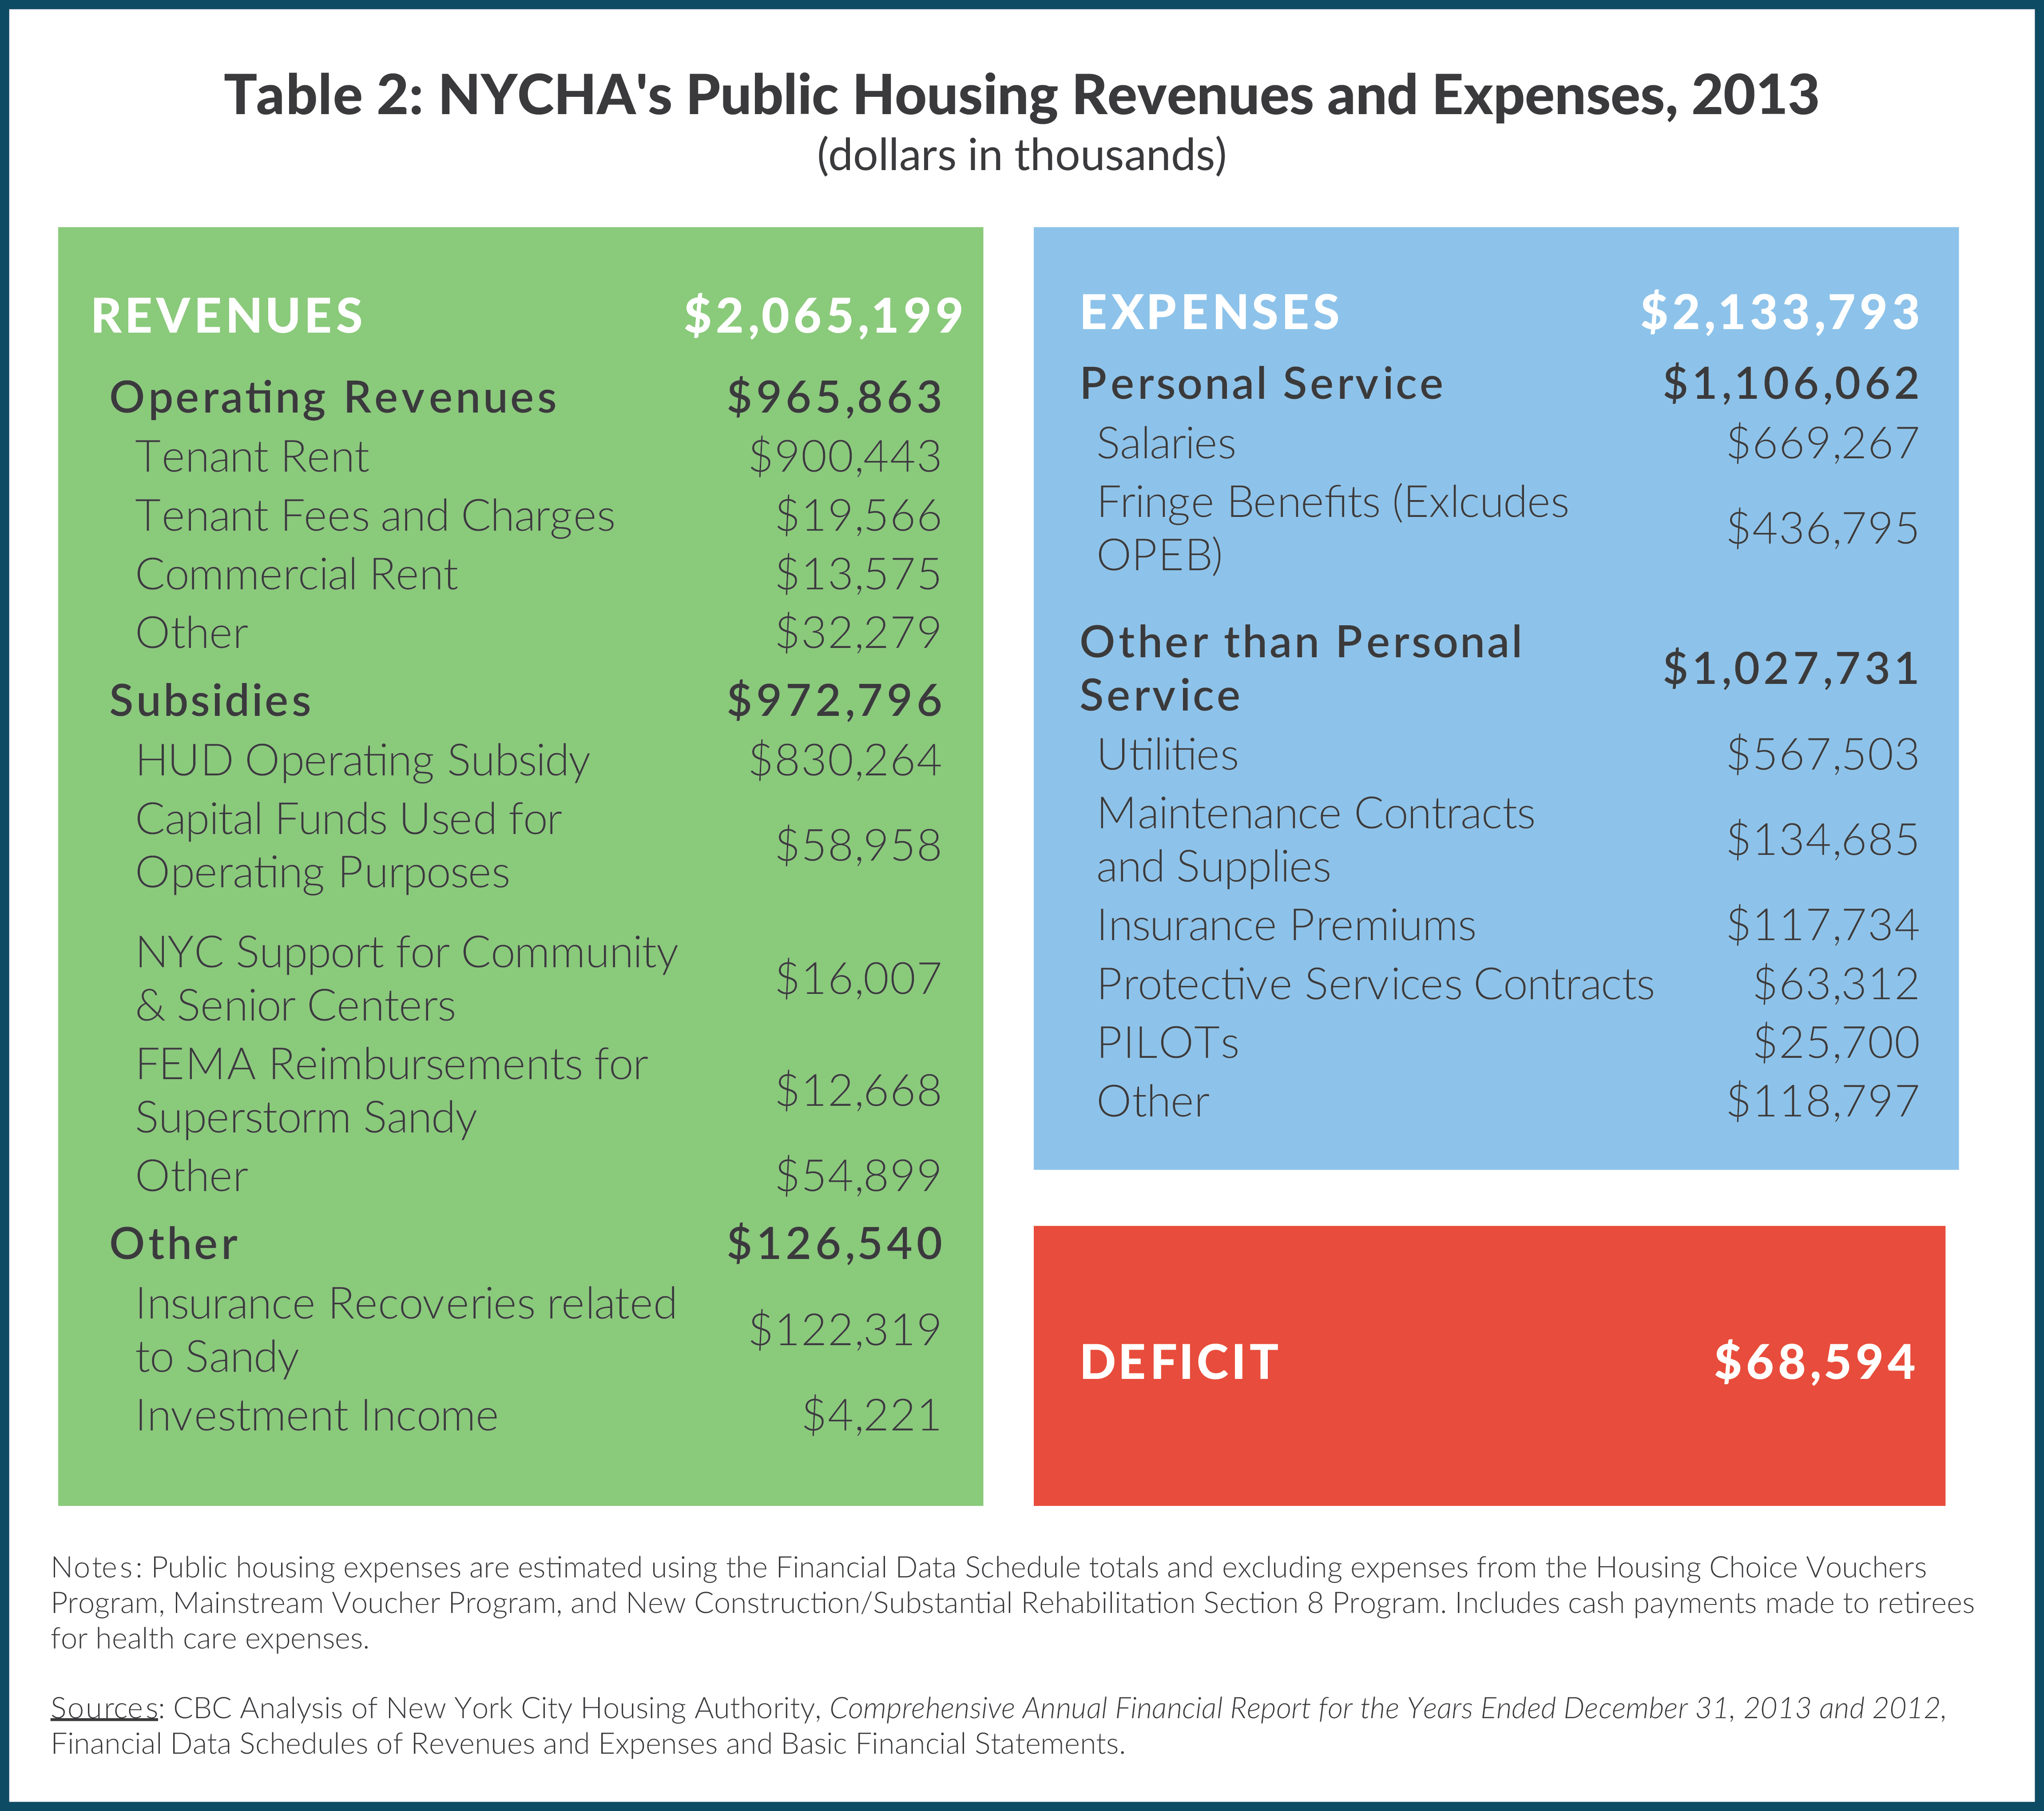
Subsidies and tenant revenues totaled $2.1 billion in 2013. The largest revenue source was tenant revenue at $920 million, comprising 45 percent of the total. Federal operating subsidies of $830 million were 40.6 percent and other subsidies, including one-time grants and capital funds used for operating purposes, were about $140 million, or 7 percent. Revenues from commercial activity and nonprofits totaled $14 million. All other revenues include investment income and capital asset sales and are typically minor, but in 2013 include $122 million in insurance recoveries related to damage suffered during Superstorm Sandy.
Federal Operating Subsidy
Since 1971 NYCHA has relied upon the federal operating subsidy to compensate for mandated low rents. To receive this subsidy, NYCHA must detail its compliance with HUD requirements in its annual plan. If HUD approves the plan it enters into an Annual Contributions Contract (ACC) to provide funding under a formula known as the Operating Fund Rule, the funding formula which succeeded the Performance Funding System. The subsidy is calculated as the difference between expenses and rental income, so increases in rental income generally decrease the subsidy, all else being equal. (See Appendix A for an explanation of the Operating Fund Rule.)
Download Appendix A
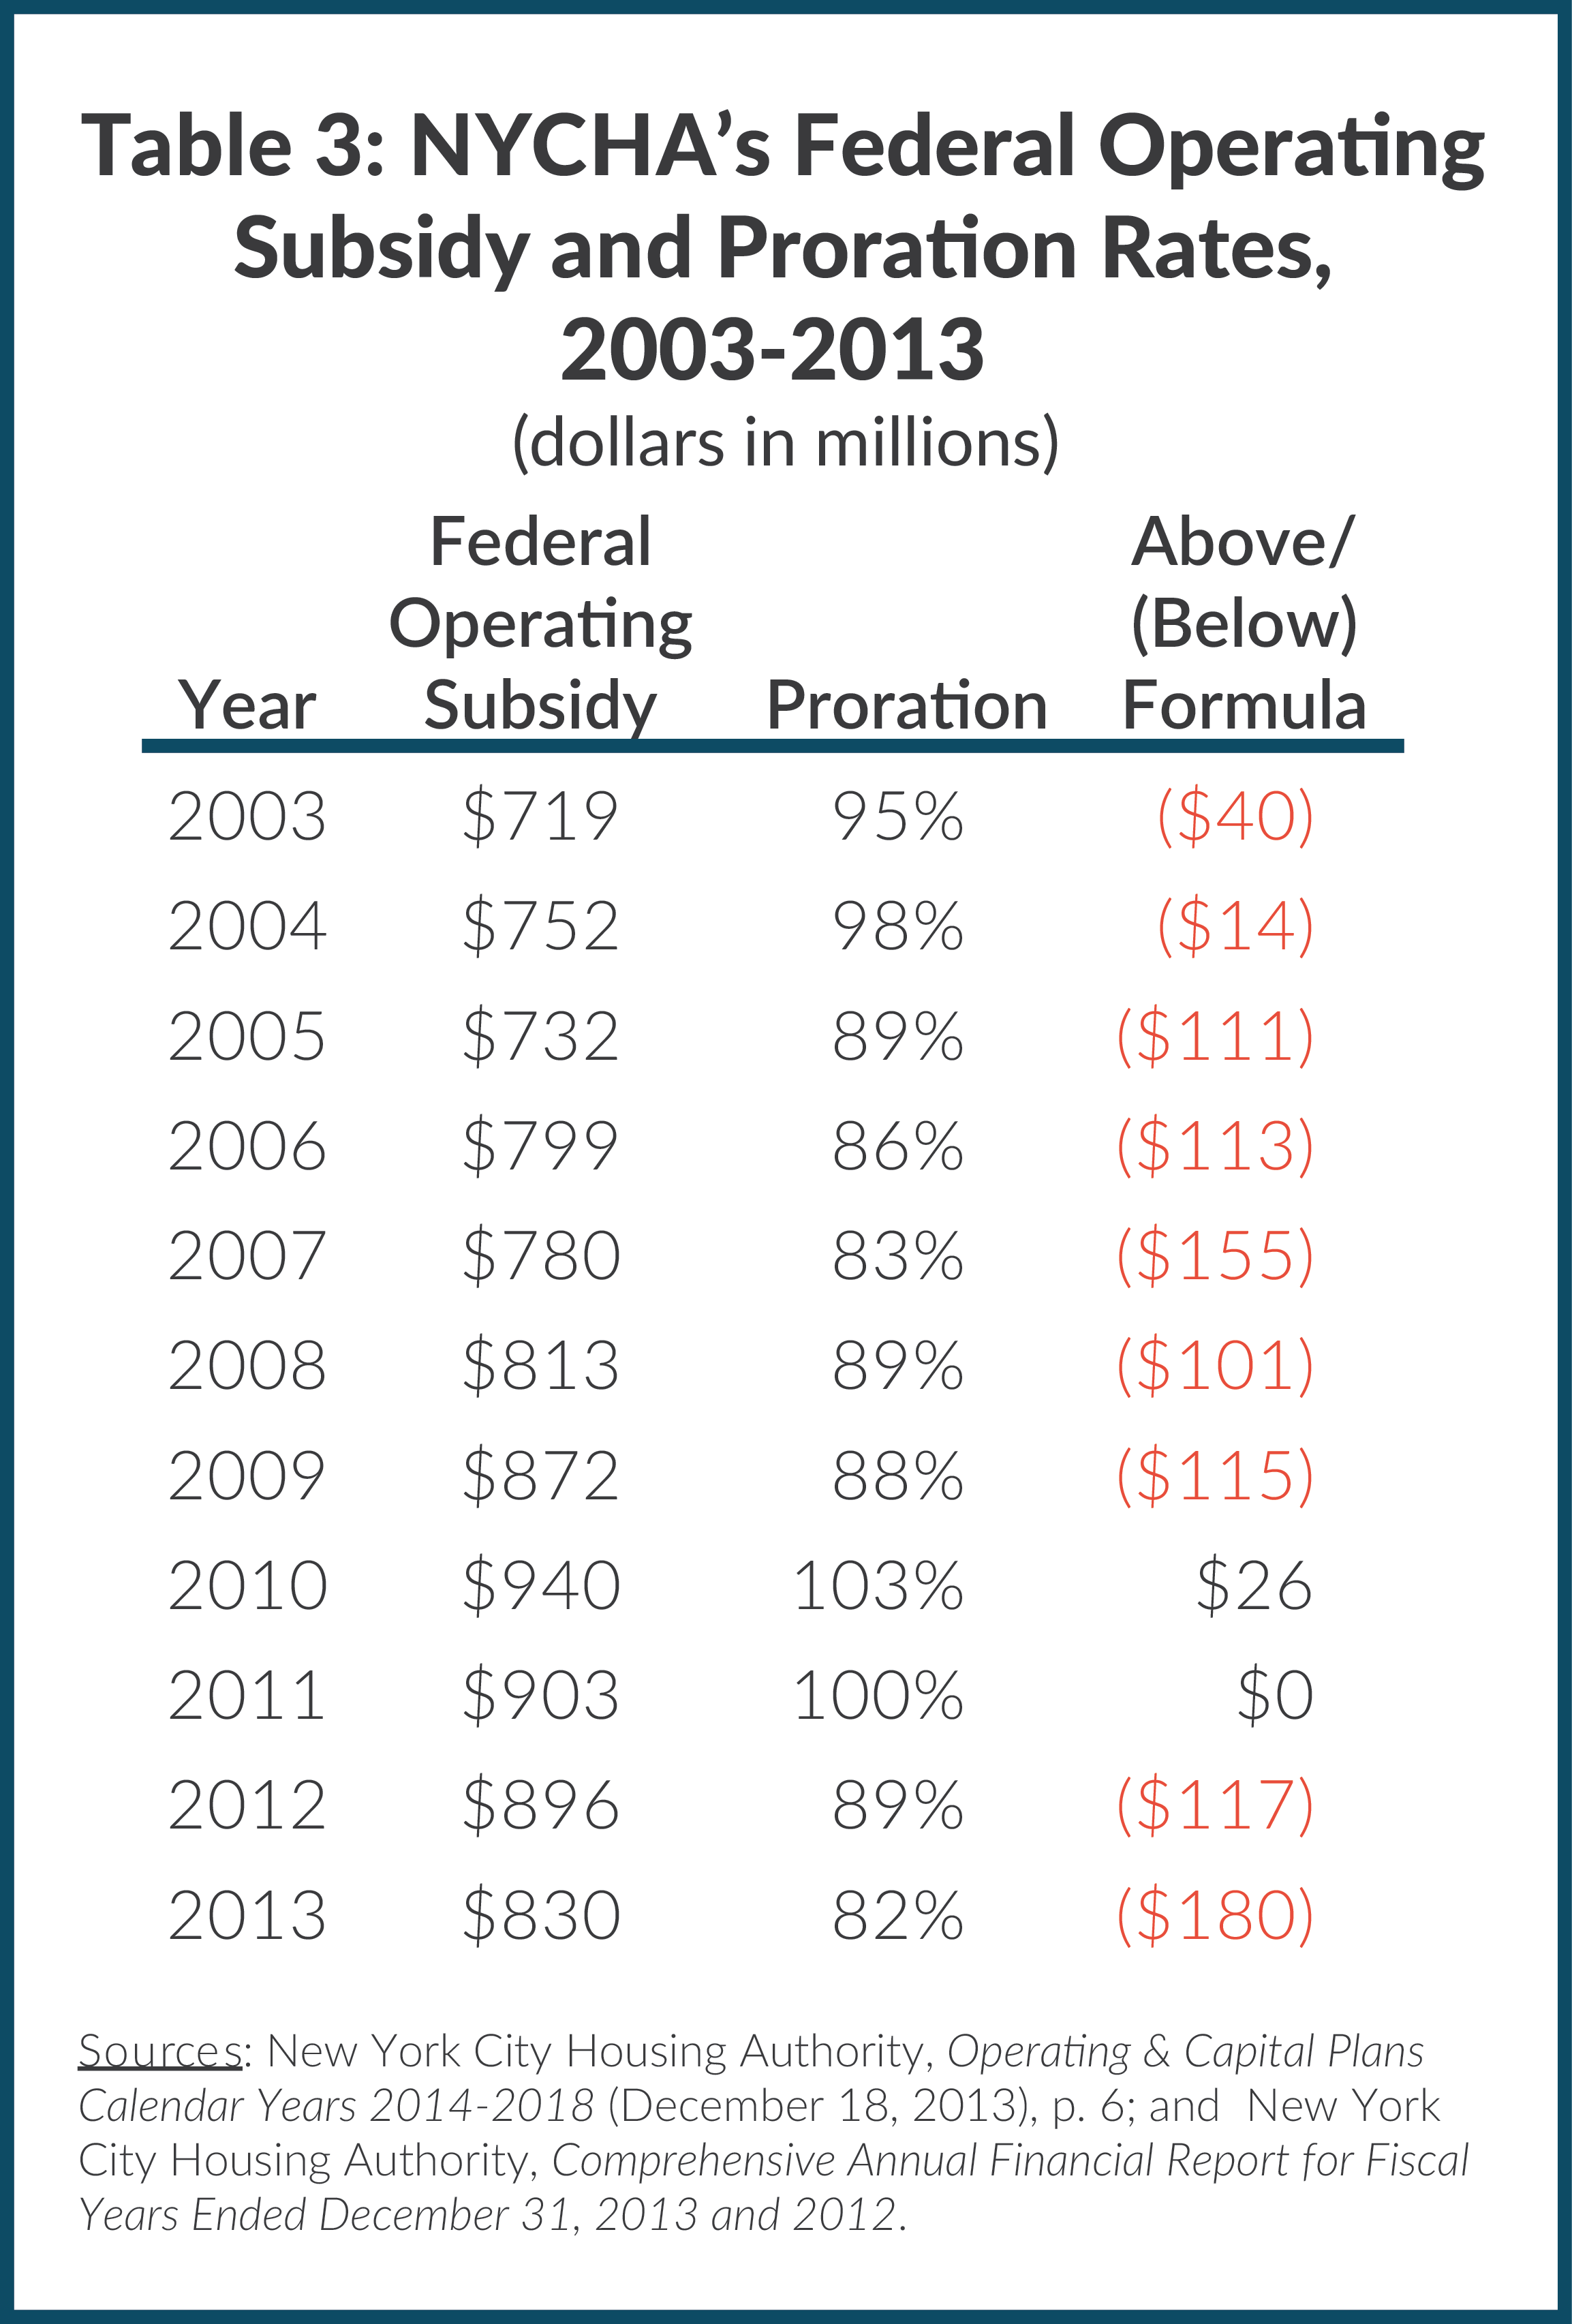
Appendix A: Operating Fund RuleIn recent years, the federal operating subsidy has been not been sufficient to fund NYCHA’s public housing operations for two reasons. First, since 2003 Congressional appropriations have fallen short of what the Operating Fund Rule calculates is necessary for all public housing authorities. When this occurs, HUD prorates the amount provided to each authority. NYCHA is the nation’s largest public housing authority, and its subsidies are typically prorated at the same rate as those of other housing authorities.18 Table 3 shows NYCHA’s federal operating subsidies from 2003 to 2013, the proration rate, and the shortfall from formula-determined eligibility. In 2013 NYCHA received $180 million less than the formula amount, which translates to about $84 per unit lost per month, due to the proration as well as a HUD recapture of “excess reserves” held by NYCHA.
Second, the subsidy only supports occupied public housing units listed in the ACC.19 NYCHA continued to operate 20,170 units built by the City and State (after the City and State eliminated their annual operating support for these units in 1998 and 2003, respectively) without any additional federal support.
Two plans have been approved to provide federal operating subsidies for these units. HUD approved the first plan in 2008, authorizing NYCHA to convert 8,400 of the 20,170 unsubsidized units to the Section 8 program over three years. This enabled NYCHA to receive annual funds for these units under its Section 8 contract with HUD, as opposed to the public housing ACC; however, the plan was conditional on tenants voluntarily agreeing to switch to Section 8 support. As of October 31, 2014, NYCHA converted approximately 3,350 units, leaving more than 5,000 of the 8,400 units still unsubsidized due to lack of tenant agreement.
The second plan secured public housing operating subsidies for the remaining 11,700 units through the American Recovery and Reinvestment Act of 2009.20 The law enabled NYCHA to receive more than $400 million of public funds and private loans to rehabilitate these developments. NYCHA began receiving regular annual operating subsidies starting in 2010 ($15 million in 2010, $62 million in 2011, $60 million in 2012, and $54 million in 2013).21
Because the first plan resulted in fewer voluntary conversions to Section 8 than expected, 5,000 units remain with no dedicated federal operating support. A December 2014 audit by the City Comptroller estimated foregone Section 8 revenue totaled $263 million from June 2011 through October 2014.22
Other Subsidies
Other subsidies vary annually; between 2003 and 2013 they averaged $115 million. These subsidies can be broadly categorized as additional federal reimbursements for exceptional circumstances such as Superstorm Sandy; targeted City support in response to NYCHA’s appeals; and federal capital funds diverted for operating purposes. The City also provides a property tax exemption that averaged $380 million annually over the same period.In City fiscal year 2006, the City provided approximately $100 million in “transitional” operating support, intended to provide a financial backstop for NYCHA as it increased rents, implemented an efficiency program, and applied for greater federal aid.23 In the past few years, the City has taken over the operations of the bulk of NYCHA’s community and senior centers in a program meant to provide sufficient services for all NYCHA residents and to free up NYCHA funds for housing purposes. This began with $18 million for senior centers in City fiscal year 2009 and was followed by $58 million for both senior and community centers in fiscal years 2013 and 2014. The City provided an additional $17 million to delay the closure of remaining centers in City fiscal year 2015.24

In City fiscal year 2013, the City provided $10 million to train residents to provide repair work and reauthorized this funding in 2014.25 Mayor de Blasio and the City Council further increased operating support, relieving NYCHA from payment for police services (required since the Housing Police merged into the NYPD in 1994) for part of fiscal year 2014 and all of fiscal year 2015— a total of $120 million.26 The City’s Preliminary Budget for Fiscal Year 2016 proposes eliminating the police payment permanently.
NYCHA also relies upon flexibility in the rules for federal capital aid to support its operations. HUD allows public housing authorities to use up to 20 percent of federal aid provided for capital purposes for operations. Between 2003 and 2012, NYCHA used $338 million in capital grants to underwrite its operations, contributing to the deterioration of its building stock.27 NYCHA relied extensively on these grants to balance its books between 2004 and 2006, when it diverted 20 percent of its annual capital grant, about $70 million a year. In 2007 it transferred 13 percent of the grant, and in subsequent years less than 10 percent. Capital grants awarded in 2012 and 2013 were not diverted; however, NYCHA used capital funds diverted from prior year grants, totaling $21 million in 2012 and $59 million in 2013.
Tenant Revenues
NYCHA is limited in its ability to raise revenues through rent increases. (For a detailed discussion of how NYCHA rents are set, see Appendix B.) Rents cannot exceed 30 percent of tenant income, and NYCHA’s tenants are, on average, poorer, underemployed and older than other New Yorkers. Annual household income was $23,150 for NYCHA households in 2013, compared to $63,608 for rental households in New York City. As shown in Table 4, less than half of NYCHA’s households have at least one employed person and well over a third of households are headed by seniors, who tend to have low, fixed incomes.
Download Appendix B
Appendix B: Tenant Revenues
Many NYCHA tenants do not move out of their apartments and essentially age in place, a phenomenon that has increased in the past 30 years. In 1985 the average number of years that a family lived in a NYCHA apartment was 13.2; by 2003, this had increased to 18.0 years, and most recently in 2013, the average stay was 21.3 years.28 Long tenures result in poor utilization of apartments as family composition changes over time and also prevent more than 247,000 wait-listed families from moving in.29
NYCHA’s tenant revenues also suffer because NYCHA’s rent collection rate is poor. In December 2013 NYCHA’s monthly collection rate was 77 percent, significantly below its target rate of 95 percent.30 Uncollected rent totaled $46.8 million in 2013.31 If NYCHA met its 95 percent target rate in collections, it would have collected $36.6 million more in rent.
NYCHA generates additional revenue from parking fees. It has 599 parking lots with 19,300 spaces that serve tenants and nonresidents.32 Parking fees were increased in 2006 to $75 per year for most residents and $60 for seniors and tenants with disabilities— just $6.25 and $5 per month, respectively. NYCHA did not increase parking fees again until May 2013 as it began to implement a Reserved Parking Program in 43 developments (9,000 parking spaces) to eliminate the less expensive non-reserved parking spot option.33 Fees increased to $340 per year for most residents and $272 per year for senior and disabled residents.
HUD subsidizes utilities through the operating formula, but NYCHA can charge for excessive utility use and retain this revenue, which it currently does by charging for additional appliances. In the past 11 years, NYCHA increased utility charges just once. In 2006 monthly appliance fees increased from $7 to $10 for air conditioners, from $8 to $10 for freezers, and from $3 to $5 for dishwashers; monthly fees of $5.75 for washing machines were initiated that year as well. Since 2003 revenue from these tenant fees and charges grew threefold from $6.1 million to $19.6 million.
All Other Revenues
Commercial and nonprofit tenants generate minimal income: $13.6 million in 2013, up from $11.3 million in 2010, the first year NYCHA isolated this revenue stream in its annual report.
NYCHA has made a concerted effort to increase commercial revenues, increasing occupancy rates at its 159 commercial spaces from 60 percent to 91 percent over the past decade. Some commercial spaces remain vacant because they require significant capital improvements. NYCHA charges market rate rents for commercial renters, but not necessarily for nonprofit groups. Though the activities of many nonprofits are subsidized by city contracts and often include specific funding for rent, many nonprofit groups pay low or no rent for use of NYCHA facilities.
Expenses
NYCHA has high operating costs that contribute substantially to its deficits. On a per-unit basis, NYCHA’s monthly costs are significantly higher than those of an average rent-stabilized apartment in New York City. In 2012, the most recent year with comparable data, NYCHA’s monthly per-unit costs were $949 compared to $841 for a rent-stabilized unit. When taxes are excluded, these per-unit costs were $936 and $616, respectively. In other words, NYCHA spent $320 more per unit than landlords spent to operate an average rent-stabilized apartment.34
Personnel Costs
High operating costs are explained largely by NYCHA’s high personnel costs, including salaries and wages, health care, pensions, and other benefits. NYCHA employs more than 11,000 people and provides retirement benefits to 8,500 retirees. Employee compensation policies are established by the City of New York: NYCHA’s employees are represented by the same unions as City employees and, for the most part, receive the same compensation, although NYCHA determines its own staffing levels.
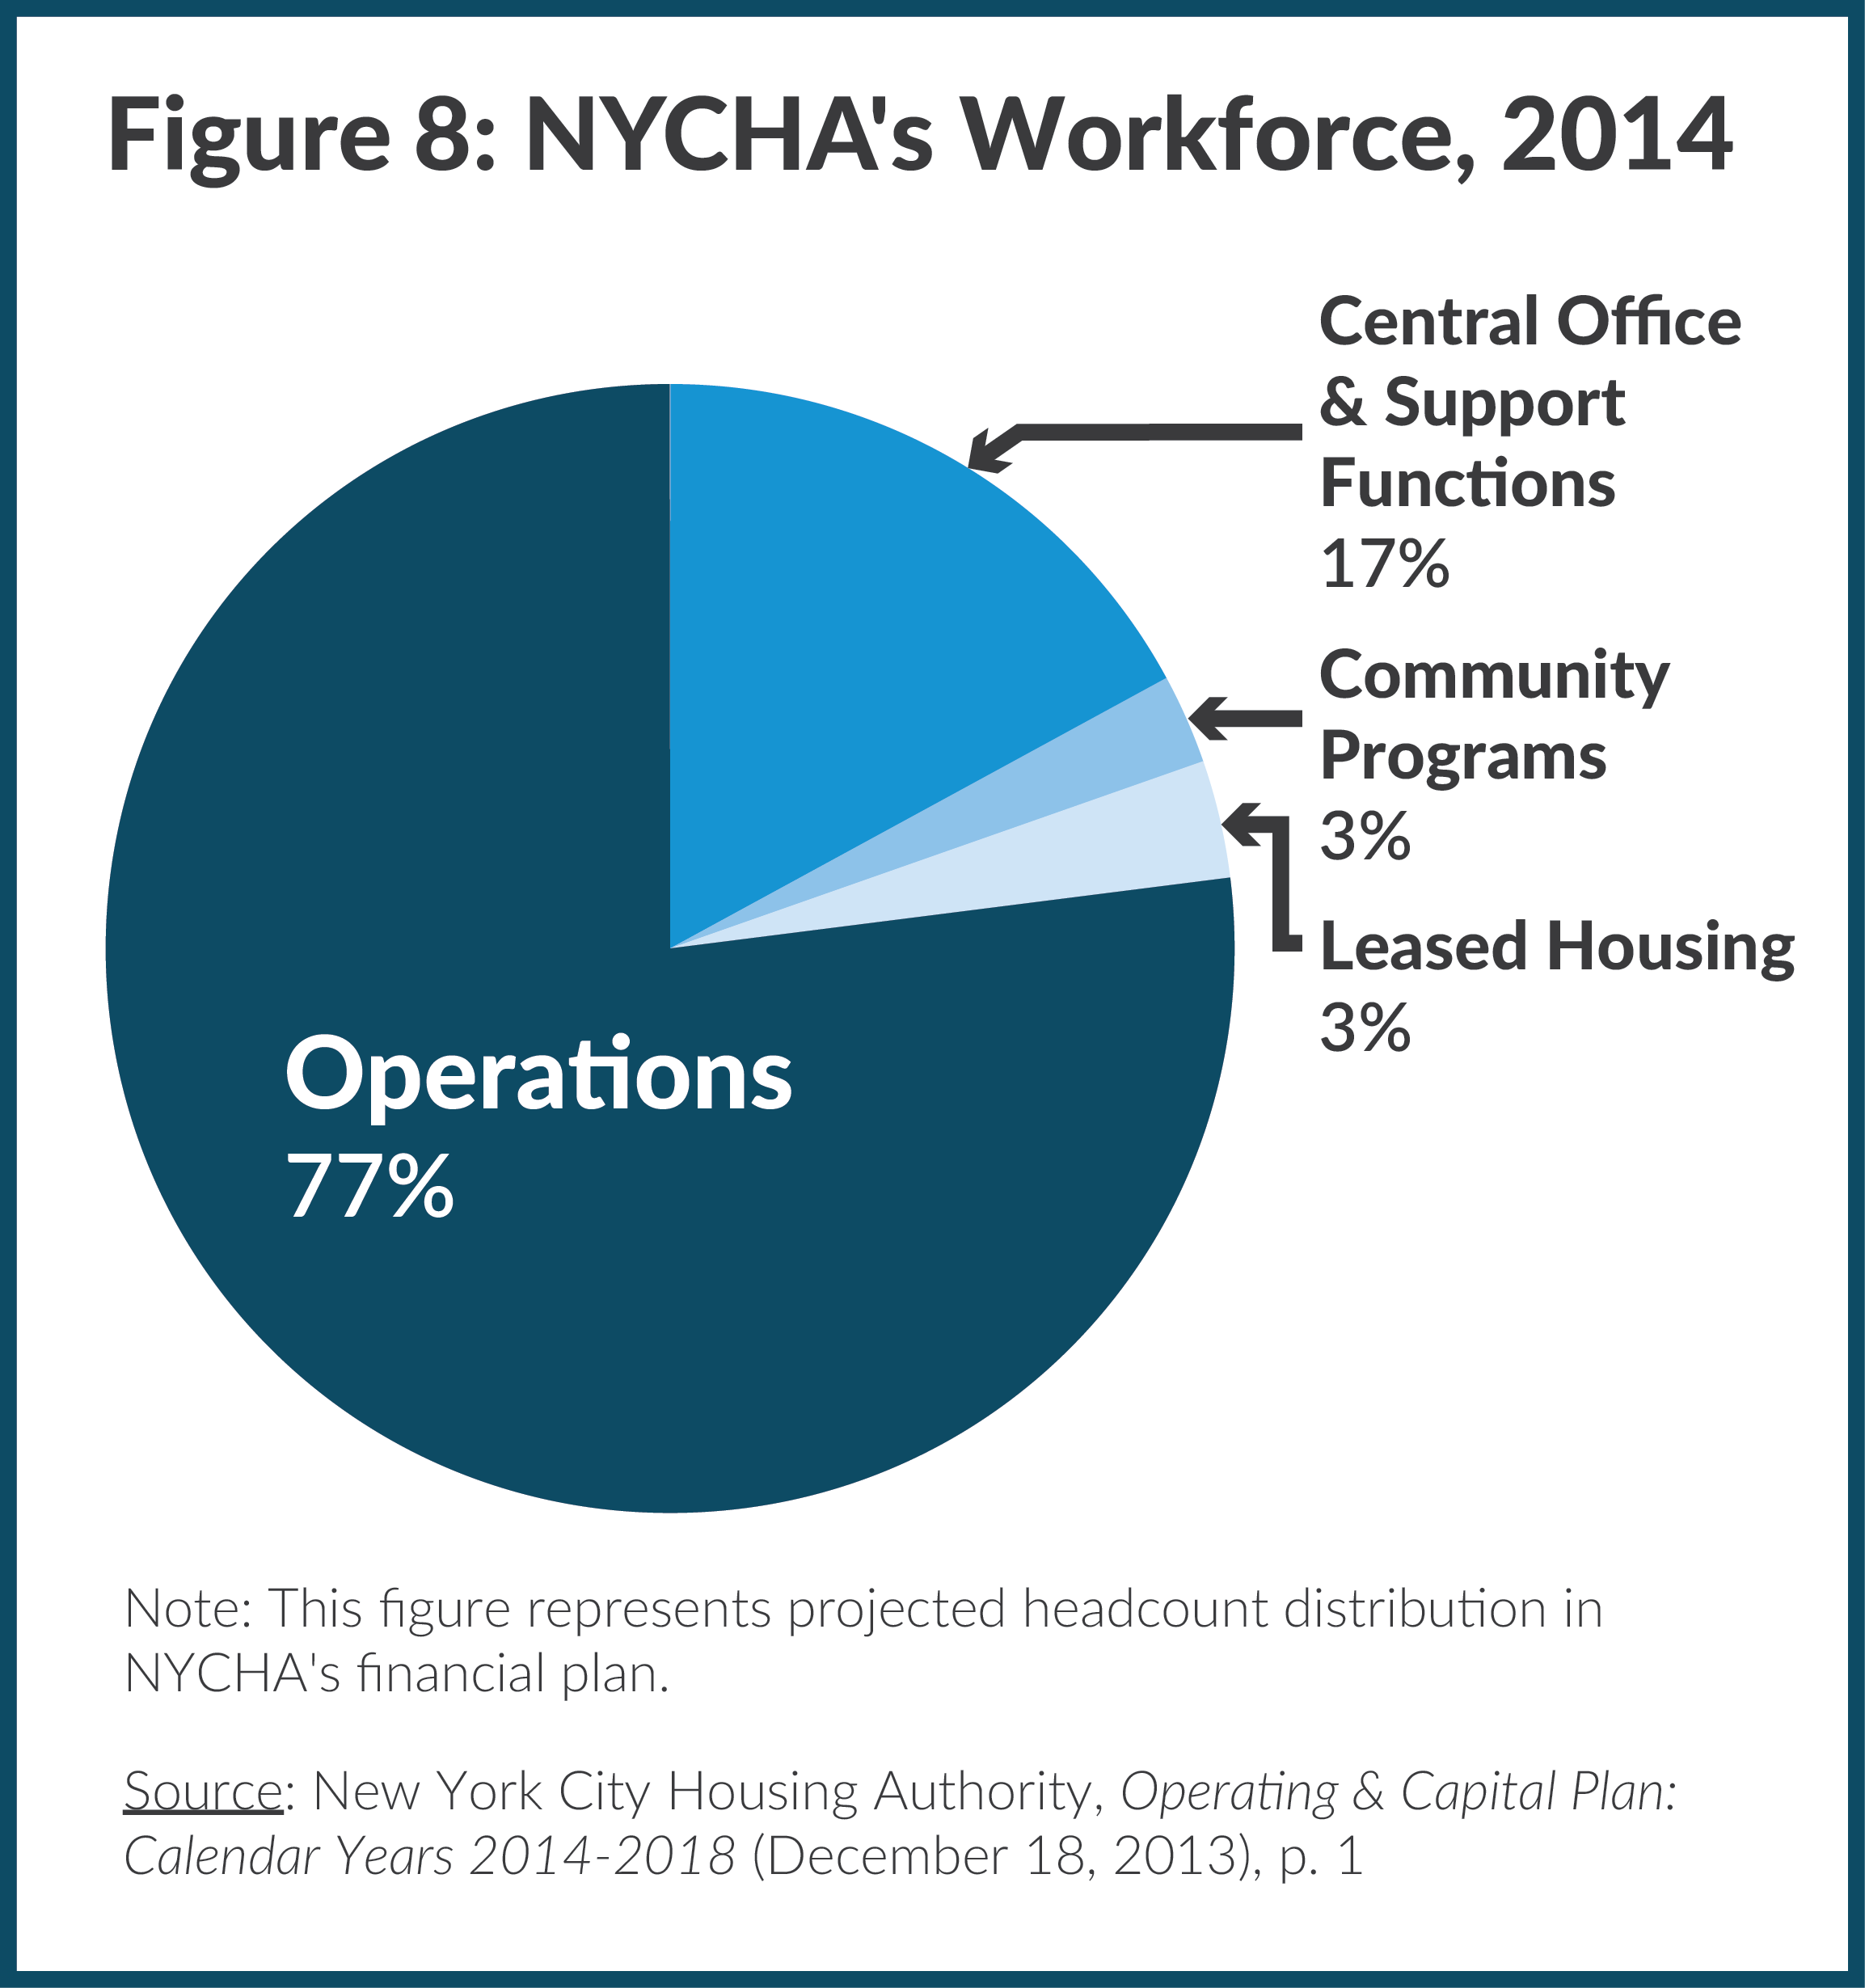
More than three-quarters of NYCHA’s employees operate and maintain housing developments.35 The International Brotherhood of Teamsters Union Local 237 represents approximately 8,000 NYCHA employees involved with frontline operations, including housing managers, housing assistants, caretakers, groundskeepers, maintenance workers, elevator mechanics, carpenters, plasterers, housing guards, and heating plant technicians.36
These employees have rigid work rules that can be costly. The Teamsters contract with NYCHA stipulates workers must be paid overtime if they work on weekends or outside of the hours of 8:30 a.m. and 4:30 p.m. on weekdays, which is an uncommon limitation, even for other public sector workers. NYCHA spent $84 million in overtime in 2014, and made attempts to curtail overtime by eliminating nonemergency, unscheduled overtime; however, that resulted in increased response time for work order requests.37 NYCHA and the City are in the midst of contract negotiations for these employees and have expressed an interest in negotiating more flexible work schedules.
NYCHA also provides fringe benefits on par with those provided by the City. New York City’s health and pension policies are generous relative to other large private and public employers: employees can vest in a defined benefit pension and retiree health benefits after 10 years of employment; employees make modest contributions toward their pensions; most employees and retirees do not contribute toward the cost of their health insurance premiums; and retirees over age 65 and their spouses are reimbursed for the full cost of Medicare Part B premiums, a rare practice even among public employers.38
Moreover, many NYCHA employees are in titles designated “physically taxing,” which entitles them to retire at age 50 after 25 years of service instead of at age 62 as required for most civilian city employees.39 In 2012, 29 percent of NYCHA’s employees were eligible to retire compared to just 19 percent across other City agencies.40
Fringe benefits increased 35 percent since 2003. Total salaries and wages grew just 1.0 percent annually, or 10.8 percent, between 2003 and 2013 compared to pension costs that increased 1,045 percent from $13.5 million to $156 million in the same period. Health care and other benefits are also costly, accounting for $236 million in 2013.Because NYCHA itself cannot change benefits, it has attempted to control rising labor costs through workforce reductions. Nonetheless, though total headcount declined by 24 percent from 14,857 in 2003 to 11,269 in 2013, costs per employee grew 78 percent from $54,361 to $96,990.

Reductions and frequent turnover in maintenance personnel left NYCHA ill-equipped to keep up with maintenance requirements: in 2012 open work orders peaked at 423,000 after Superstorm Sandy.41 They decreased to 77,600 in May 2014 but have since increased to 112,560 as of January 2015, likely due to stresses on properties and equipment caused by exceptionally brutal winter weather. This brings repair needs to a level that once again exceeds NYCHA’s manageable workload of 90,000 open work orders.42
Significant progress has been made in addressing the maintenance backlog, but problems persist: it still takes 9.5 hours to resolve emergency service requests, more than two weeks to resolve non-emergency requests, and about a month to perform repairs.43 Poor response times result in apartments that stay vacant for lengthy periods of time: the average time to prepare a vacant apartment for occupancy is 36.1 days and the average time an apartment is vacant is 66.7 days– more than two months.44 A 2012 audit found 319 vacant units had been empty for more than seven years, resulting in lost rents of $1.4 million each year.45 Poor response times are also attributable to NYCHA’s multilayered management structure, including central offices, borough-wide management, and property-level staff.46 Property-level managers have less decision-making authority than their counterparts at other large property management companies and public housing authorities; instead there is shared accountability with borough-level management. This limits property managers’ abilities to address residents’ concerns and complete repairs.47
Utility Costs
In 2012 an average NYCHA unit incurred more than $250 in utility costs per month compared to $200 for an average rent-stabilized apartment.48 NYCHA’s tenants do not pay directly for any utilities and HUD subsidizes the costs through the operating formula, providing little incentive to control costs.49 These costs are relatively high even though NYCHA benefits from a reduced electricity and gas rates through the New York Power Authority.Since 2003 NYCHA’s total utility costs, excluding associated labor, have grown 75 percent from $326 million to $570 million in 2013. Water costs drove much of the increase, growing 9.2 percent annually, in step with New York City’s annual water rate increases, which averaged 8.9 percent. Electricity costs nearly doubled since 2003, but these costs have declined slightly in recent years, dropping about 3.6 percent from 2011 to 2013. In 2007 NYCHA started an energy conservation program that included installing compact fluorescent lamps and replacing aged domestic heaters with steam water heater devices.50
Though HUD includes utility costs in determining the operating subsidy, growth in utility bills can negatively affect the bottom line if not contained. In years when the federal operating subsidy is prorated, high utility expenses crowd out other spending. Additionally, the subsidy formula includes an incentive to reduce consumption relative to a rolling base consumption level; if current levels increase, NYCHA must absorb 75 percent of the increase through a reduced subsidy, but if consumption decreases, it can retain 75 percent of the decrease. HUD also provides an incentive for Energy Performance Contracts (EPCs) in which authorities retain savings generated by reduced consumption through physical improvements funded by a non-HUD source such as a bank, utility, or government entity, but under a HUD-approved plan.51
In 2012 NYCHA engaged in an EPC with HUD, but its scope and resulting impact were minimal. Bank of America Public Capital Corporation provided an $18 million loan to install new boilers, upgrade the computerized heating automated system, and replace domestic hot water tanks with instantaneous hot water heaters in 800 buildings.52 A 2014 audit by the New York City Comptroller’s Office found that the EPC was less ambitious than other plans approved by HUD for smaller authorities. While NYCHA’s plan would result in savings of $100 for each unit covered, the Chicago Housing Authority EPC plan would save $3,529 per unit. NYCHA had previously failed to earn HUD approval for a more comprehensive effort because of its failure to comply with HUD regulations.53 NYCHA did earn HUD approval of a $100 million EPC to replace boilers, heating systems and lighting in April 2015.54
Contracted Maintenance and Supplies
Spending on maintenance contracts and supplies declined 19 percent since 2003. In 2004 NYCHA reported increased expenses from pension costs, uncollectible accounts, and other expenses were offset by a 33 percent decline in funding for supplies and contracts.55 Between 2003 and 2013, the share of total public housing spending from maintenance and supplies declined from 11 percent to 6 percent.
NYCHA recently began exploring Job Order Contracting (JOC) for maintenance and capital work.56 JOCs streamline and shorten the procurement process by awarding one contract to fund a variety of small, noncomplex, repetitive jobs with minimal design requirements at a particular site. They can be more cost-effective because all jobs have fixed prices and the time it takes for the contractor to start work once a need is identified is greatly reduced.57 NYCHA entered into a handful of capital and maintenance JOC contracts between 2011 and 2013, but it did not award any such contracts in 2014.
NYCHA reported in 2014 that the JOC process reduced the total master contracts NYCHA was required to administer and offered NYCHA greater flexibility to better align job size with contractor abilities. A report by the Department of Investigation found the JOCs reduced the procurement cycle for the six contracts approved in 2013 from four months to one month.58
Spending on Non-Core Functions
In 2014 NYCHA spent $17 million to operate 24 community and 33 senior centers. These costs are worth highlighting because they relate to a distinct responsibility undertaken by NYCHA outside its core functions—one that is often identified by NYCHA officials as a target of potential expense reduction during times of fiscal stress.59 According to the Boston Consulting Group, 37 percent of the expense of running these programs is overhead—compared to 15 percent for best-in-class operations.60
In 2013 the City developed a plan to provide community and senior services to all of NYCHA’s population by assuming operations of 49 centers at a cost to the City of $26 million annually. NYCHA opted to retain operational responsibility for 57 smaller centers and costs for 165 employees and received City funds totaling $16 million in 2013 and $17 million in 2014 to avoid layoffs.
Gap-Closing Efforts
Since 2003 NYCHA crafted two detailed gap-closing plans, the first in 2006 and the second in 2011. The 2006 “Plan to Preserve Public Housing” included two key initiatives to raise recurring revenues: Section 8 conversions of all City and State housing units and “Targeted Rent Reform.” Both initiatives fell short of their goals. The Section 8 conversions were voluntary and required some tenants to pay more rent or move to smaller units; approximately 5,000 units remained unconverted as of October 2014 even though NYCHA had expected to complete the initiative by 2011. The Comptroller’s 2014 audit found NYCHA exercised insufficient outreach despite low conversion rates, and it did not adjust its financial plan accordingly.61
Through Targeted Rent Reform, NYCHA aimed to increase total revenue by raising rents. While rent increases typically reduce the operating subsidy, HUD granted an exception in 2005 to permit housing authorities to increase rents without reducing the subsidy.62 In 2006, 27 percent of households paid a “flat rent” less than 30 percent of income. (See discussion in Appendix B.) Though Targeted Rent Reform succeeded in raising revenues, yielding more than $200 million since 2007, it failed to substantially increase the share of tenants paying 30 percent of income. Today 35,000 households still pay flat rents less than 30 percent of their income.63 NYCHA can no longer benefit from Targeted Rent Reform because the exemption granted expired in federal fiscal year 2009. In fact, HUD is requiring all public housing authorities to phase in flat rent increases as a federal cost-saving measure to reduce operating subsidies. Targeted Rent Reform therefore represents a missed opportunity for NYCHA to retain additional revenue through rent increases.
NYCHA’s subsequent gap-closing plan in 2011, “Plan NYCHA: A Roadmap for Preservation,” included several unrealized initiatives, such as reducing central office and administrative costs and reinvesting savings in property-level management. A proposal for “infill” development, or leasing NYCHA land (for example, parking lots) for construction of mixed-income housing, stalled in the face of strong tenant opposition. NYCHA had projected infill development would generate $30 to $50 million per year in additional revenue.64
NYCHA also worked with consultants to assess its operations and capital planning process, but did not fully follow through on their recommendations. The Boston Consulting Group identified savings and new revenues that could have grown to $338 million by 2016. However, a 2014 Comptroller’s Office audit found NYCHA could not “assess the extent to which recommendations were implemented, anticipated cost savings and revenues were achieved, and funds were available to be redirected to the frontline.”65
The most recent financial plan update, presented in the New York City Council Report released in March 2015, continues to project deficits: $98.1 million in 2015 growing to $194.2 million by 2019. (See Table 5.) Public housing revenues are projected to grow 4.9 percent for the period, while expenses are projected to increase 9.1 percent. Rental income is expected to grow 4.9 percent as rent increases are phased in. Expenditure growth will continue to be driven by fringe benefits and utilities costs, which will grow 13.9 percent and 10.7 percent, respectively.
There are two adjustments to make to these projections. First, the plan does not account for the Mayor’s proposal to eliminate NYCHA’s police payment; if this is approved in the fiscal year 2016 City budget, deficits will decrease $70 million each year. Second, the federal operating subsidy should grow by the same percent as expenses; however, in 2019, the subsidy is projected to remain flat. If the subsidy grows at the same rate as expenses (1.8 percent) in 2019, then the 2019 deficit would decrease an additional $17 million in that year. These adjustments drop projected deficits to $79.6 million in 2016, $78.8 million in 2017, $91.2 million in 2018, and $107.2 million in 2019.
The March 2015 plan did not present a new gap-closing plan to balance the 2015 budget.
Recommendations
Chair and Chief Executive Officer Shola Olatoye has stated she will announce a strategic plan for NYCHA next month. This plan should address NYCHA’s projected continued operating budget deficits. The following recommendations should be part of that agenda.
Raise Operating Revenues
NYCHA failed to maximize its own operating revenues even as federal aid became less reliable. Instead it appealed to the City for additional resources and diverted funds from its federal capital subsidy to cover operational expenses. While it cannot generally increase revenues by increasing rents like most landlords, it does have options to bolster its resources to become financially stable and less impaired by shortfalls in Congressional appropriations:
Improve Rent Collection Rates – Monthly rent collection rates should be raised from 77 percent to NYCHA’s target of 95 percent. Losses due to rent arrears totaled almost $50 million in 2013; CBC estimates achieving the target rent collection rate would increase NYCHA’s annual rent revenues by $38.5 million in 2015. In light of the financial impact of collections losses and the substantial wait list of 247,000 families, rent collections should be prioritized.66
Increase Non-Rental Income – Tenant charges for parking have changed only twice in the last decade. In 2013 NYCHA implemented reserved parking permits and increased rates significantly at 43 developments, from $75 per year to $340 per year, still dramatically below market rates. Prices for nonresidents are higher than for residents but are not differentiated by borough or neighborhood—in contrast to the variable pricing of public and private lots across the city. NYCHA’s financial plan reflects rate increases in some parking lots, but parking rates should be increased further to equal local market rates. CBC estimates NYCHA can gain $14.4 million in annual revenues based on conservative assumptions that price monthly parking at $200 in Manhattan and $100 in other boroughs and that one-half of spaces are permitted.
Monthly utility appliance fees should also be increased. Tenants do not pay monthly utility bills and have no incentive to reduce use. Tenants now pay monthly fees of $10 for air conditioners, $5.75 for washing machines, $10 for freezers, and $5 for dishwashers. Increasing these fees could raise additional revenues while potentially curbing energy consumption. Increasing all appliance fees by $5 per month would increase NYCHA’s annual revenues between $5.6 million and $10.8 million.67 Alternatively, NYCHA could meter its units and give each tenant free utilities up to the average cost for a rent-stabilized apartment, with tenants responsible for any cost above the threshold. While this would entail a significant upfront capital investment, the payback period for recouping this investment is relatively short.68
NYCHA should also continue to expand its commercial revenues, which currently comprise only one-half of one percent of its public housing revenues. It should start collecting or increasing rents from nonprofit tenants, and explore opportunities for other commercial enterprises on NYCHA land.; A 5 percent increase in commercial rents, rent collection from nonprofits, and expansion of other commercial activities would conservatively yield $1.5 million in 2015.
Curb Expenses
Significantly Curtail Borough Offices and Increase Property-Level Accountability – NYCHA has three layers of management: the central office, borough offices, and project level. The borough offices increase overhead costs and dilute accountability for repairs and service. The Boston Consulting Group found the borough offices “contain significant shadow function activity” in departments such as budget, human resources, and IT.69 Borough offices should be substantially curtailed, with responsibilities devolved down to property managers for maintenance, operations, and repairs. CBC estimates a 20 percent reduction in borough office headcount, phased in over five years, would save $7 million in 2015 growing to $33.2 million in 2019.
In January 2015 NYCHA launched a pilot program to increase authority of property managers at 18 developments in the Bronx, Brooklyn, and Manhattan. Participating property managers have more control over staff, and skilled trade workers must report to them directly rather than to the borough or central offices. The pilot also introduces standardized performance metrics, introduces processes and procedures built on best practices, and requires increased communication between the property manager and tenants.70 This is a good start, and NYCHA should publicly report on the results of the pilot, including cost savings and impact on maintenance.
Eliminate redundant community and senior centers – In 2014 NYCHA spent $17 million to fund 57 community and senior centers retained when the City’s social service agencies took over provision of senior and community services from NYCHA. The City’s agencies are best suited to providing these services for residents and can serve all residents from the centers the agencies took over in 2013. NYCHA should devote all of its efforts to providing quality housing. Eliminating these functions will save $18.6 million annually starting in 2017, when City support is no longer expected.The gap-closing measures presented in Table 6 are low-hanging fruit that would produce $72.2 million in resources in 2015 growing to $121.1 million in 2019 – eliminating NYCHA’s budget gaps and producing surpluses starting in 2016.
Improve Productivity
Use Job Order Contracts (JOCs) to Perform More Routine Maintenance – Continued improvement in performing maintenance work must remain a priority. JOCs streamline and shorten the procurement process by awarding one contract to fund a variety of small, non-complex, repetitive jobs with minimal design requirements at a particular site. NYCHA has successfully used JOCs to implement security upgrades, but it has not relied on them to the same extent for routine maintenance tasks. Current JOC contracts should be evaluated to determine whether they are appropriately managed, generating cost savings, and improving the quality of maintenance and repairs. To the extent that JOCs are found to be more cost-effective, NYCHA should expand their use to more developments.
Negotiate Work Rule Changes in Collective Bargaining – Work performed after 4:30 p.m. and on weekends, when most residents are home, is compensated at overtime rates. NYCHA should negotiate work schedule flexibility in current negotiations with the Teamsters for the Housing Authority titles.
Explore More Cost-Effective Operating Approaches – In the long term, NYCHA should follow the example of other large urban public housing authorities that are working with private property management companies. In addition to providing savings, this may instruct NYCHA on which aspects of its management and operation could be altered to improve services or lower costs.
Several U.S. housing authorities that have taken this approach report substantial success, including Miami-Dade Housing Authority, Chicago Housing Authority, and Atlanta Housing Authority. The Miami-Dade Housing Authority (MDHA) experience is particularly informative because it included an impact evaluation to compare operating costs of privately and publically managed units with similar characteristics. In 1994 MDHA converted 14 percent of its 12,000 units to private management. Four years later its evaluation revealed that operating costs for privately-managed units were lower than operating costs for units remaining under public control. In the first year of the analysis, average annual management costs per unit were $4,062 and $4,235 for privately managed and publically managed units, respectively. Over the course of the four-year study, costs decreased 20 percent among privately-managed units while average costs increased by three percent among publicly-managed units, leading to annual cost savings of $1,112 per unit. Many of the cost savings derived from more efficient maintenance and procurement.71
NYCHA’s monthly per-unit operating costs exceed those of rent-stabilized landlords by $320. If that gap is reduced 10 percent, there would be savings of $68.4 million starting in 2016.
NYCHA has already taken initial steps in this direction. In 2014 NYCHA transferred the management of six Section 8 properties to two private development companies. The developers will provide substantial funds for renovations and will begin to receive annual federal subsidies to support building operations. Though this agreement relates to Section 8 properties, it is an important initiative that should be evaluated as a model for other developments.
Public housing is a massive enterprise in New York City. This report demonstrates the status quo is unsustainable, and NYCHA needs to implement a strong plan to close operating deficits. Renewed interest in public housing by State and City officials and new leadership at NYCHA offer the opportunity to build a solid new foundation.
Download Report, Including Appendices
Cleaning House: How to Close the New York City Housing Authority's Operating GapsFootnotes
- The 334 developments include 328 public housing developments and 6 Section 8 developments for which NYCHA owns a 50 percent stake.
- The Chair receives a salary of $210,000. The board was previously composed of three salaried members, including one tenant representative. Salaries were eliminated for members other than the Chair when the board was expanded in 2013.
- In accounting terms NYCHA is considered a discretely presented component unit of the City of New York.
- Kat Aaron, “Recession or Depression – are we really better off than we were in the 1930’s?” New America Foundation (January 6, 2012), http://newamerica.net/node/62118.
- The Tenement House Acts of 1867 and 1901 introduced some requirements, such as fire escapes and windows, yet poor conditions persisted as most of the statutory requirements were for prospective developments. In addition, enforcement was underfunded. Legislation in 1926 granted tax exemptions to limited dividend housing corporations for creating housing, but only 6,000 units were built in New York City since projects often needed additional funding. See: Amy Lavine, “From Slum Clearance to Economic Development: A Retrospective of Redevelopment Policies in New York State,” Albany Government Law Review (April 2011), vol. 4, www.albanygovernmentlawreview.org/Articles/Vol04_1/4.1.212-Lavine.pdf.
- Independent bonding authority was important because the State Constitution at the time prevented the State and City from providing authorities with direct funding; the State could not issue bonds for the purposes of slum clearance without voter approval and many municipalities were approaching their constitutional debt limits, preventing them from issuing bonds for public housing. See: Amy Lavine, “From Slum Clearance to Economic Development: A Retrospective of Redevelopment Policies in New York State,” Albany Government Law Review (April 2011), vol. 4, www.albanygovernmentlawreview.org/Articles/Vol04_1/4.1.212-Lavine.pdf.
- Specifically, the State could incur up to $300 million in debt for public housing through 1941 without seeking voter approval, and cities could incur debt above their general debt limits of up to 2 percent of the average assessed property value. Moreover, large cities like New York City could exclude debt on projects that had net gross revenue, including operating subsidies, during the prior year. See: Sec. 3 & 4, Article 18, New York State Constitution.
- Sec. 97, Article 5, New York State Public Housing Law; and Sec. 150, Article 8, New York State Public Housing Law.
- Sec. 73, Article 4, New York State Public Housing Law.
- Nicholas Dagen Bloom, Public Housing that Worked: New York in the Twentieth Century (University of Pennsylvania Press, 2008), pp. 31-34.
- The United States Housing Act of 1937, P.L. 75-412.
- The City provided debt service subsidies to the first five developments it financed, which it funded through an occupancy tax authorized by State law in 1939, and for Glenmore Plaza, which was operational in 1969. See: New York City Housing Authority, Annual Fiscal Report for Fiscal Year Ended December 31, 1954, Comparative Consolidated Statement of Income and Expenses for City Projects in Full Operation During the Period January 1, 1954 to December 31, 1954; Nicholas Dagen Bloom, Public Housing that Worked: New York in the Twentieth Century (University of Pennsylvania Press, 2008), p. 114; and New York City Housing Authority, Annual Fiscal Report (1969), Consolidated Statement of Income and Expenses for City Projects in Full Operation During the Year Ended December 31, 1969.
- Interestingly, on an inflation-adjusted basis the average rent in 1961 for a city-sponsored unit was 53 percent higher than the current NYCHA average.
- The Brooke Amendment was first passed in 1969, but did not cap rents until a later version passed in 1971. The cap also applied to welfare recipients. See: JA Stoloff, A Brief History of Public Housing (Department of Housing and Urban Development, Office of Policy Development and Research), p. 11, http://reengageinc.org/research/brief_history_public_housing.pdf.
- The Performance Funding System, established in 1975, set a base subsidy for each authority based on factors such as utilities, inflation, tenant income, occupancy rates, and audit costs. Costs were usually inflated annually without regard to changes that affected costs until the formula was overhauled in 1998. See U.S. Department of Housing and Urban Development, Public Housing Operating Cost Study (prepared by Harvard University Graduate School of Design, June 6, 2003), p. iii, http://portal.hud.gov/hudportal/documents/huddoc?id=DOC_9238.pdf.
- U.S. Department of Commerce, Bureau of the Census, Money Income of Households, Families, and Persons in the United States: 1980, p. 27, www2.census.gov/prod2/popscan/p60-132.pdf.
- Maggie McCarty, Introduction to Public Housing, Report for Congress R41654 (Congressional Research Service, January 3, 2014), p. 6, http://fas.org/sgp/crs/misc/R41654.pdf; and Rod Solomon, Hawkins Delafield & Wood, LLP, Public Housing Reform and Voucher Success: Progress and Challenges (January 2005), p. 36, www.brookings.edu/~/media/research/files/reports/2005/1/01metropolitanpolicy%20solomon/20050124_solomon.pdf.
- In 2012 NYCHA’s proration rate was greater than that for all public housing authorities: 89 percent compared to an 81 percent for all authorities.
- HUD will subsidize up to 3 percent of vacant units for developments included in the ACC if they are undergoing modernization; if they are being used for special purposes, such as resident services or offices; or if events outside of the housing authority’s control, such as litigation and disasters, necessitate the vacancy.
- In 2010 State leaders amended the Public Housing Law to allow NYCHA to transfer the 20,100 unsubsidized State and City units to two ownership entities: NYCHA Public Housing Preservation I, LLC and NYCHA Public Housing Preservation II, LLC. NYCHA maintains control over the properties, which include a mix of public housing units and units converted to Section 8.
- New York City Housing Authority, “Mixed-Finance Modernization” (accessed November 11, 2014), www.nyc.gov/html/nycha/html/about/mixedfinance_modernization.shtml, New York City Housing Authority, Comprehensive Annual Financial Report for the Years Ended December 31, 2013 and 2012 (2013), p. 5, www.nyc.gov/html/nycha/downloads/pdf/CAFR_2013.pdf, and New York City Housing Authority, Comprehensive Annual Financial Report for the Year Ended December 31, 2012 (2012), p. 15, www.nyc.gov/html/nycha/downloads/pdf/CAFR%202012.pdf.
- City of New York, Office of the Comptroller, Audit Department, Audit Report on Efforts by the New York City Housing Authority to Maximize Federal Funding, Enhance Revenue, and Achieve Cost Savings FK14-072A (December 16, 2014), http://comptroller.nyc.gov/wp-content/uploads/documents/FK14_072A.pdf.
- Office of the State Deputy Comptroller for the City of New York, Review of the Financial Plan of the City of New York (July 2006), Report 5-2007, p. 38, www.osc.state.ny.us/osdc/rpt5-2007.pdf.
- Testimony of Shola Olatoye, Chair and Chief Executive Officer, New York City Housing Authority, before the Council of the City of New York Committee on Public Housing, NYCHA’s Five-Year Operating and Capital Plans (March 21, 2014), www.nyc.gov/html/nycha/downloads/pdf/Committee_Testimony_2014_Budget_Hearing_3_21_14.pdf.
- The Council of the City of New York, Finance Division, Hearing on the Fiscal Year 2013 Executive Budget (June 5, 2012), p. 5, http://council.nyc.gov/downloads/pdf/budget/2013/execbudget/NYCHA.pdf.
- The Council of the City of New York, Office of Communications, “City Council Adopts Fiscal Year 2015 Budget” (press release, June 25, 2014), http://council.nyc.gov/html/pr/062514budget.shtml.
- Data from New York City Office of Management and Budget.
- Phillip Thompson, “Public Housing in New York City,” in Michael H. Schill, ed., Housing and Community Development in New York City: Facing the Future (SUNY Press, 1999), p. 139; and New York City Housing Authority, “Resident Demographics – Operating Programs,” Comprehensive Annual Financial Report for fiscal years 2003 and 2013.
- In 2014 there were approximately 15,000 households in overcrowded units, 44,663 households in under-occupied units with one extra bedroom, and 11,403 households living in extremely under-occupied units, with two or more extra bedrooms. The underutilization is particularly serious given the large waiting list and low turnover rate (3.1 percent). This allows only 5,550 families to be accommodated in a year, meaning it would take more than 44 years to serve all families currently on the list. See: Testimony of Cecil House, General Manager, New York City Housing Authority, before the New York City Council Committees on Public Housing and Housing and Buildings, The Effectiveness and Impact of HPD and NYCHA’s Downsizing Policies and Practices (April 9, 2014), www.nyc.gov/html/nycha/downloads/pdf/committee-testimony-rightsizing-20140409.pdf; and New York City Housing Authority, “About NYCHA Fact Sheet” (April 1, 2014), www.nyc.gov/html/nycha/html/about/factsheet.shtml.
- New York City Housing Authority, “Rent Collection Rate” (accessed November 11, 2014), https://eapps.nycha.info/NychaMetrics/Charts/PublicHousingChartsTabs/?section=public_housing&tab=tab_rent_collection.
- Based on tenant accounts receivable reported as part of allowances for doubtful accounts for 2013. See New York City Housing Authority, Comprehensive Annual Financial Report for the Year Ended December 31, 2013 and 2012, p. 38 http://www.nyc.gov/html/nycha/downloads/pdf/CAFR_2013.pdf.
- New York City Housing Authority, “Parking Information” (accessed March 13, 2015), www.nychaparking.com/parking_maps.php.
- New York City Housing Authority, Comprehensive Annual Financial Report for the Year Ended December 31, 2007, p. 4; New York City Housing Authority, “NYCHA Raises Parking Fees,” New York City Housing Authority Journal (March 2006), p. 2, www.nyc.gov/html/nycha/downloads/pdf/j06mare.pdf; and New York City Housing Authority, “NYCHA Parking Permit Changes Frequently Asking Questions” (accessed November 10, 2014), www.nyc.gov/html/nycha/html/residents/parking-lot-changes-faqs.shtml.
- Approximately $33 per NYCHA unit is attributable to payment made to the City of New York for police services. NYCHA must also meet HUD regulations and consent decrees that can add to its administrative costs.
- CBC analysis based on Adopted Headcount for 2014. See New York City Housing Authority, Operating & Capital Plan: Calendar Years 2014-2018 (December 18, 2013), p. 12, www.nyc.gov/html/nycha/downloads/pdf/2014-2018_Five_Year_Operating_and_Capital_Plan.pdf.
- Local 237 International Brotherhood of Teamsters, “Union Reps: Housing Titles” (accessed November 8, 2014), www.local237.org/37-union-reps/union-reps#Housing.
- Testimony of Shola Olatoye, Chair & Chief Executive Officer, New York City Housing Authority, before the Council of the City of New York, Preliminary Budget Hearing Committee on Public Housing (March 26, 2015), p. 4, http://legistar.council.nyc.gov/LegislationDetail.aspx?ID=2207236&GUID=CFDF3D78-6611-4C39-A2D4-A61673D62C63&Options=&Search=.
- For more information on benefits of municipal employees, see: Citizens Budget Commission, Everybody’s Doing it: Health Insurance Premium-Sharing by Employees and Retirees in the Public and Private Sectors (January 2013), www.cbcny.org/sites/default/files/REPORT_HIS_01282013.pdf, and Charles Brecher, “The Public and Private Sector Wage Disparity: An Update,” CBC Blog (May 25, 2010), www.cbcny.org/cbc-blogs/blogs/public-and-private-sector-wage-disparity-update.
- New York City Employee Retirement System, “Physically Taxing Titles” (August 2013), www.nycers.org/(S(pxwt4dzf5qwqxg55zz24sy2u))/Pdf/forms/712.pdf.
- The City of New York, Office of the Mayor and Department of Citywide Administrative Services, 2013 Workforce Profile Report (2013), p. 90, www.ibo.nyc.ny.us/iboreports/2013workforceprofilereport.pdf.
- New York City Housing Authority, “NYCHA Eliminates More than 233,000 Repair Work Orders from Its Backlog” (press release, September 4, 2013), www.nyc.gov/html/nycha/html/news/nycha-eliminates-over-233000-repair-work-orders-from-its-backlog.shtml.
- New York City Housing Authority, “NYCHA Metrics,” accessed March 5, 2014, https://eapps.nycha.info/NychaMetrics/Charts/PublicHousingChartsTabs/?section=public_housing&tab=tab_repairs.
- City of New York, Mayor’s Office of Operations, “New York City Housing Authority,” Preliminary Mayor’s Management Report (February 2015); and New York City Housing Authority, “NYCHA Metrics,” accessed March 5, 2014, https://eapps.nycha.info/NychaMetrics/Charts/PublicHousingChartsTabs/?section=public_housing&tab=tab_repairs.
- Data for the first four months of City fiscal year 2015. NYCHA officials state delays are due to Superstorm Sandy-related issues, but in fiscal year 2012, prior to Sandy, turnaround time was 31 days and apartments were vacant for 40 days, consistent with the data at least three years prior. See: City of New York, Mayor’s Office of Operations, “New York City Housing Authority,” Mayor’s Management Report (September 2014), and City of New York, Mayor’s Office of Operations, “New York City Housing Authority,”Preliminary Mayor’s Management Report (February 2015).
- Mireya Navarro, “In Public Housing, Units Languish in Limbo,” New York Times, December 15, 2013; and Julie Strickland, “Public Housing Sits Vacant as City Gears Funds to Existing Units” The Real Deal (blog entry, December 16, 2013), http://therealdeal.com/blog/2013/12/16/public-housing-sits-vacant-as-city-gears-funds-to-existing-units.
- Developments are charged for centralized services based on their use of the service (e.g. pro-rata share of work repairs) or their share of dwelling units (e.g. cost of waiting list management). Developments must also pay management fees, which generate revenue to support operations in the central office. The general management fee replaces traditional overhead and is based on average market rate. The asset management fee funds the central office for activities related to project-based management, budgeting, and accounting. See New York City Housing Authority, FY 2007 Budget and Four-Year Financial Plan, Volume 1 of 2 (May, 2007), p. 45, www.nyc.gov/html/nycha/downloads/pdf/FY2007_budget_book1.pdf; and Project-Based Budgeting and Accounting 24 C.F.R 990.280.
- New York City Housing Authority, Reshaping NYCHA Support Functions BCG Engagement: Key Findings and Recommendations (prepared by the Boston Consulting Group, August 2012), p. 33.
- CBC analysis of data in New York City Housing Authority, Operating & Capital Plans Calendar Years 2014-2018 (December 18, 2013), p. 23, www.nyc.gov/html/nycha/downloads/pdf/2014-2018_Five_Year_Operating_and_Capital_Plan.pdf; New York City Rent Guidelines Board, “2013 Price Index of Operating Costs” (April 18, 2013), p. 14, http://www.nycrgb.org/downloads/research/pdf_reports/pioc13.pdf; and New York City Rent Guidelines Board, “Housing NYC: Rents, Markets & Trends 2014” (May 20, 2014), p. 31.
- In a handful of developments, tenants pay utilities directly and NYCHA provides a utility allowance through a rent deduction. See New York City Housing Authority, “Applying for Public Housing General Questions” (accessed November 12, 2014), www.nyc.gov/html/nycha/html/assistance/generalfaq.shtml#q21.
- New York City Housing Authority, Comprehensive Annual Financial Report for the Years Ended December 31, 2013 and 2012 p. 7, www.nyc.gov/html/nycha/downloads/pdf/CAFR_2013.pdf.
- Utilities Expense Level: Computation of Current Consumption Level, 24.C.F.R. 990.175; Utilities Expense Level: Computation of the Rolling Base Consumption Level, 24 C.F.R. 990.180; and Utilities Expense Level: Incentives for Energy Conservation/Rate Reduction, 24 C.F.R. 990.185.
- New York City Housing Authority, FINAL – PHA Agency Plan Annual Agency Plan for Fiscal Year 2015 Five Year Agency Plan for Fiscal Years 2015-2019 (October 20, 2014), p. 111, www.nyc.gov/html/nycha/downloads/pdf/FY2015_NYCHA_Annual%20Plan_Final.pdf.
- The Comptroller’s audit includes NYCHA’s response, which disagrees with the Comptroller’s assessment. See City of New York, Office of the Comptroller, Audit Department, Audit Report on Efforts by the New York City Housing Authority to Maximize Federal Funding, Enhance Revenue, and Achieve Cost Savings, FK14-072A (December 16, 2014), p. 12, http://comptroller.nyc.gov/wp-content/uploads/documents/FK14_072A.pdf.
- City of New York, Office of the Mayor, “Mayor de Blasio and HUD Secretary Castro Announce Nation’s Largest Energy Savings Program for a Public Housing Authority” (press release, April 9, 2015), www1.nyc.gov/office-of-the-mayor/news/230-15/mayor-de-blasio-hud-secretary-castro-nation-s-largest-energy-savings-program-a#/0.
- New York City Housing Authority, Comprehensive Annual Financial Report for the Year Ended December 31, 2004, p. 15.
- New York City Housing Authority, PHA Plan – Final Annual Plan for the Fiscal Year 2011 (October 15, 2010), p. 178, http://www.nyc.gov/html/nycha/downloads/pdf/FY2011_AnnualPlan.pdf.
- Arizona State University and Alliance for Construction Excellence, Job Order Contracting for Novices: Just the Basics (2002), p. 1, www.jocexcellence.org/documents/JOC_for_Novices.pdf.
- City of New York, Department of Investigation, Investigation into New York City Housing Authority’s Funding and Installation of Security Cameras and Improvements (November 2014), pp. 12-13, www.nyc.gov/html/doi/downloads/pdf/2014/Nov14/pr28nychacameras_112114.pdf.
- See: John Toscano, “Thompson Seeks Alternative to Closing NYCHA Senior Centers,” Western Queens Gazette (November 5, 2008), www.qgazette.com/news/2008-11-05/senior_page/018.html; and New York Nonprofit Press, “Sequestration Forces NYCHA to Close 106 Community & Senior Centers” (June 19, 2013), www.nynp.biz/index.php/breaking-news/15752-sequestration-forces-nycha-to-close-106-community-a-senior-centers.
- New York City Housing Authority, Reshaping NYCHA Support Functions BCG Engagement: Key Findings and Recommendations (prepared by the Boston Consulting Group, August 2012), p. 33.
- City of New York, Office of the Comptroller, Audit Department, Audit Report on Efforts by the New York City Housing Authority to Maximize Federal Funding, Enhance Revenue, and Achieve Cost Savings FK14-072A (December 16, 2014), http://comptroller.nyc.gov/wp-content/uploads/documents/FK14_072A.pdf.
- For purposes of calculating the subsidy under the Operating Fund Rule, rental income was frozen at 2004 levels until federal fiscal year 2009. See: Calculation of Formula Income, 24 C.F.R. 990.195.
- NYCHA raised more than $140 million between 2007 and 2009 and $60 million between 2009 and 2012. See: New York City Housing Authority, Comprehensive Annual Financial Report for the Fiscal Year Ended December 31, 2009, p. 5; and The Council of the City of New York, Finance Division, Report on the 2015-2019 Operating and Capital Budget & the Fiscal 2015 Preliminary Mayor's Management Report: New York City Housing Authority (March 26, 2015), p. 3.
- Furman Center for Real Estate and Urban Policy, New York University, and Moelis Institute for Affordable Housing Policy, New York University, Should the next mayor support the New York City Housing Authority’s plan to lease its undeveloped land for the construction of market-rate rental housing? (2013), http://furmancenter.org/files/publications/NYChousing_NYCHA.pdf.
- City of New York, Office of the Comptroller, Audit Department, “Audit Report on Efforts by the New York City Housing Authority to Maximize Federal Funding, Enhance Revenue, and Achieve Cost Savings” FK14-072A, pp. 23 and 27, http://comptroller.nyc.gov/wp-content/uploads/documents/FK14_072A.pdf.
- HUD rules are unclear about how much of this revenue NYCHA would be able to retain in the long run.
- Assumes air conditioners are used for 3 months each year and all other appliances are used for 12 months. Low estimate ($5.6 million) assumes air conditioners are used by 30 percent of households and all other appliances are used by 15 percent of households. High estimate assumes 40 percent of households use air conditioners and 30 percent of households use the other appliances.
- Don Millstein, “Advanced Submeters Reveal Savings Opportunities for Multifamily Housing,” Multi-Housing News (February 22, 2013), www.multihousingnews.com/features/advanced-submeters-reveal-savings-opportunities-for-multifamily-housing/1004073871.html.
- New York City Housing Authority, Reshaping NYCHA Support Functions BCG Engagement: Key Findings and Recommendations (prepared by the Boston Consulting Group, August 2012), p. 33.
- Meeting minutes, Board of the New York City Housing Authority (December 22, 2014), p. 20, www.nyc.gov/html/nycha/downloads/pdf/board_meeting_minutes_12222014.pdf.
- Fred W. Becker, Milan J. Dluhy, and John P. Topinka, “Choosing the Rowers: Are Private Managers of Public Housing More Successful Than Public Managers?” The American Review of Public Administration (June 2001), vol. 31 no. 2, pp. 181-200.