Cut Costs, Not Ribbons
Alternatives That Reduce School Crowding
New York City’s population has grown over the last two decades, and the city is attractive to young adults as well as families with children. This sustained popularity has perpetuated crowding in many public schools. The Department of Education (DOE) reports that 618 of its 1,413 school buildings are crowded; these buildings accommodate 520,000 of the city’s 1.1 million public and charter students and their capacity is 95,984 seats fewer than required.
The DOE uses multiple strategies to cope with this problem, but its primary response is to build new schools. From 2005 through September 2018, the agency spent $9.1 billion to build new schools with a capacity of 98,302 seats. Another 20,488 seats funded by the current capital plan ending in fiscal year 2019 are in design or construction. The DOE’s capital plan for fiscal years 2020 to 2024 includes $7.9 billion for 89 new school buildings with a capacity of 56,917 seats.
Construction of new schools is slow, expensive, and not always well targeted to ameliorating crowding. More flexible and cost effective approaches, including rezoning, re-purposing available seats, and altering admissions policies, are underused by the DOE. New school construction should be used only when alternative strategies are inadequate.
Alternative strategies can address the entire current seat need of 32,000 at the high school level and 43 percent of the elementary and middle school seat need of 64,000, leaving a reduced need of about 36,000 seats to be achieved through new construction. This lower target could reduce capital spending by at least $2.4 billion and yield annual debt service savings of at least $150 million for New York City and State. New seats currently in design or under construction and projected enrollment declines could further reduce the need for added capacity in the new capital plan.
This report consists of four sections. The first describes the nature of the school crowding problem, explaining how the DOE measures it, what contributes to it, and where it is most severe. The second section describes the progress the DOE has made through new school construction, and documents the problems associated with this strategy. The third section describes alternative strategies involving more efficient use of school space and estimates how much those strategies can ameliorate the current problem. The final section identifies how much new construction would still be needed, and estimates the savings from the capital plan that would result from substituting alternative strategies for much of the planned new construction.
The Nature of the Problem
DOE’s method to measure crowding has evolved over the years.1 Crowding can refer to “schools” and to “buildings.” Schools are administrative units to which staff and students are assigned, but they are not physical structures; buildings are physical entities that house one or more schools and in some cases other uses.
This report uses “buildings” as the unit of analysis. These physical structures are most meaningfully characterized as crowded. The DOE determines if a building is crowded by comparing its instructional capacity to its student enrollment. Student enrollment is a relatively straightforward metric and is reported regularly.
Instructional capacity can be determined in different ways. The DOE’s approach is summarized in Appendix I. The calculation involves two basic steps. First, the amount of instructional space in a building is identified. This requires exempting from the calculation a reasonable amount of space that is needed and used for non-instructional purposes. This includes administrative offices such as the principal’s and guidance counselors’ offices and areas such as cafeterias and auditoriums that are not used for instruction.
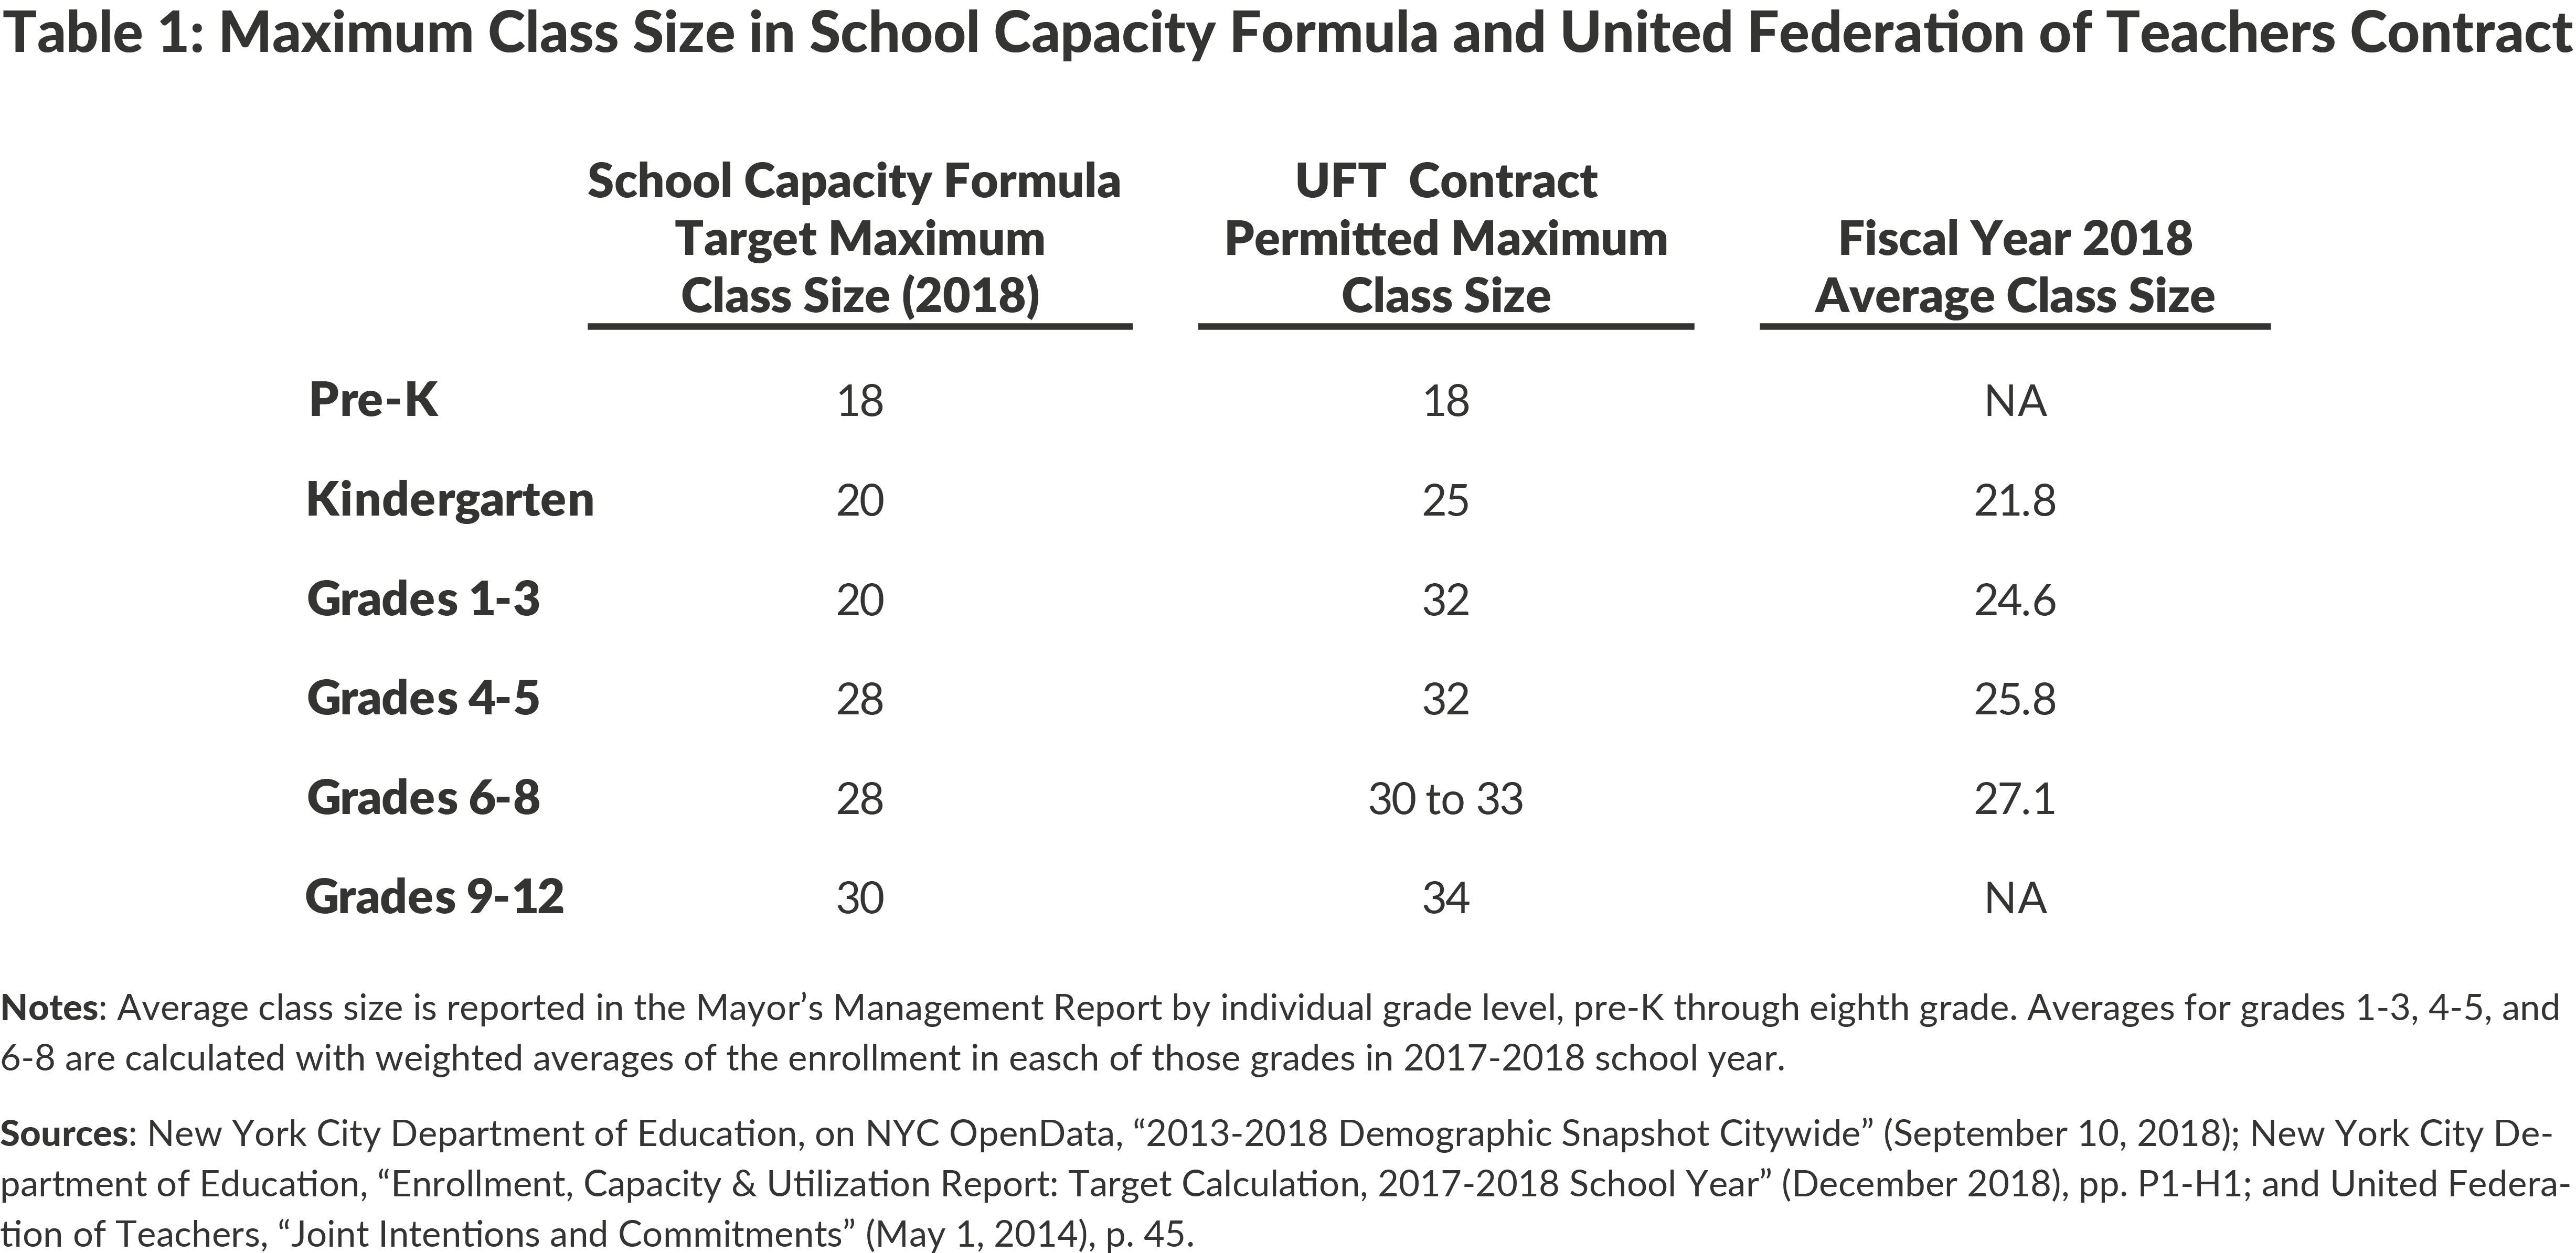
Second, the student capacity of this instructional space is calculated based on standards for what is needed to safely and effectively serve the students. The capacity of a room is based on providing a minimum number of square feet per student up to a maximum class size. The minimum square footage per student for most grades (1-8) is 20, with more space for prekindergarten (pre-K) students and less space for high school students. Class size caps vary by grade and range from 18 for pre-K to 30 for high school. (See Table 1.) A building is deemed crowded if its enrollment exceeds its calculated capacity.
Crowding is in part a reflection of assumptions about class size. The DOE class size maximums used in the capacity formula are below current average class sizes in some grades and below the class size limits set by the United Federation of Teachers (UFT) union contract, which are the maximum class sizes the City is permitted to schedule. The class sizes used by the DOE are targets that reflect class size reduction efforts by the City, with the goal of ensuring sufficient space to attain these targeted levels in the long run.
Categorizing Buildings by School Level
The nature of the crowding problem varies by school level. Traditionally students have been described as at one of three levels—elementary (grades kindergarten to 5), middle school (grades 6 to 8), and high school (grades 9 to 12). Since 2014 the DOE created opportunities for universal enrollment of four-year-old children into pre-K and more selected enrollment of three-year-old children. As of the 2017-2018 school year, the pre-K citywide enrollment was 67,881, with 29,664 of these students accommodated in DOE buildings and the remainder in programs run by community organizations or charter schools at separate facilities.[2]
To categorize each building by level, the schools within each building were first categorized as elementary, middle, or high schools. Generally schools are organized to serve a single level. However, some exceptions are made to this pattern: some schools span grades K to 8, others span grades 6 to 12, and a handful serve grades K to 12. For the analysis in this report schools spanning grades K to 8 and K to 12 are identified as elementary schools, and those serving grades 6 to 12 as high schools.
Buildings are categorized based on the level of the school they house; buildings with more than one school generally have multiple schools at the same level, but those with different level schools are identified based on the school or schools that made up the largest enrollment.
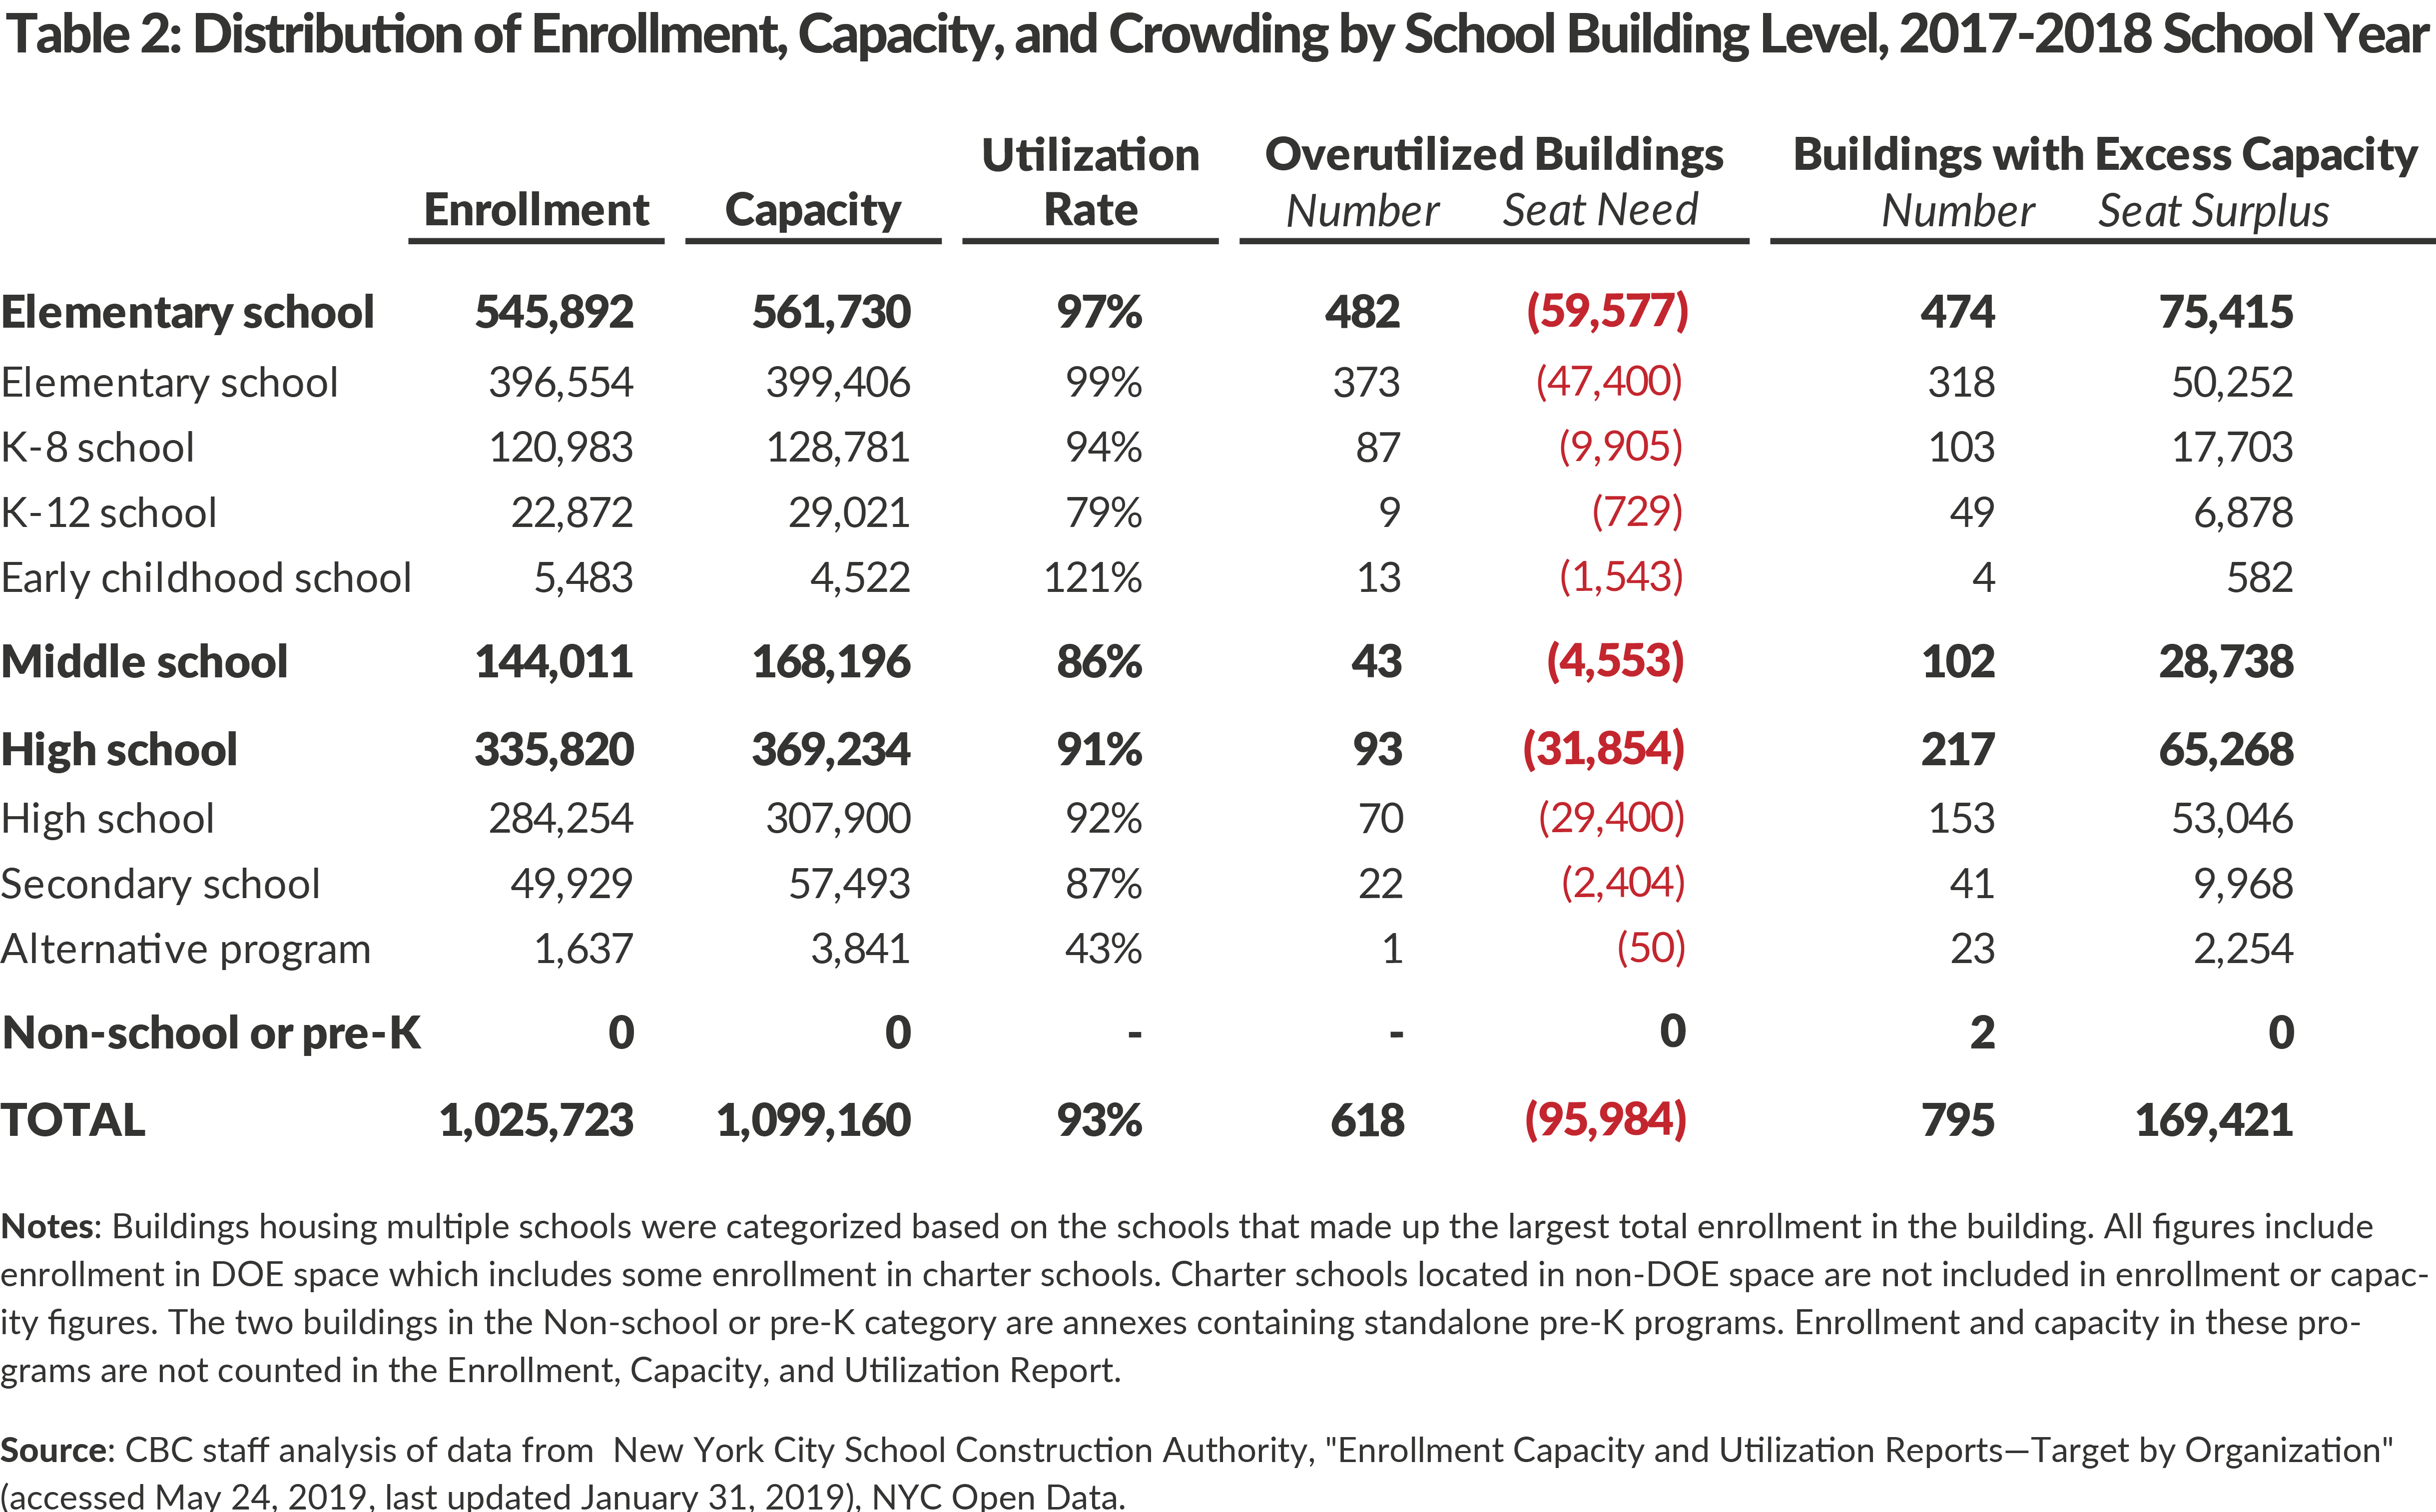
Citywide, 618 school buildings are crowded, with a shortage of 95,984 seats.3 (See Table 2.) The extent of the seat need at crowded school buildings and the seat surplus at non-crowded buildings vary by level. Nearly two-thirds of the seat need, or 59,577 seats, is in elementary school buildings. At the middle school and high school level, the seat need at crowded buildings is significantly smaller and less than the seat surplus at other buildings.
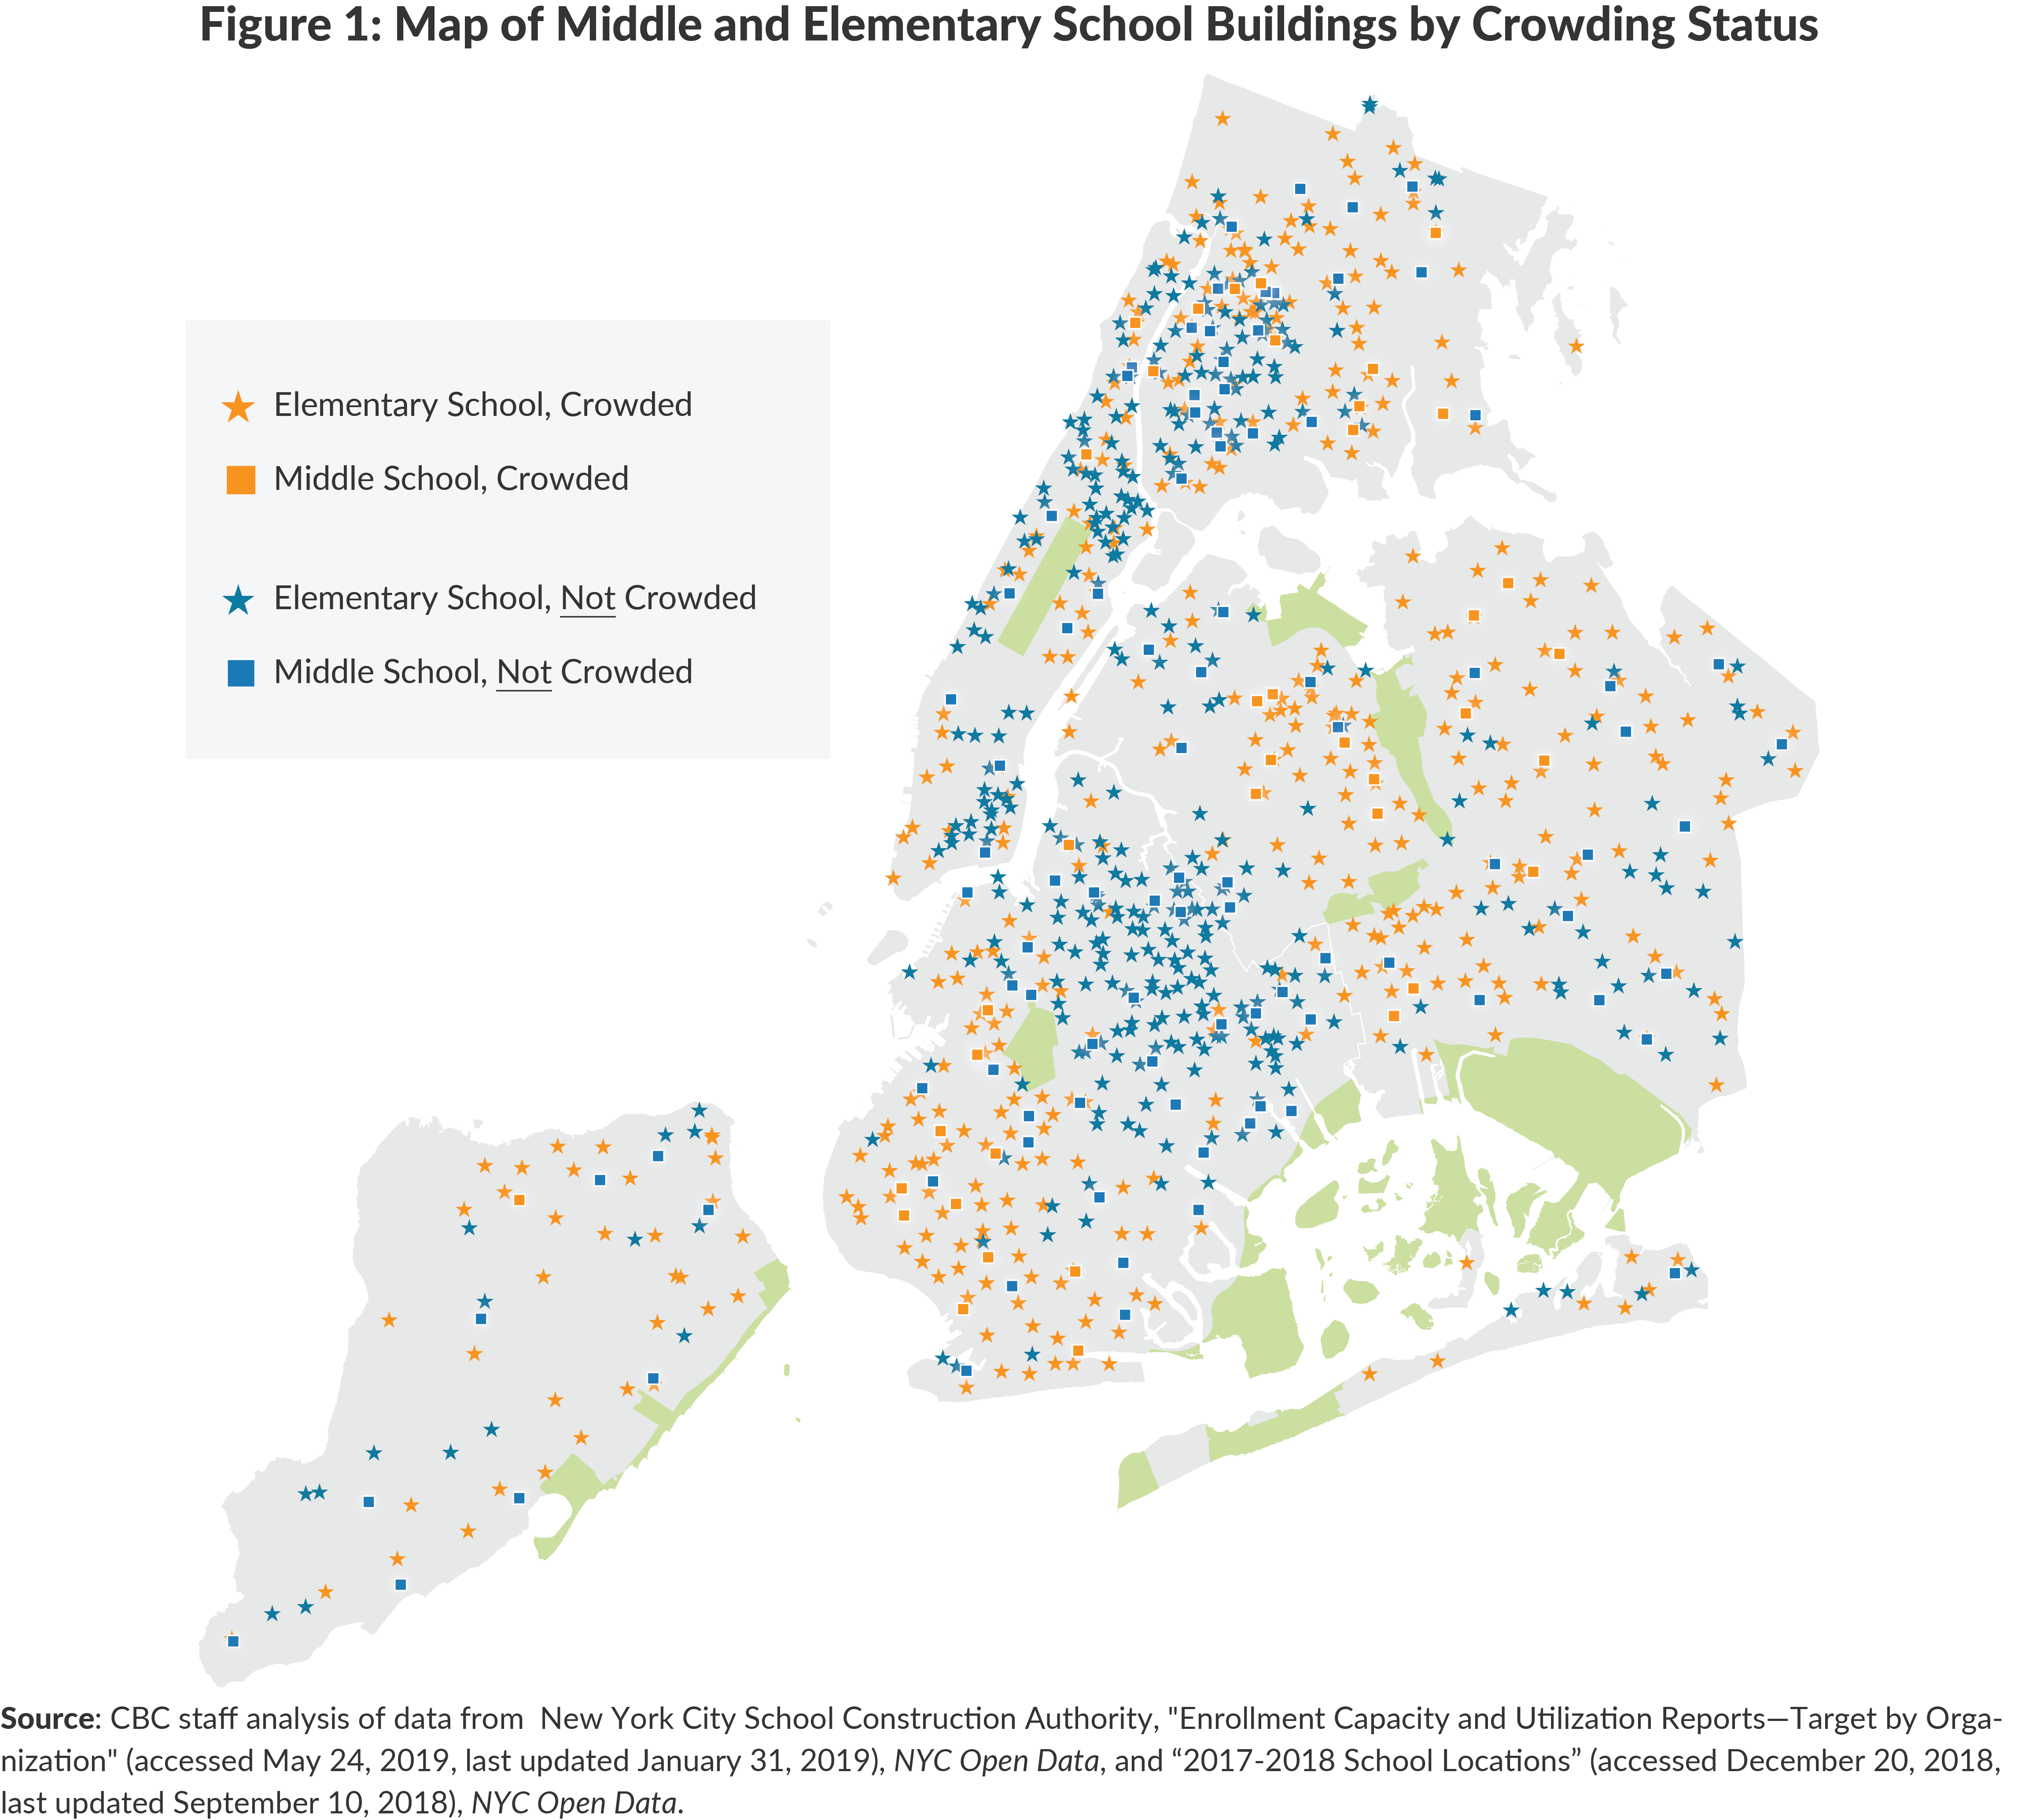
Crowding can also be looked at geographically. Figure 1 shows the locations of elementary and middle school buildings by crowding status. Each of the 32 community school districts contains some crowded elementary buildings, but they are clustered in some areas, including southwest Brooklyn, much of Queens, and the central Bronx. In areas with many crowded elementary buildings, the middle school buildings are frequently not crowded.
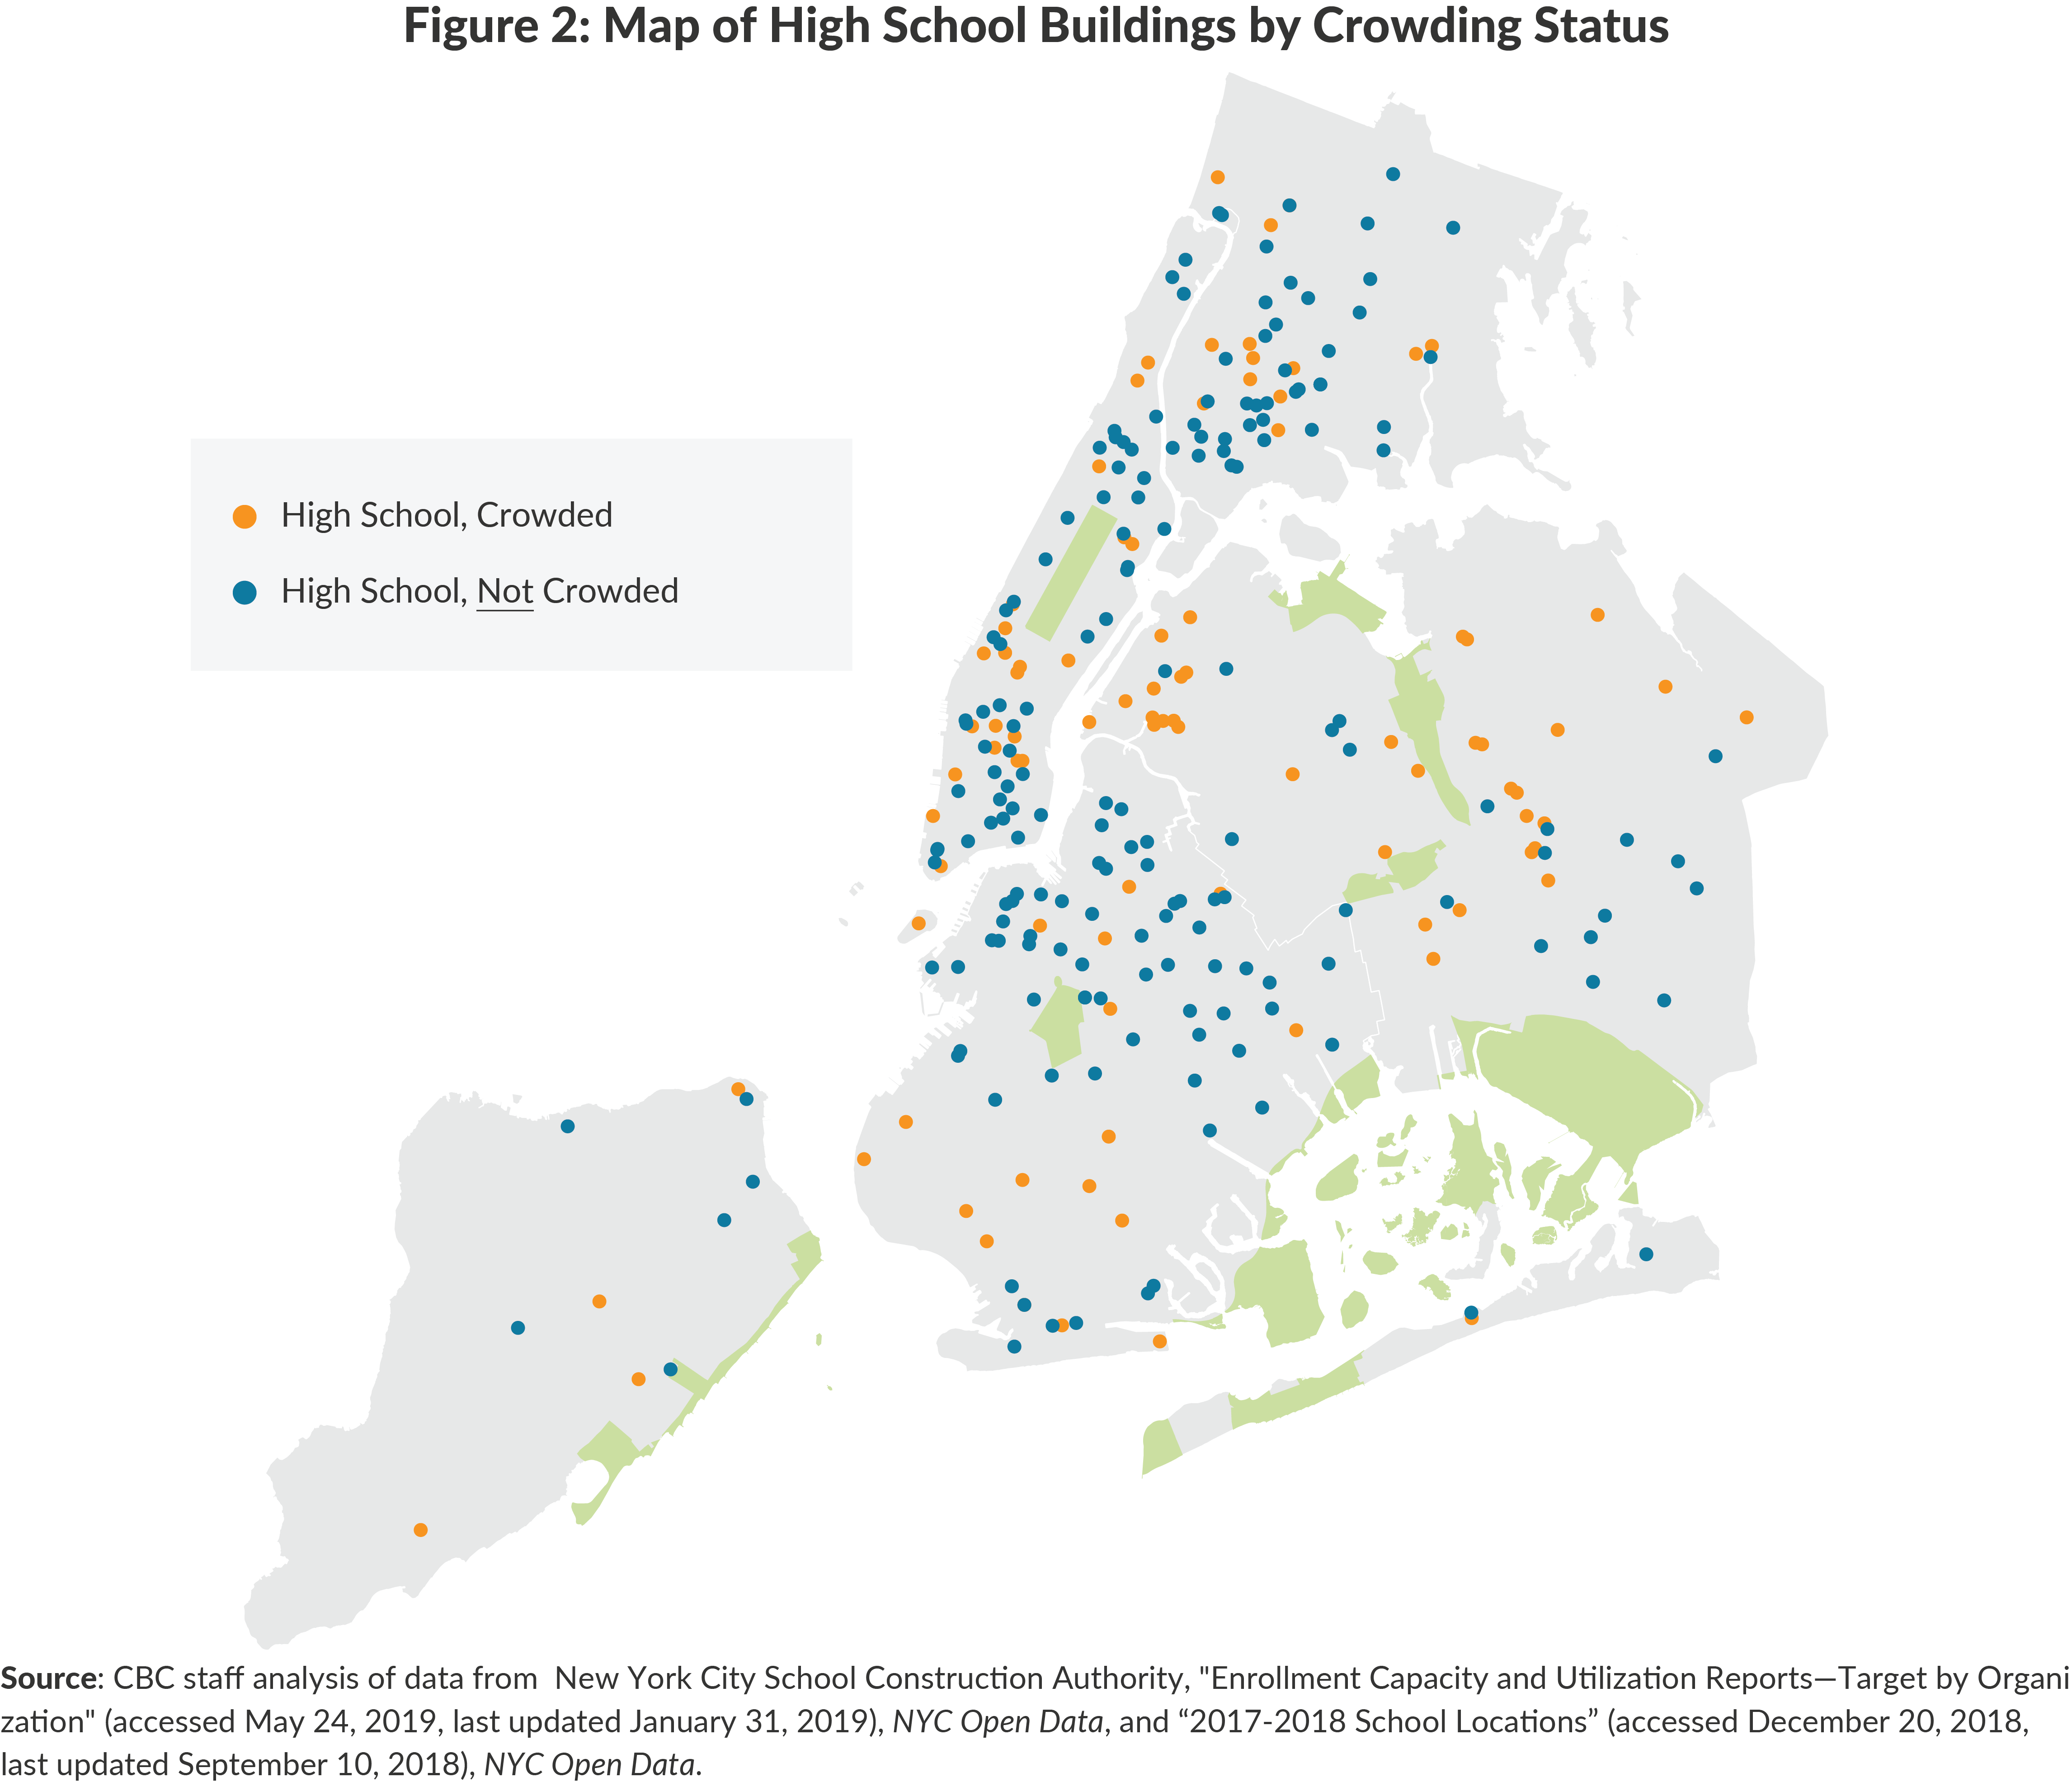
Figure 2 shows the locations of high school buildings by crowding status. The distribution of crowded high schools resembles that of crowded elementary and middle schools, and uncrowded high schools are clustered in central Brooklyn.
Differing Causes of School Crowding by Level
The causes of crowding vary by school level but are related to how students are assigned to schools. At one end are elementary schools with admissions largely defined by geographic school zones. On the other end of the spectrum are high schools with a citywide admissions process. Middle schools fall between the two.
Elementary School Admissions and Crowding
In 29 of the 32 school districts, elementary schools are “zoned.” The school is assigned a specific residential geographic area and accepts all students from that area. If more students enroll in a given year than the school has capacity for under the DOE’s standards, then the school becomes “crowded.” If enrollment reaches the UFT caps, the schools can cap enrollment and institute a lottery.
Three geographically small districts have no zoning and students are free to choose any of the districts’ schools. In these “choice” districts principals and district officials have discretion to cap enrollment at a school if they believe it is becoming too crowded, and some students will not be able to enroll at their priority choice.
Middle School Admissions and Crowding
Some middle schools are zoned; 17 districts have 105 zoned middle schools.4 At these schools, crowding arises for reasons similar to those at elementary schools.5 The 17 districts with some zoned middle schools also have middle schools that are not zoned, which make up the majority of middle schools citywide. At un-zoned middle schools, or choice middle schools, admission is based on application, but only students living or attending elementary school in the district are eligible to apply. These middle schools become crowded when school officials admit more students than indicated by their DOE capacity standards. Middle school officials may opt for more students because they feel the actual capacity is sufficient to instruct safely and effectively the larger number of students who want to attend the school.
High School Admissions and Crowding
Crowding arises in high schools for different reasons than in elementary schools. Only 22 of 423 high schools are zoned.6 For the vast majority of high schools enrollment is determined through a citywide admission process in which students apply to multiple schools indicating their priorities. Schools select among the students using a variety of criteria including competitive exams, grades, attendance record, and in some cases a lottery. High school principals and DOE officials have discretion in deciding how many students to admit to a school without being limited by the DOE-determined capacity.
Crowding emerges in high schools because some are more popular than others, and officials are willing to accept more students than the DOE capacity standards specify. The appeal to students may be academic reputation, instructional approach, and convenient location. Although the schools are not zoned, many students do not want to travel extensively to attend school and opt for nearby high schools. In areas of dense and growing population these geographically convenient schools can become crowded. Both parents and officials are willing to trade off crowding for other criteria.
Illustrative of the sometimes “voluntary” nature of high school crowding are three of the city’s most competitive and prestigious high schools. The Bronx High School of Science is at 130 percent of capacity with 688 more students than its capacity; Brooklyn Technical High School is at 130 percent of capacity with 1,336 more students than its capacity; and Stuyvesant High School is at 122 percent of capacity with 612 more students than its capacity.
Principals at these and other crowded schools may use school space more efficiently than the capacity formula assumes. For example, the formula for high schools assumes that regular classrooms can be used 7 out of 8 periods and specialty rooms, such as the gym or art room, can be used 5 out of 8 periods. Principals who program classrooms more intensively than this may be able to accommodate the desired class sizes despite enrollment that is over the building’s calculated capacity. Similarly some crowded schools may rely on “split sessions” to accommodate added students; this arrangement extends the school day and adds periods during which classrooms may be scheduled.
Extent of School Crowding by Level
Crowding in Elementary Schools
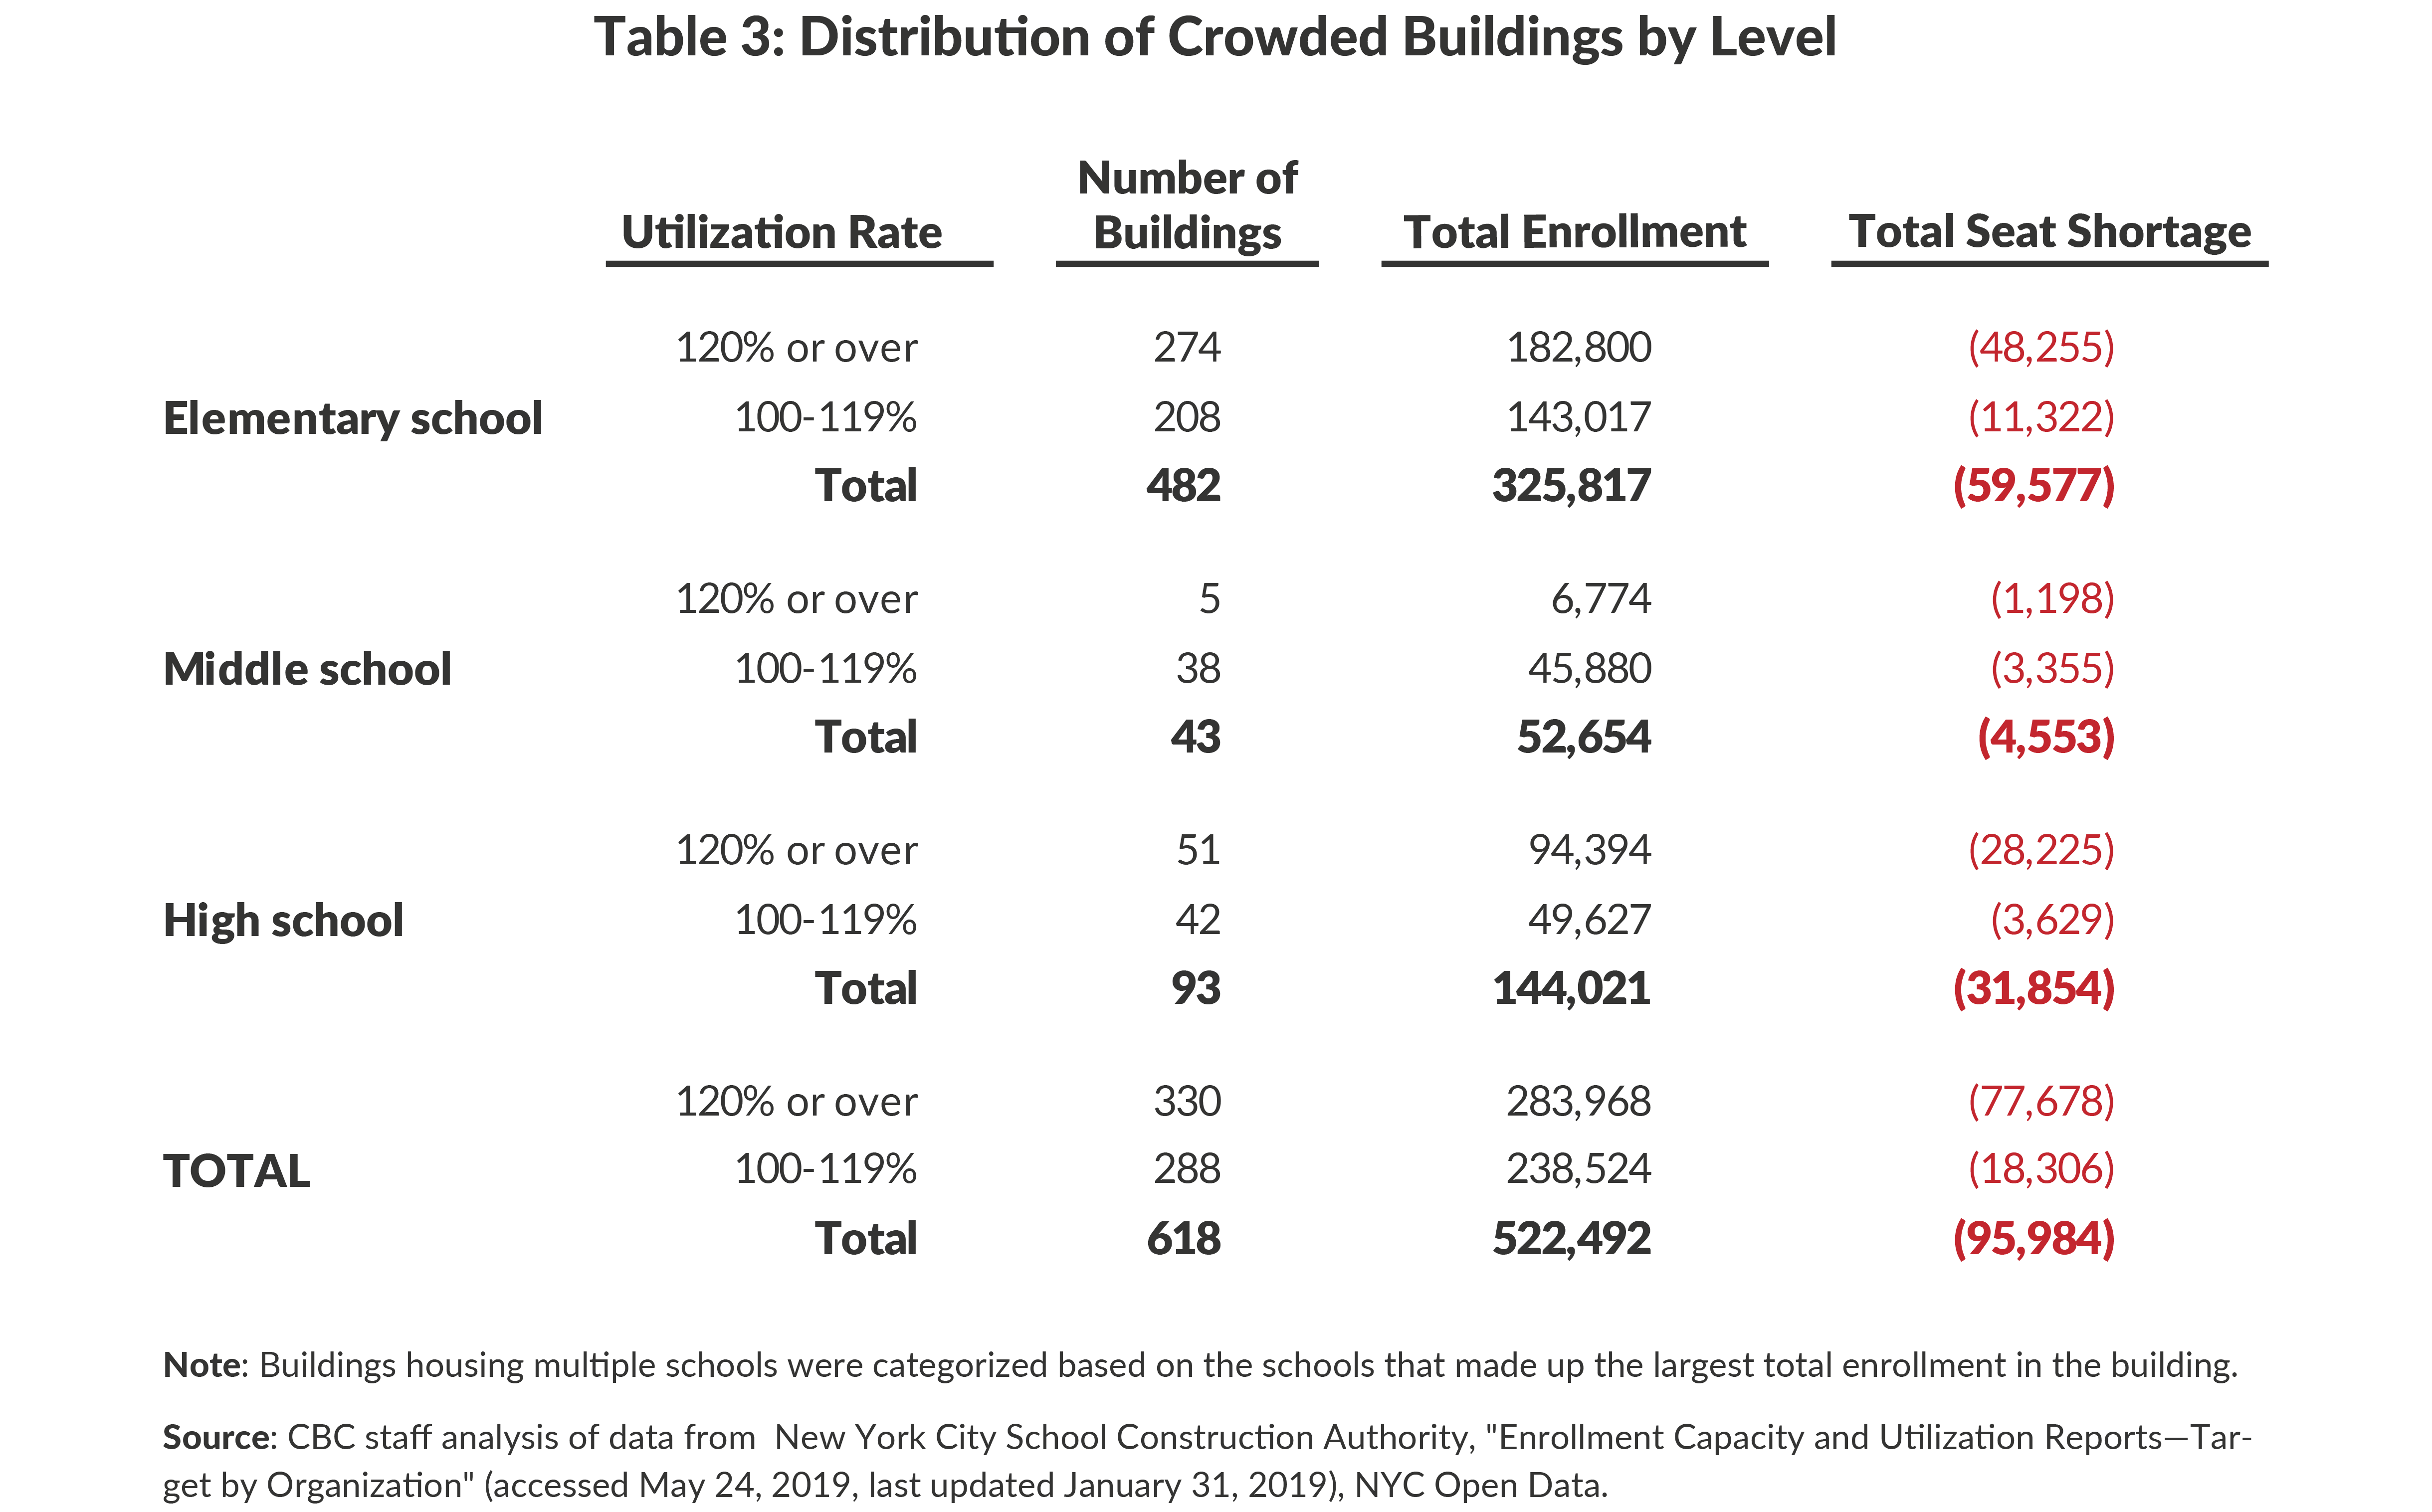
Based on the DOE’s standards, 482 elementary school buildings are crowded.7 In total the crowded elementary school buildings are at 122 percent of capacity, representing a shortage of 59,577 seats. The bulk of the shortage, 48,255 seats, is at 274 buildings that are at more than 20 percent above capacity. The 208 buildings less than 20 percent above capacity have a combined shortage of 11,322 seats or an average of about 54 per building. (See Table 3.)
Crowding in elementary schools is not limited to zoned schools. The three choice districts together have 50 elementary school buildings, of which 12 are crowded.8 District-level utilization rates in these three districts ranges from 73 percent to 92 percent. In these districts without zones and with sufficient districtwide capacity, buildings are crowded because of voluntary decisions made by school officials and students’ families.
Crowding in Middle Schools
Of 145 middle school buildings, 43 are crowded. However, only in four districts does middle school enrollment exceed middle school capacity; 13 crowded buildings are in these districts. Another 21 crowded buildings are located in districts with excess capacity and some zoned middle school admissions, suggesting that the mismatch between the zone and its population may be a cause of crowding in these cases.9 The remaining nine crowded buildings are in districts that have sufficient middle school capacity and do not have any zoned middle schools.
The degree of crowding at middle schools is less than at elementary schools. In total the 43 crowded buildings have a shortage of 4,553 seats or 9 percent of their enrollment. The utilization is less than 120 percent at 38 buildings; just 5 middle school buildings have utilization above 120 percent.10
Crowding in High Schools
According to DOE standards 93 of 310 high school buildings are crowded with an excess enrollment of 31,854 students. In theory, however, no high school needs to be crowded, because admissions are decided on a citywide basis and citywide high school capacity exceeds enrollment—citywide utilization is 91 percent and there is a surplus capacity of 33,414 seats.
Of the 93 crowded high school buildings, 35 are in Queens, 22 in Manhattan, 19 in Brooklyn, 13 in the Bronx, and 4 in Staten Island. On average the crowded buildings are at 128 percent of capacity. About half of the crowded buildings are at less than 120 percent of capacity with an average shortage of 86 seats. Fifty-one high school buildings are at more than 120 percent of capacity, and these buildings account for 89 percent of the shortage of seats at high school buildings.11 Buildings become crowded because school officials decide to enroll more students than the official capacity at schools that are desired by students.
The Shortcomings of New Construction
The DOE’s primary strategy to address crowding has been new school construction undertaken by the New York City School Construction Authority (SCA). In conjunction with the DOE, the SCA develops and implements five-year capital plans to build new school spaces and rehabilitate older ones. These plans are informed by demographic projections that forecast future enrollment by district and grade level.
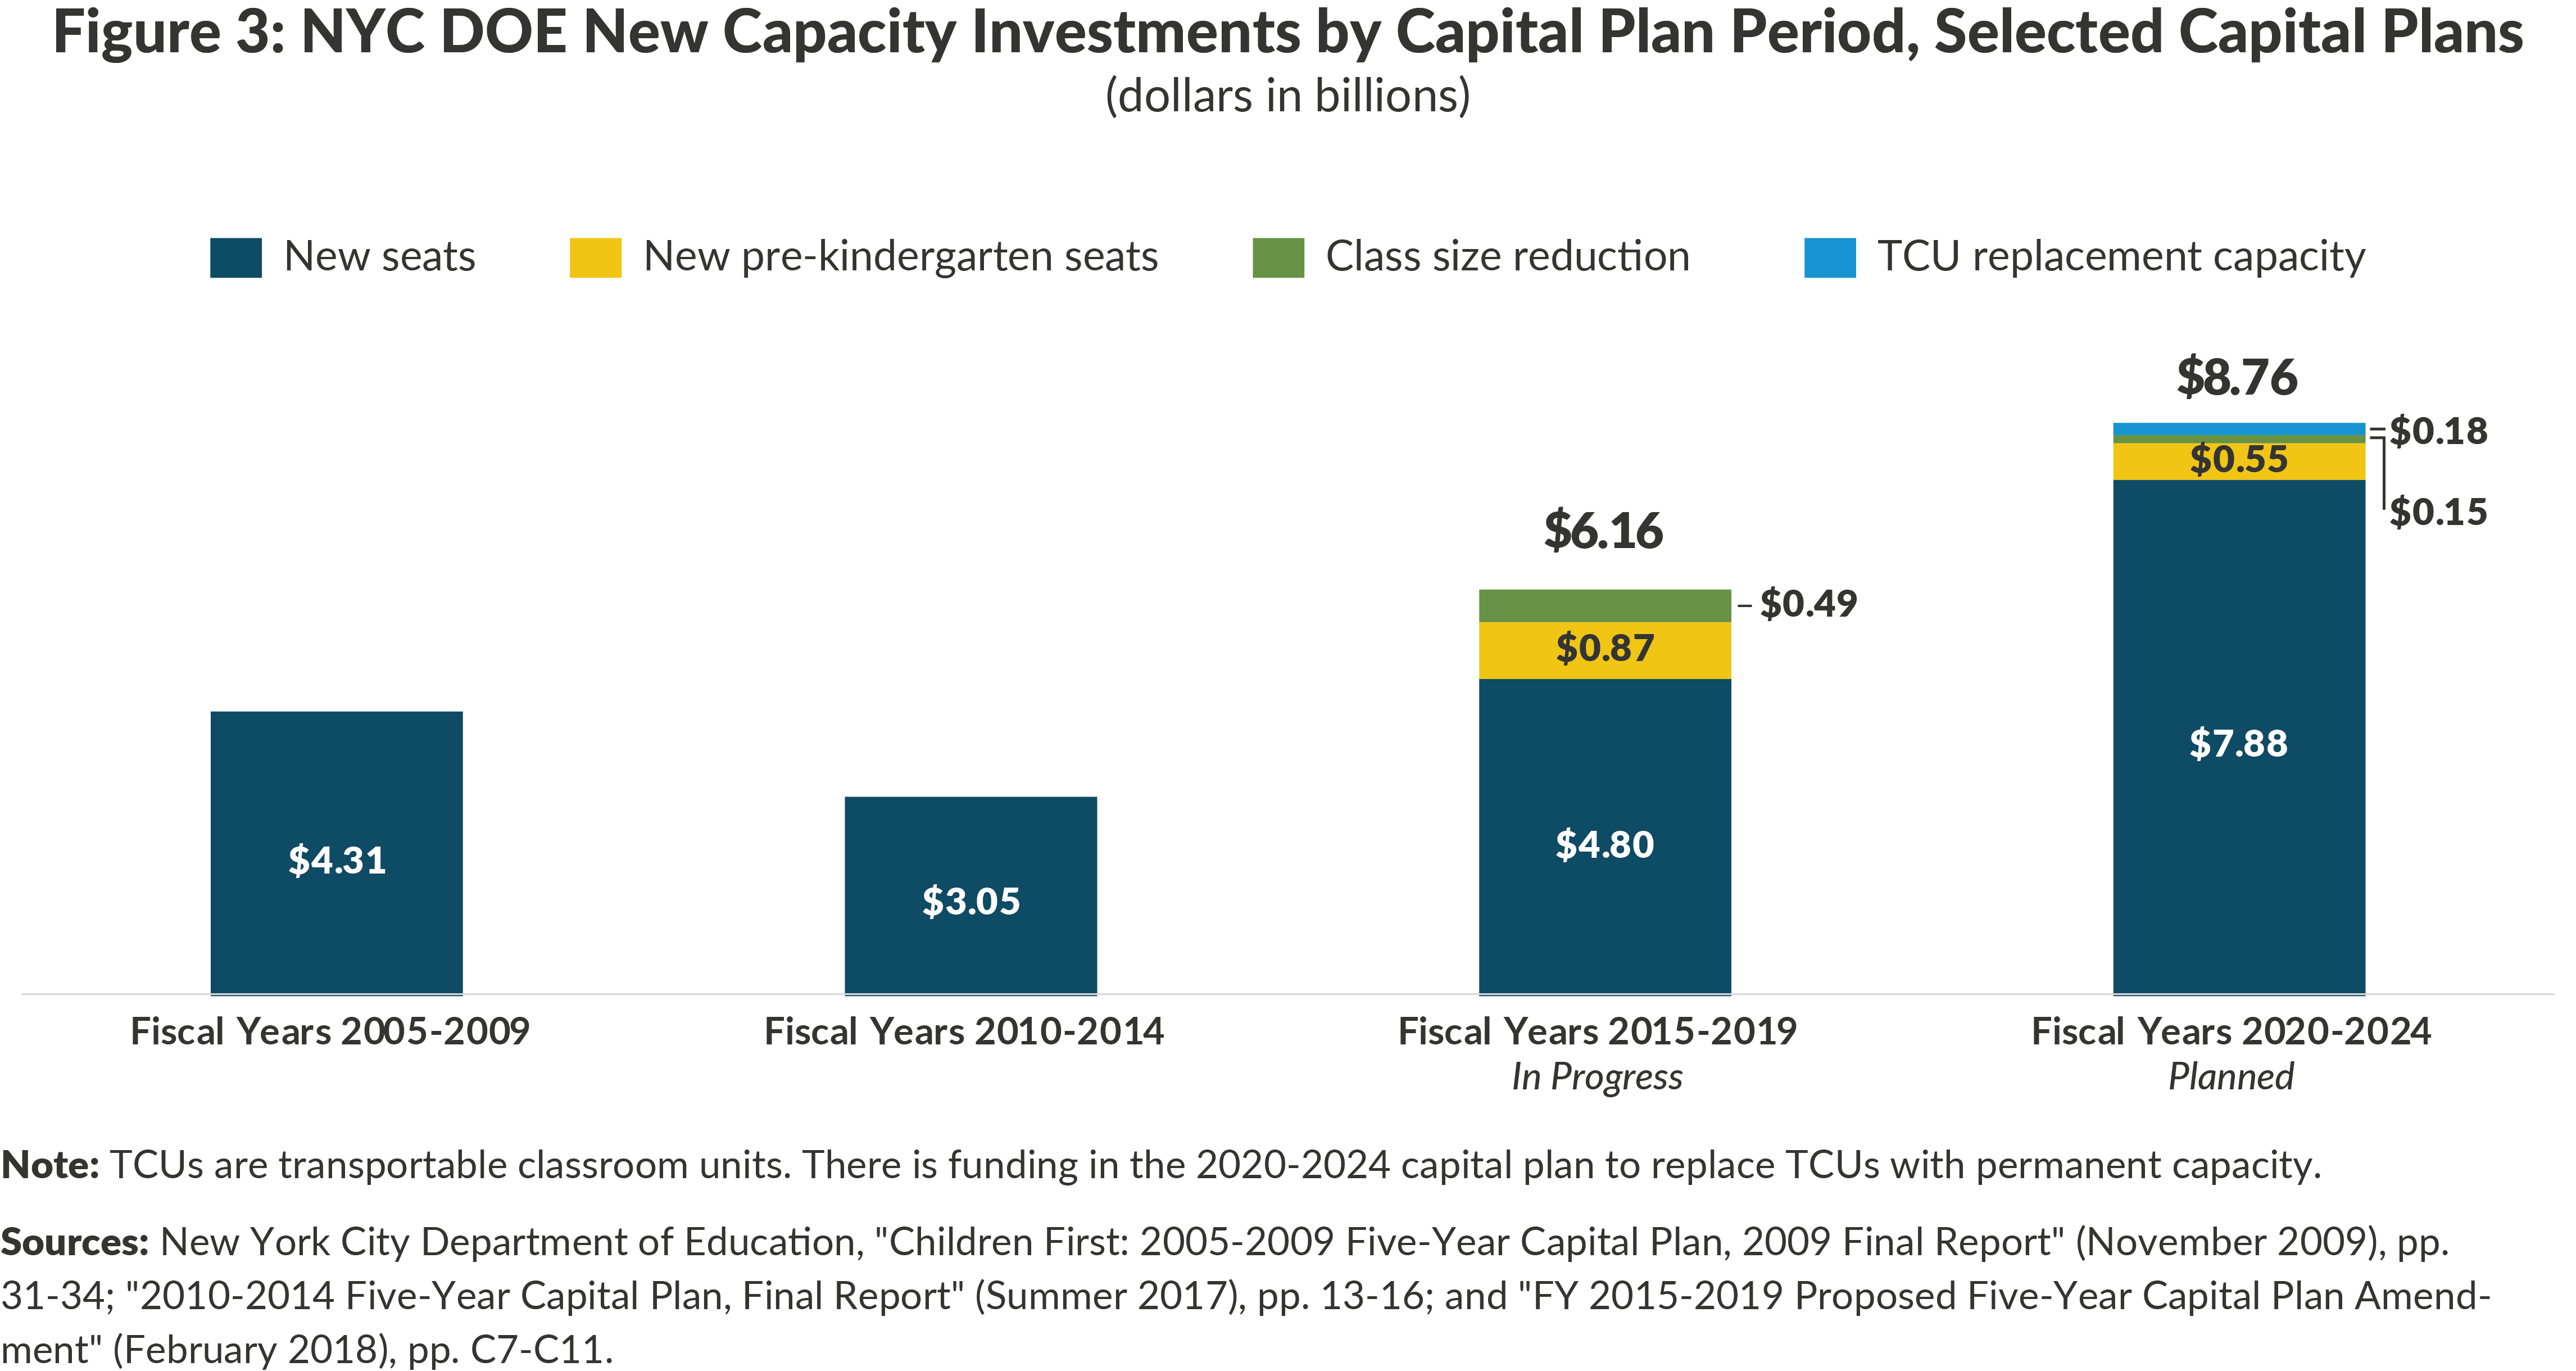
Since 2005 the SCA has implemented three plans spanning fiscal years 2005-2009, 2010-2014, and 2015-2019 with $13.5 billion planned for new seats—about one-third of total DOE capital spending ($40.4 billion) in this period.12 This consisted of $12.2 billion for building new K-12 space; $872 million for accommodating the expansion of pre-K; and $490 million in funding for class size reduction projects for crowded schools in areas without funded new capacity. (See Figure 3.)13
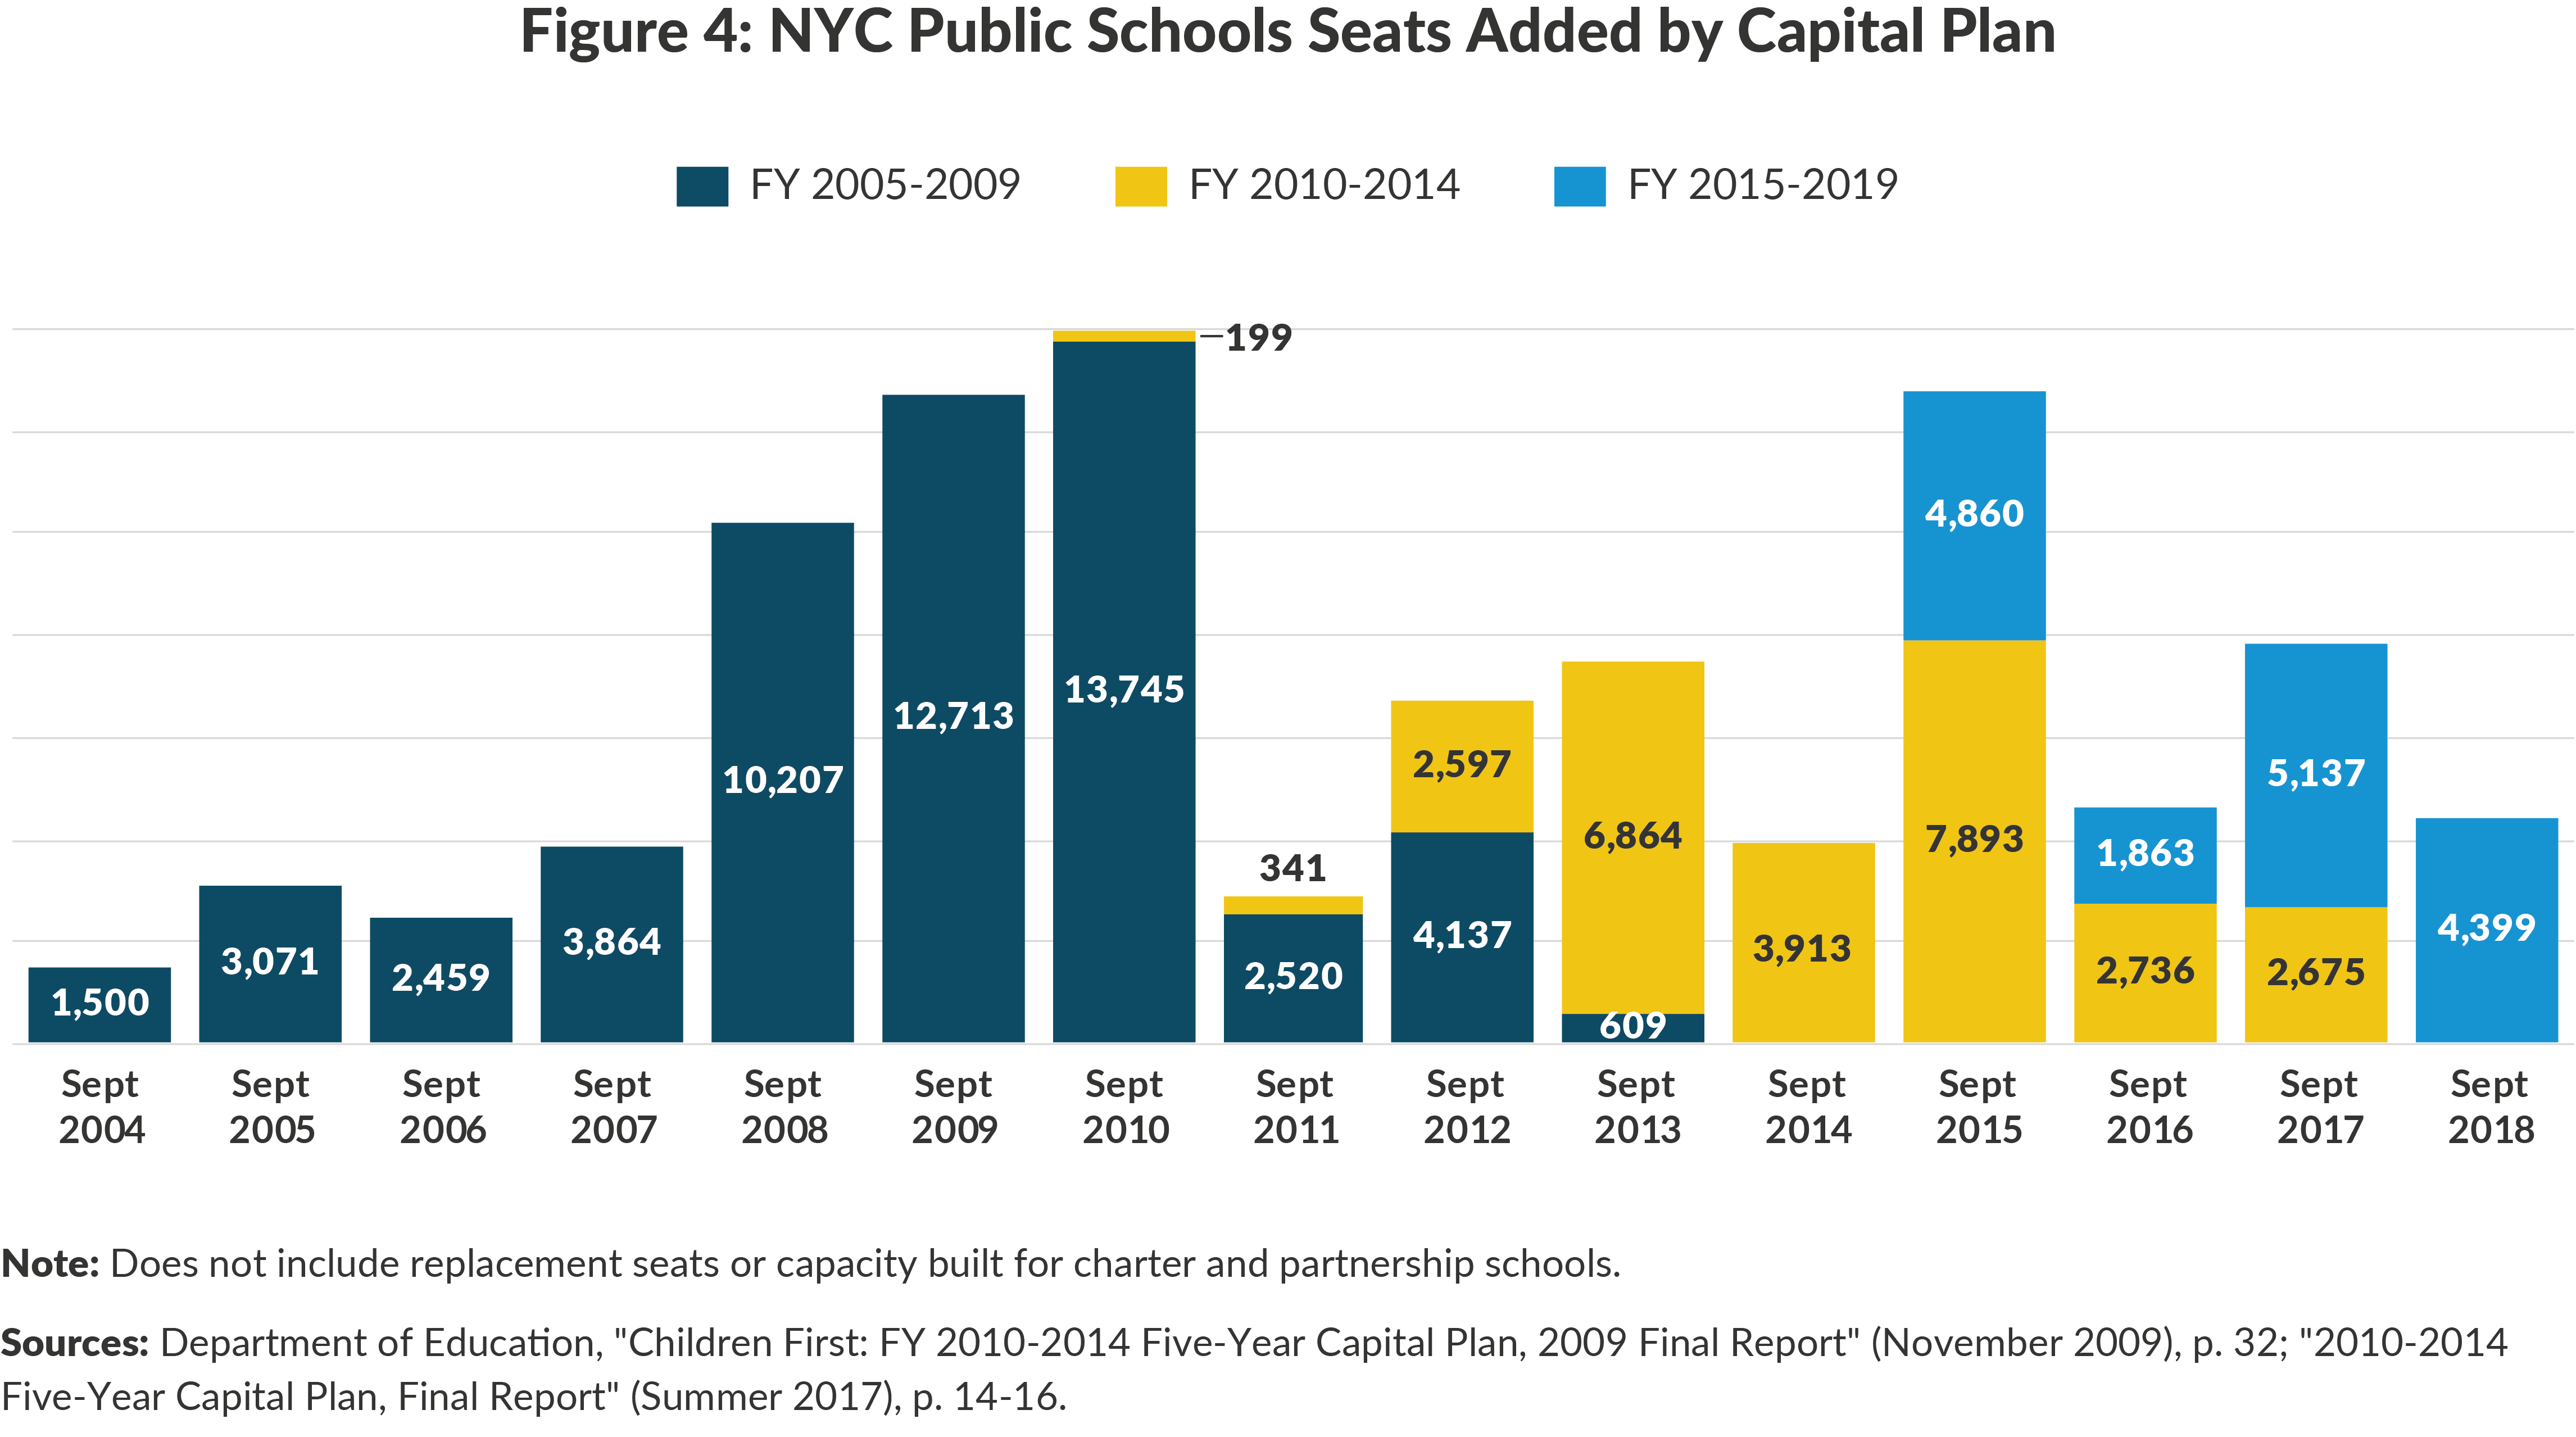
Through September 2018, $9.1 billion of the $13.5 billion has been spent constructing a total of 98,302 seats. This total includes 54,825 seats under the 2005-2009 plan, 27,218 seats under the 2010-2014 plan, and 16,259 seats built through September 2018 in the 2015-2019 plan.14 (See Figure 4.) Another 20,488 seats from the 2015-2019 are currently in progress and scheduled for completion by September 2022; the remainder of seats planned under the 2015-2019 plan were rolled into the 2020-2024 capital plan.15
The DOE has proposed a $17 billion capital plan for fiscal years 2020 to 2024. It contains $7.9 billion for 56,917 seats of new K-12 capacity, $550 million for additional pre-K and 3-K capacity, $150 million for class size reduction, and $180 million to construct capacity to replace Transportable Classroom Units (TCUs) that are currently used for instruction.16
This strategy has three shortcomings:
- It is expensive;
- It is slow; and
- It has not been well targeted to alleviating crowding.
New Seats Are Expensive
The cost of a constructing a new seat has risen from just under $79,000 in the 2005-2009 plan to nearly $117,000 in the 2015-2019 plan. (See Table 4.) The 2020-2024 plan budgets $121,270 on average per new seat.
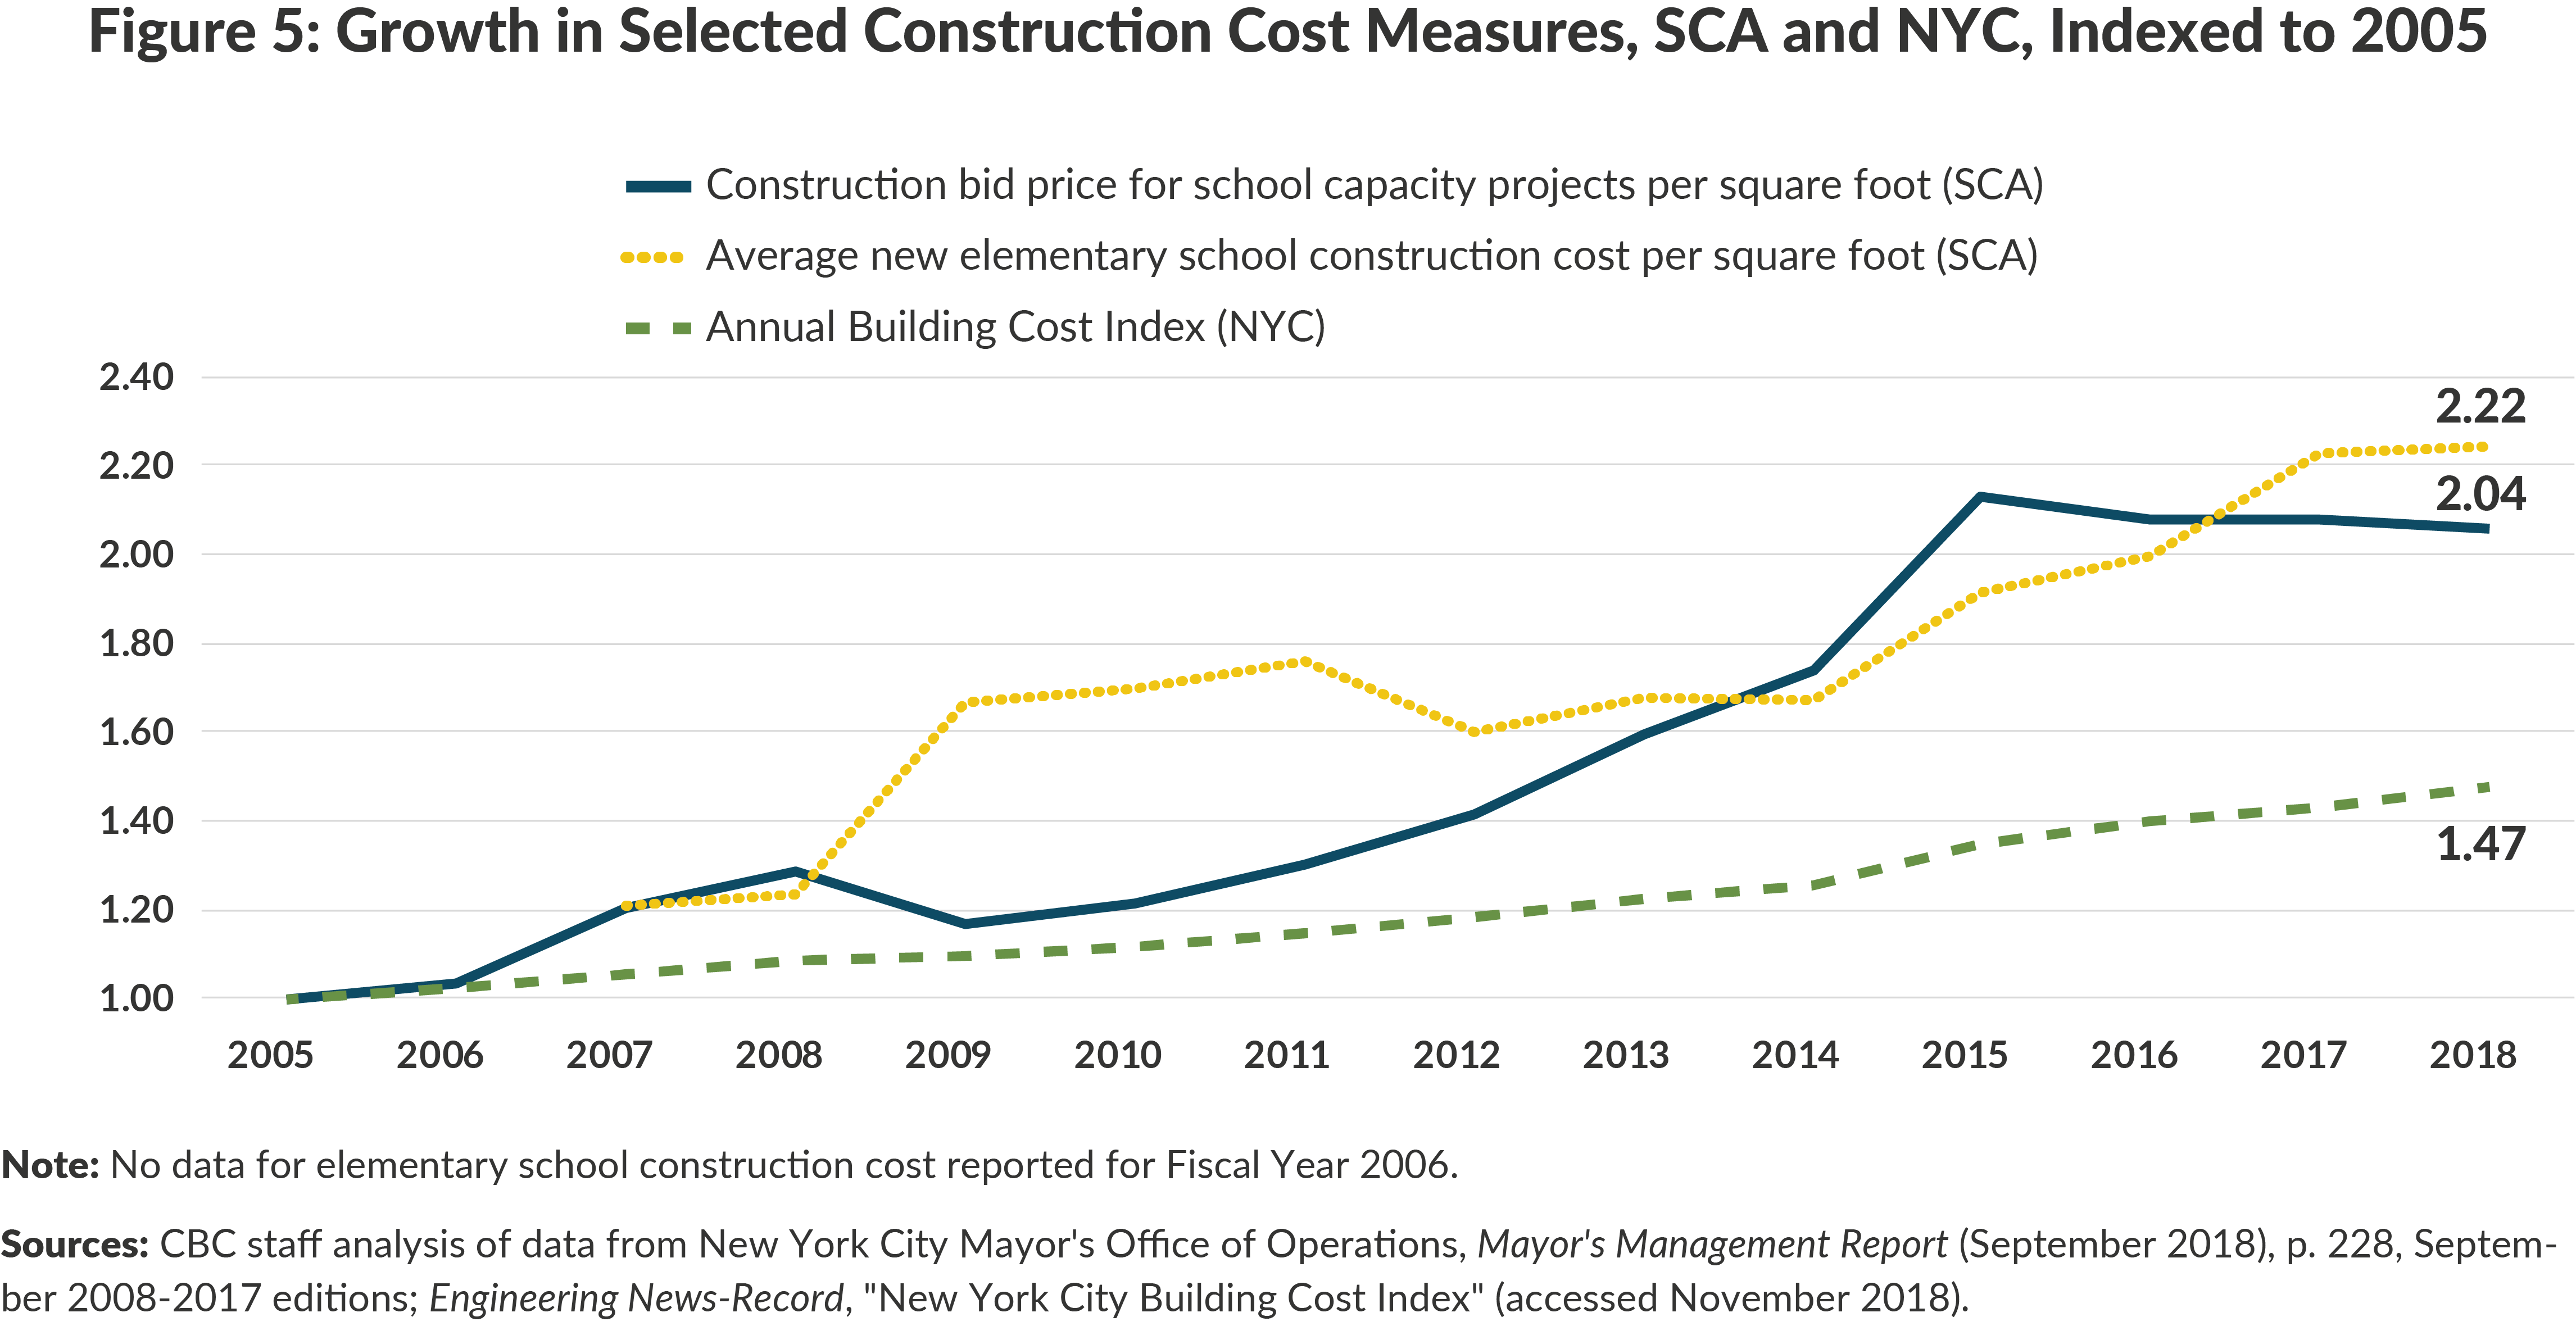
The rise in the SCA’s construction costs has been more rapid than for construction cost generally. The Building Cost Index (BCI) for New York City, which tracks a standardized combination of costs including labor and materials, rose 47 percent from 2005 to 2018, while the construction bid price per square foot for school capacity projects rose 104 percent and the average construction cost per square foot for new elementary schools rose 122 percent.[i] (See Figure 5.) The reasons for this rapid rise in costs warrant further analysis, but the high and rising cost should be a major concern for the continued use of new construction as a primary strategy.

School Construction Is a Slow Process
Building a new school takes a long time. The process involves early steps of selecting a site and setting a scope for the project—size, grade levels, and other space uses. The SCA has design criteria that limit the potential site for a school, and parcels large enough to accommodate a school are in short supply.18 Siting a new school is a time-intensive process that involves multiple stakeholders.19 Once a site and scope are set, the project goes to the design and then construction phases.
The SCA’s reports permit analysis of the time it takes for the design and construction phases. New capacity projects in the 2015-2019 plan scheduled to be completed by September 2018 took an average of 41 months from the start of design to the end of construction.20 This does not include time for site selection and scoping, which could significantly lengthen this timeline.
The long implementation period may be justified by the long life of the completed project, but can affect the degree to which a project achieves its goals. The demographic projections used to identify the need for a project may not capture later shifts that can increase or reduce the need for new capacity at a given site. Launching of new programs such as pre-K can alter priorities for needed space. New construction provides little flexibility to adjust to changing circumstances during its extended implementation.
New Seats Have Been Insufficiently Targeted
New school capacity is not created exclusively to address current crowding. Buildings may be initiated in anticipation of population growth in designated neighborhoods. This analysis looks at the district level, but the DOE plans new capacity based on smaller units known as sub-districts.
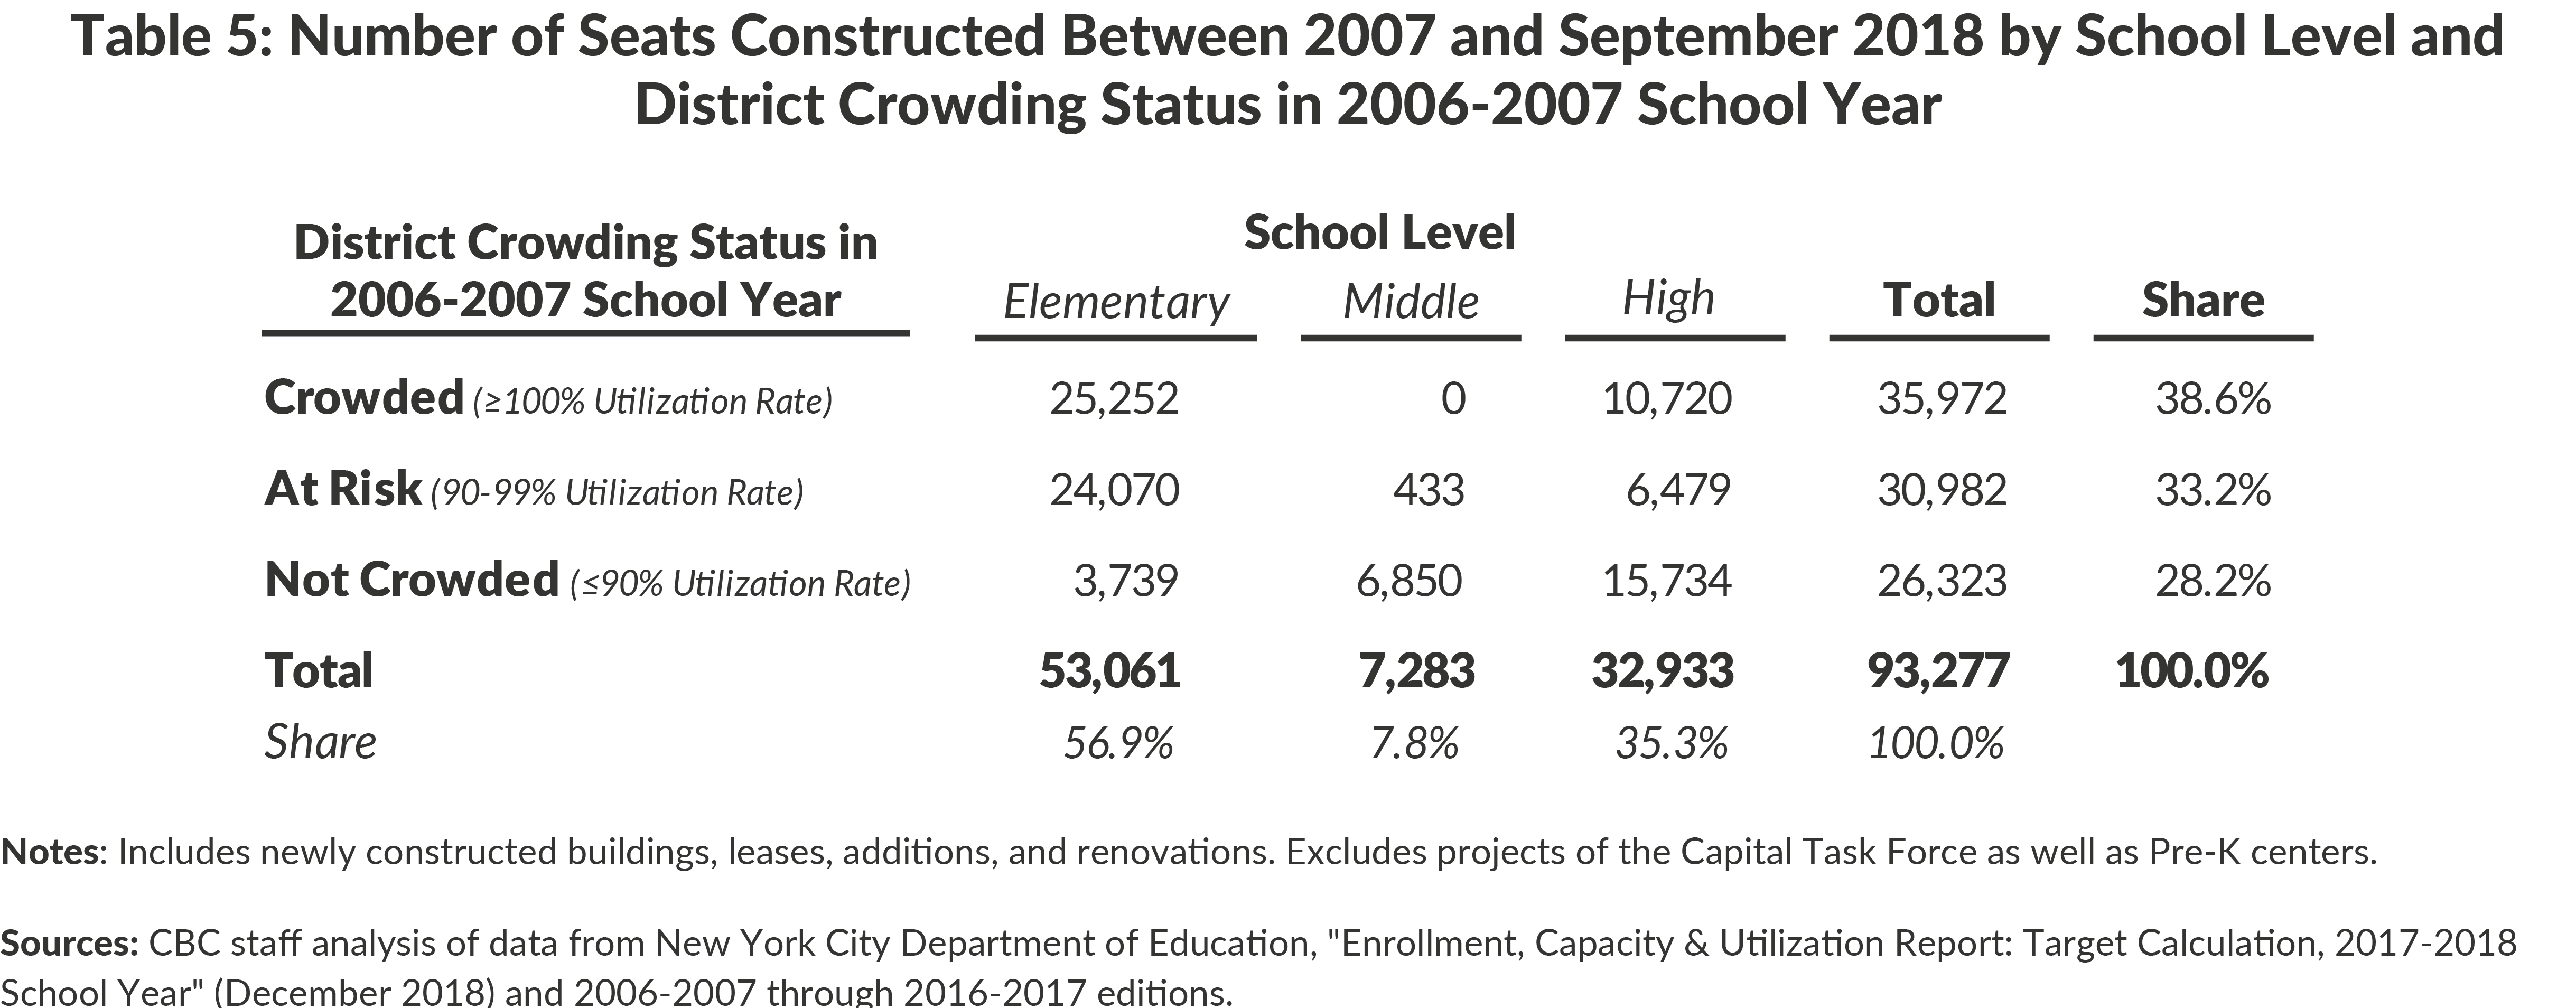
Of the 93,277 seats built since 2007, a majority were for elementary students, the group for whom crowding is most serious. (See Table 5.) However, only about half the new elementary seats were built in districts that had a utilization rate of more than 100 percent in the 2006-2007 school year. Another large portion of the elementary seats were in districts with utilization between 90 and 100 percent, suggesting they may have been addressing concerns for future crowding. More than 3,700 elementary seats were built in districts that had relatively low utilization. These may have been targeted investments aimed at reducing crowding in particular buildings or sub-districts.
More than one-third of the new seats were built for high school students. Given the citywide nature of high school admissions and the citywide surplus of high school capacity, these seats were not necessary to address crowding.
Relatively little new capacity was built for middle school students. This is appropriate given the limited extent of crowding in these schools. Nonetheless, more than 7,000 middle school seats were built at a cost likely exceeding $700 million.21 With the large majority of these seats built in districts with low utilization these projects may have been initiated in response to pressures other than crowding.
Underutilized Alternative Strategies
The DOE has identified four strategies in addition to construction and upgrading of school buildings that can reduce crowding—rezoning, repurposing seats, changes to admission policies, and programming. These strategies are more cost effective than new construction, but are underutilized by the DOE. If used more aggressively these strategies can reduce school crowding by two-thirds and avoid the expense of much of the planned new construction.
Rezoning—Increase the Flexibility of Elementary School Zones
A major contributor to school crowding is the current zoning of elementary schools. Rezoning, or greater flexibility in the implementation of zones, could permit students in currently crowded schools to move to schools with available capacity.
Rezonings are rarely used to deal with crowding in elementary schools that are not affected by the opening of a new school building. DOE’s use of rezonings is illustrated by actions in the three school years spanning 2014-15 to 2016-17. In this period the DOE implemented 16 rezonings in 11 districts. Twelve of these were related to the zoning of a new building; in these cases the rezoning assigns future incoming students to the new schools and adjusts the zones of the pre-existing schools. In only four cases was the rezoning undertaken to adjust incoming enrollment in pre-existing schools to better accommodate students and reduce crowding; two of these involved middle schools.
Although some crowded schools are clustered within a district, many others are near a school with available capacity in the same or an adjacent district. (See Figure 1.) A more flexible system of overlapping or grouped zones could more effectively balance enrollment between nearby crowded and non-crowded elementary school buildings.
To identify the potential magnitude of crowding reductions possible through more flexible implementation of elementary school zones, crowded schools were “matched” with schools with excess capacity located within one mile of the crowded school.22 This analysis identified 19,224 seats that could be used to reduce elementary school crowding. Allowing for practical difficulties in utilizing all the seats so identified, a reasonable estimate of the additional capacity from more flexible elementary school zoning is 16,000 seats.
Rezoning is not simple or easy. It affects the lives of families, some of whom may have chosen where to live based on the school zone, and rezoning proposals often face difficulty gaining community acceptance. However, rezoning remains one of the most effective tools to reduce crowding without the expense of new construction.
Repurposing Seats
The DOE uses this term to include: (1) the reconfiguration of grades served in a school; for example, truncating a 5-8 school to a 6-8 school and expanding a K-4 school to a K-5 school; (2) moving schools from one building to another and opening new programs or schools in underutilized buildings; and (3) consolidating co-located schools. These approaches are used for a variety of situations and could be applied more frequently to relieve crowding.
In the three school years spanning 2013-14 to 2015-16 DOE approved 99 such proposals to be implemented in the 2014-15 to 2016-17 school years.23 Grade truncation and expansion accounted for 19 proposals; consolidations accounted for 12; re-siting accounted for 28; and opening new schools in existing buildings accounted for 40. In 87 of these actions, the buildings affected were underutilized; the actions were intended to benefit schools in ways other than reducing crowding. In the cases where a crowded school was involved, it is difficult to calculate the amount of crowding alleviated with the available descriptive information.
While this summary indicates the DOE is using these strategies with some effectiveness, additional analysis suggests much more could be done. Two types of repurposing with substantial potential to alleviate crowding are making unused middle school capacity available to crowded elementary schools and making more effective use of non-instructional space.
Better Use of Middle School Capacity
Middle schools suffer least from crowding; the citywide utilization rate is a relatively low 86 percent and non-crowded schools have 28,738 vacant seats. A first priority for this unused capacity should be to address crowding at over-capacity middle school buildings, which have a seat need of 4,553. For the zoned middle schools, a rezoning strategy can be applied. For choice middle schools, reducing crowding requires the cooperation of students (and their parents) who currently select to attend the crowded schools and school officials who allow enrollment to exceed building capacity.
Among the 32 school districts, 19 have one or more crowded middle school buildings with a total shortage of about 4,500 seats. In 15 of those districts underutilized middle schools have unused capacity sufficient to offset fully the need in crowded buildings. In the other four districts the unused capacity is less than the total need.
However, even in districts with sufficient middle school capacity, capacity may be separated geographically from seat need. Crowded buildings were matched with those with available capacity located within two miles of the crowded school. (This is a larger radius than that used in the elementary school analysis as middle school students are more able to travel farther to school.) This analysis identified 33 middle school buildings with available capacity within 2 miles of a crowded middle school. However, making use of a small number of available seats in a building may not be possible or practical. Considering only non-crowded buildings that could contribute at least 56 seats, or two classrooms worth of capacity, to alleviate crowding, 2,217 seats could be used to reduce middle school crowding. Allowing for other challenges in utilizing all the seats identified, 2,000 seats is a reasonable estimate of the additional middle school capacity that could be captured.
Additional unused middle school capacity could be made available to students in crowded elementary school buildings. This capacity could be used to alleviate crowding in elementary schools by reconfiguring the grades served in underutilized middle school buildings. Middle schools also could be consolidated to fully or partially vacate a building that could be converted to an elementary or K-8 school. In some middle school buildings, there already may be sufficient capacity to open a small elementary school.
A similar geographic matching analysis was conducted to match crowded elementary school buildings to middle school buildings with available space within one mile, the same radius used in the earlier analysis matching crowded and underutilized elementary schools. Seventy-two middle school buildings with available capacity are located within one mile of a crowded elementary school.
Not every available middle school seat could translate into an elementary school seat, as elementary class sizes are smaller and a new school would need administrative as well as classroom space. Considering only non-crowded buildings that could contribute at least 200 seats, the analysis identified 8,796 seats that could be used to alleviate elementary school crowding. Allowing for other challenges in making full use of this space, 7,500 is a reasonable estimate of the number of students in crowded elementary schools who could be accommodated in this fashion.
Conversion of Non-instructional Space
A portion of each building’s space is reserved for non-instructional purposes. These uses are valuable and should be retained, but some of the administrative space and space allocated to non-school uses can be converted to instructional capacity.
Of the DOE’s 1,413 buildings, 39 percent or 550 house multiple schools. Many of these multi-school buildings were created during the Bloomberg Administration when 164 low-performing schools were closed and replaced with 654 smaller schools.24 In many cases the more numerous smaller schools were in the same building as the previous larger school. One consequence of the co-located smaller schools is that the same building houses administrative and other non-instructional space for multiple schools rather than a single larger school. Where multiple schools are in the same building, the administrative space potentially could be consolidated.
Under DOE guidelines each school is allowed up to eight rooms of more than 500 square feet for administrative purposes including a duplication room, storage room, nurse’s office, and general office as well as the principal’s office. In buildings with multiple schools some of this administrative space could be shared. Based on a detailed analysis of administrative space usage as reported in the Principals Annual Space Survey, there are few buildings in which a full eight rooms of this size per school are used for administrative purposes, but there are still opportunities for conversion of excess administrative space to use as classroom capacity. Assuming a moderate amount of space sharing, a reasonable estimate of the space needed for administrative purposes is eight rooms of 500 square feet or larger for the first school in a building plus six rooms for each additional school. In 40 buildings, the number of rooms of 500 square feet or larger used for administrative purposes exceeds this number by a total of 232 rooms. These excess administrative rooms could instead provide classroom space.
Not all this added capacity would be in schools that are crowded. Among buildings with co-located schools, 33 percent are over capacity; in these cases the consolidation would directly reduce crowding.25 Sharing of administrative space in schools that are not themselves crowded can help reduce the problem because this capacity is available to relieve crowding under the strategies discussed above, including moving students to schools with available capacity. Allowing for these factors, a reasonable estimate is that half the capacity added by consolidation could effectively relieve crowding. Assuming an average capacity of 20 students per room, this yields 2,150 seats in high schools, 90 seats in middle school buildings, and 80 seats in elementary school buildings.
The second opportunity for conversion of non-instructional to classroom space relates to uses not required to be in the school buildings. This includes space used by the UFT and by DOE central or district administration. Thirty-two rooms in 26 buildings are allocated to the UFT for its activities; 15 of these rooms are 500 square feet or larger. One hundred seventy-eight rooms in 29 buildings are reserved for administrative use by either DOE central office or district staff; 69 of these rooms are 500 square feet or larger.26 These office activities could be moved to other office space rather than school buildings; using this space for classrooms would reduce crowding by about 990 seats citywide with over half the seats (500) in elementary schools, a large share (360) in high schools, and the remainder in middle schools.27
Other space also includes the rooms allocated to community organizations for services to students and their families. Location in a school may help these organizations reach their target clients, but this may be a lower priority than reducing the crowded circumstances in which these students are taught. Community organizations occupy 470 rooms in 166 school buildings; 192 of those rooms are 500 square feet or larger.28 This space could provide about 1,920 seats citywide if used as classroom space, with a large majority in elementary school buildings (1,280) and the rest divided among high school (440) and middle school (200) buildings.29
The direct impact of these conversions is not entirely in currently crowded schools. However, the new capacity can facilitate the implementation of other strategies that reduce crowding by using available space in other schools.
Changed Admission Policies—Enforcing Enrollment Caps at High Schools
One-third of the crowding problem is attributable to high schools, where 93 crowded buildings had a shortage of 31,854 seats. As previously discussed, this problem arises because the DOE allows enrollment to exceed its capacity standards in order to meet the preferences of students and parents.
This problem could be solved by capping enrollment at levels consistent with the DOE capacity standards, because adequate high school capacity exists citywide and students are selected for schools on a citywide basis. The shortage of seats in crowded high schools (31,854) is well below the unused capacity at other high schools (65,268). Many crowded high schools are desired by both students and staff. If these stakeholders are opting for a “crowded” school, then change may not be necessary or desirable. Reducing enrollment would shift teachers and students to schools they desire less.
If high school capacity caps are established, principals could be given discretion to exceed a cap, perhaps by up to 20 percent, if it does not affect pedagogical standards negatively. To the extent principals exercise this discretion, this crowding should be deemed an acceptable balance of priorities. Since citywide high school capacity is already adequate, and assuming some high schools will choose to maintain enrollment over their building capacity, changed admission policies could fully eliminate crowding at high schools.
Programming
The predominant practice under this strategy is “split session” schedules at high schools. These schedules extend the school day through some combination of starting earlier and ending later than traditional schedules. The extended day allows more than the traditional eight periods to be scheduled during the school day. Students are scheduled for different starting times and classrooms can accommodate more students because they are used for more time during the day. Crowding may still occur during the middle of the school day when all students are present, but this is less acute because students may be in lunch periods or other non-classroom activities during these periods. The capacity increase related to split sessions is difficult to calculate because of the varying schedules and lack of full-day impact, but a rough calculation is that adding one period increases capacity by about one-eighth or 12.5 percent.
In the 2017-18 school year, 42 high schools in 41 buildings used a split session schedule. All these schools had utilization above 100 percent, but their rates varied from 101 percent to 208 percent.30 These 41 schools are a minority of the 93 high school buildings that had rates above 100 percent. No clear or firm decision rule appears to determine which crowded schools adopt split session schedules, but it is a technique used by popular high schools to accommodate students beyond their official capacity. For example, Bronx High School of Science and Brooklyn Technical High School each use a split session schedule.
Using a split session schedule does not increase capacity according the DOE’s official calculation of capacity. Accordingly in this report no increased capacity is assigned to this strategy, and it would not be necessary to adopt split sessions if the previous strategy of new admission policies were adopted. However split sessions are a method by which, under new admission policies with some discretion for admission caps, more students could be accepted at the more popular high schools.
Summary of Impacts
Table 6 summarizes the impact of the cost-effective strategies on the shortage of seats:
- Increased flexibility in elementary school zones could reduce the shortage at elementary schools by 16,000 seats;
- Using middle school space has two impacts. It could accommodate 2,000 students at currently crowded middle school buildings through changes to middle school zoning or admissions and provide 7,500 elementary seats through new elementary or K-8 schools in the remaining underutilized middle school buildings;
- Capping high school enrollment, applied with discretion for local officials to exceed caps as discussed above, could eliminate high school crowding; and
- The conversion of space from non-instructional to classroom use could add significant additional capacity: 2,950 seats at high school buildings, 420 seats at middle school buildings, and 1,860 seats at elementary school buildings.
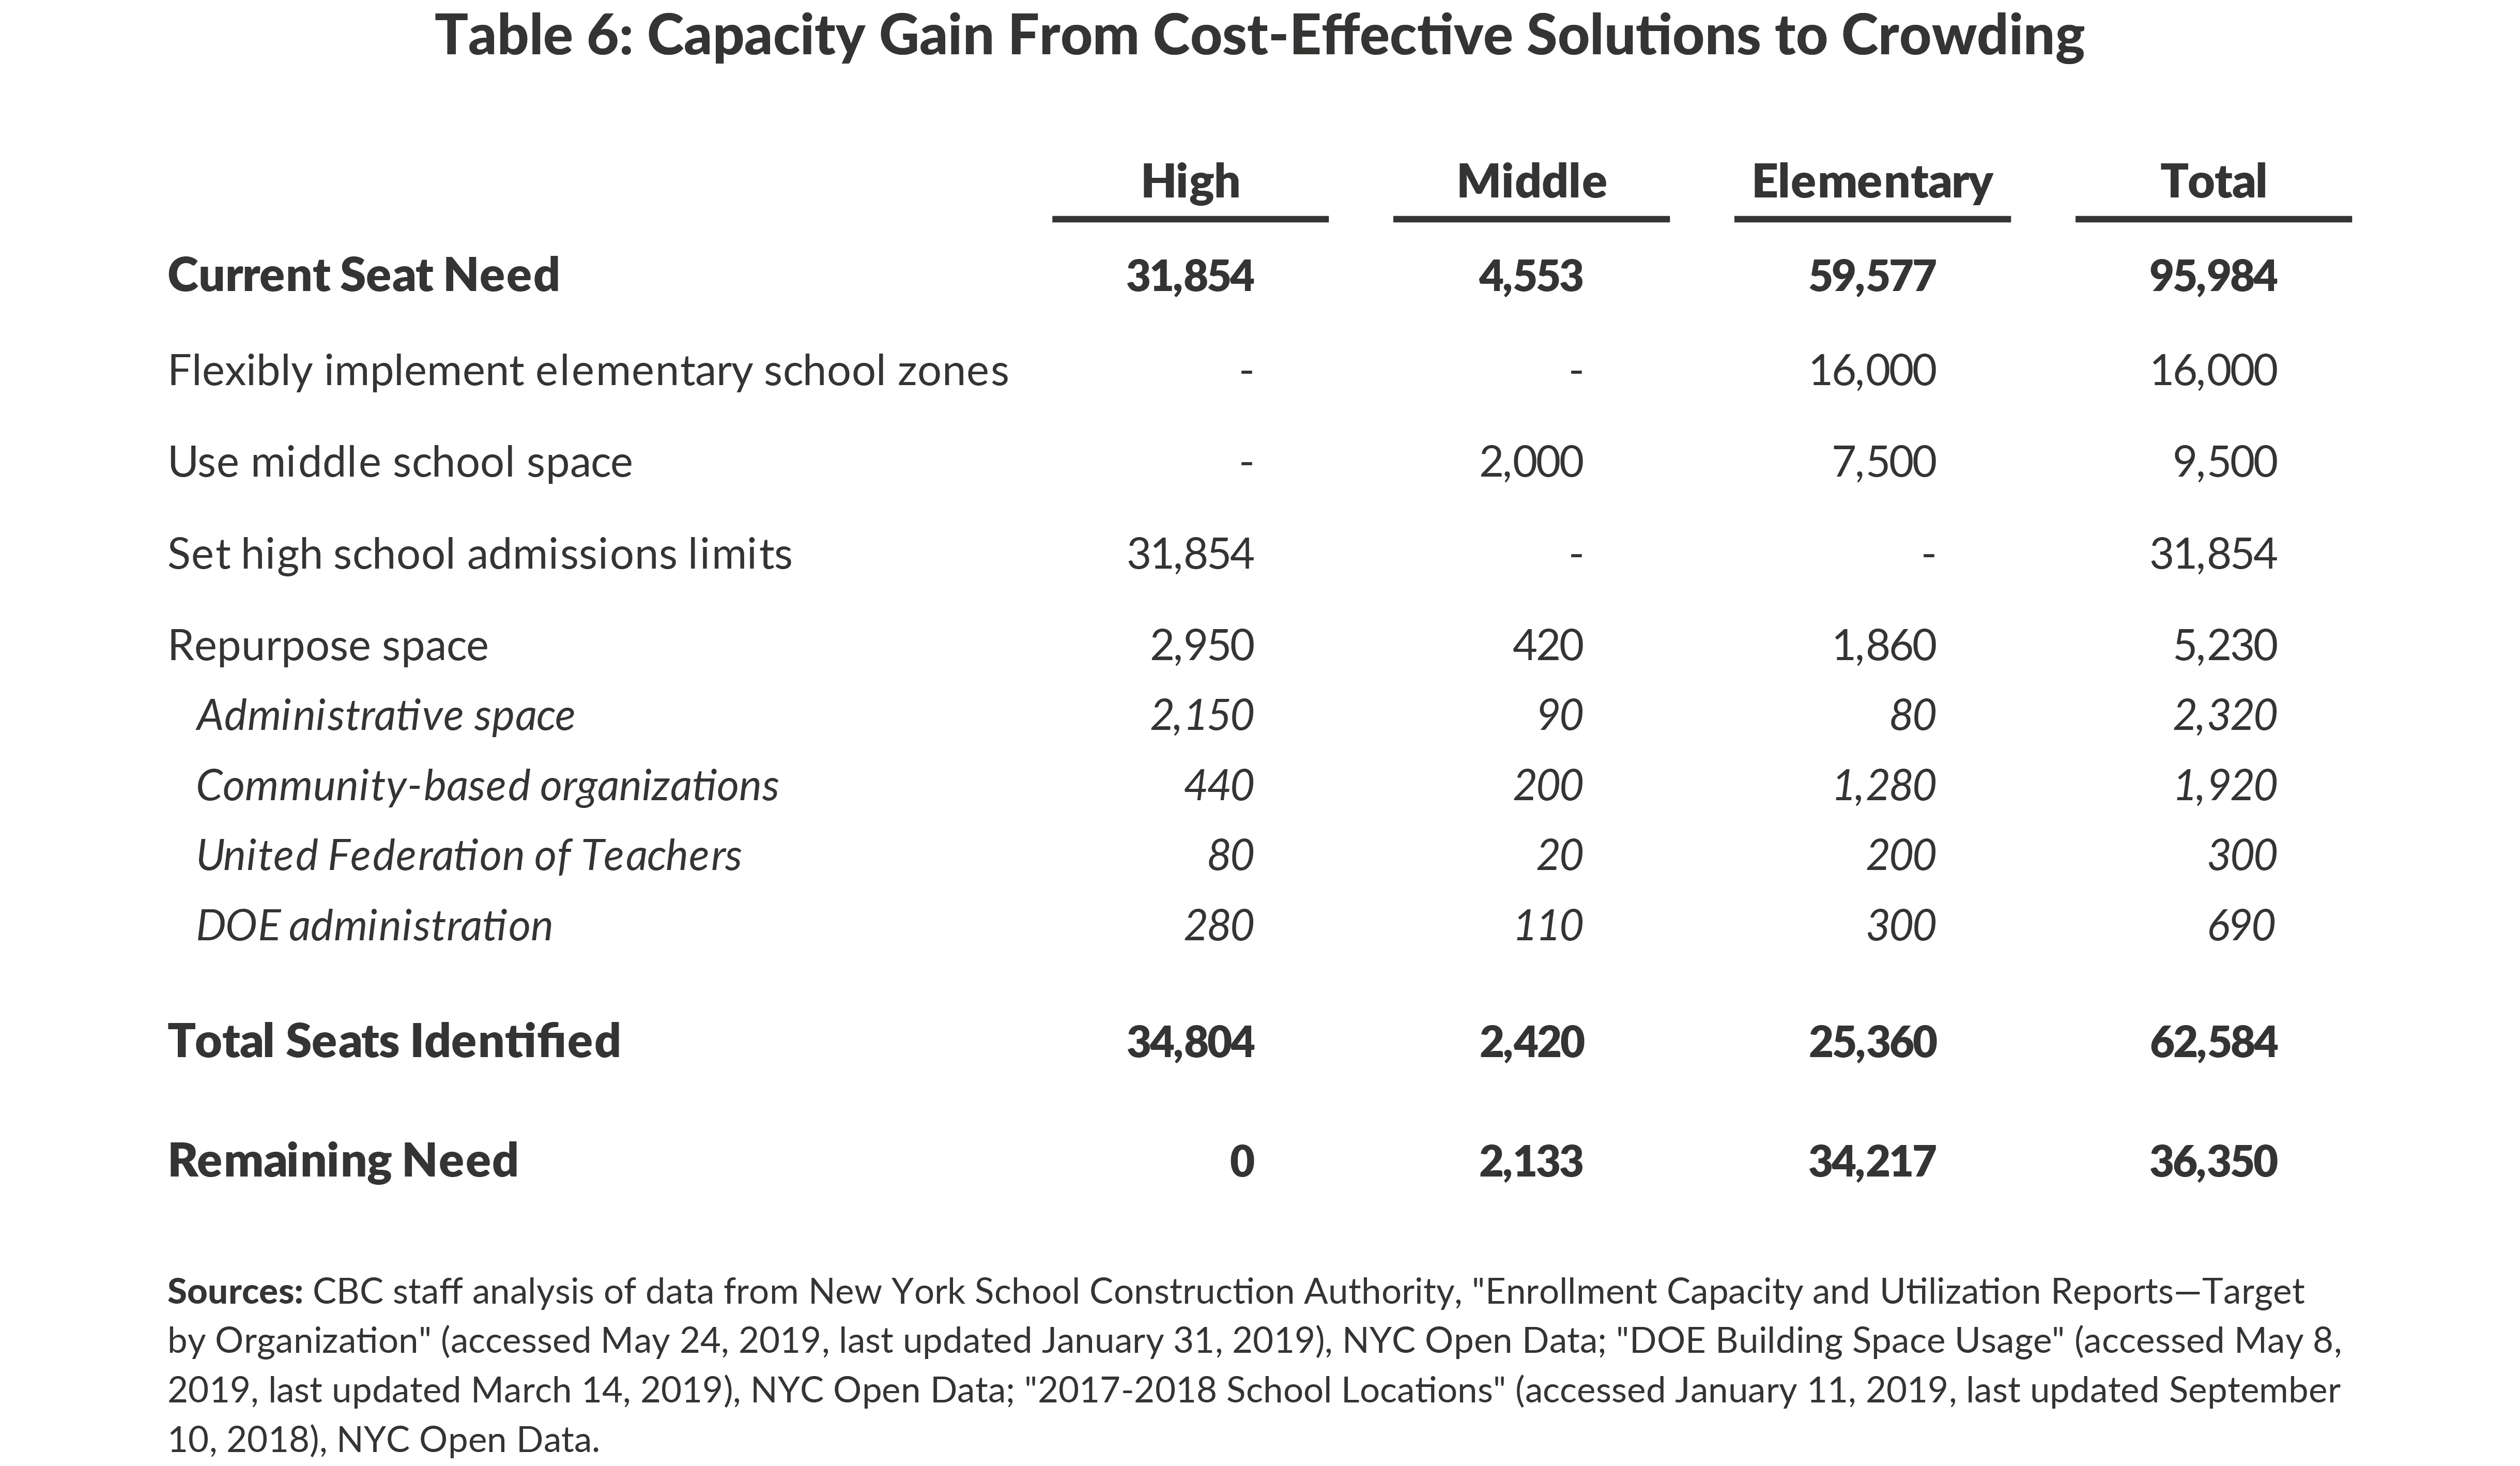
Together, these strategies can eliminate the current seat need at high schools, reduce the middle school need to about 2,100, and reduce the seat need at elementary schools to about 34,000. The strategies identify more high school seats than are needed, but these may not be easily interchangeable with elementary school seats, so the remaining need in Table 6 reflects the full remaining need at middle school and elementary school buildings.
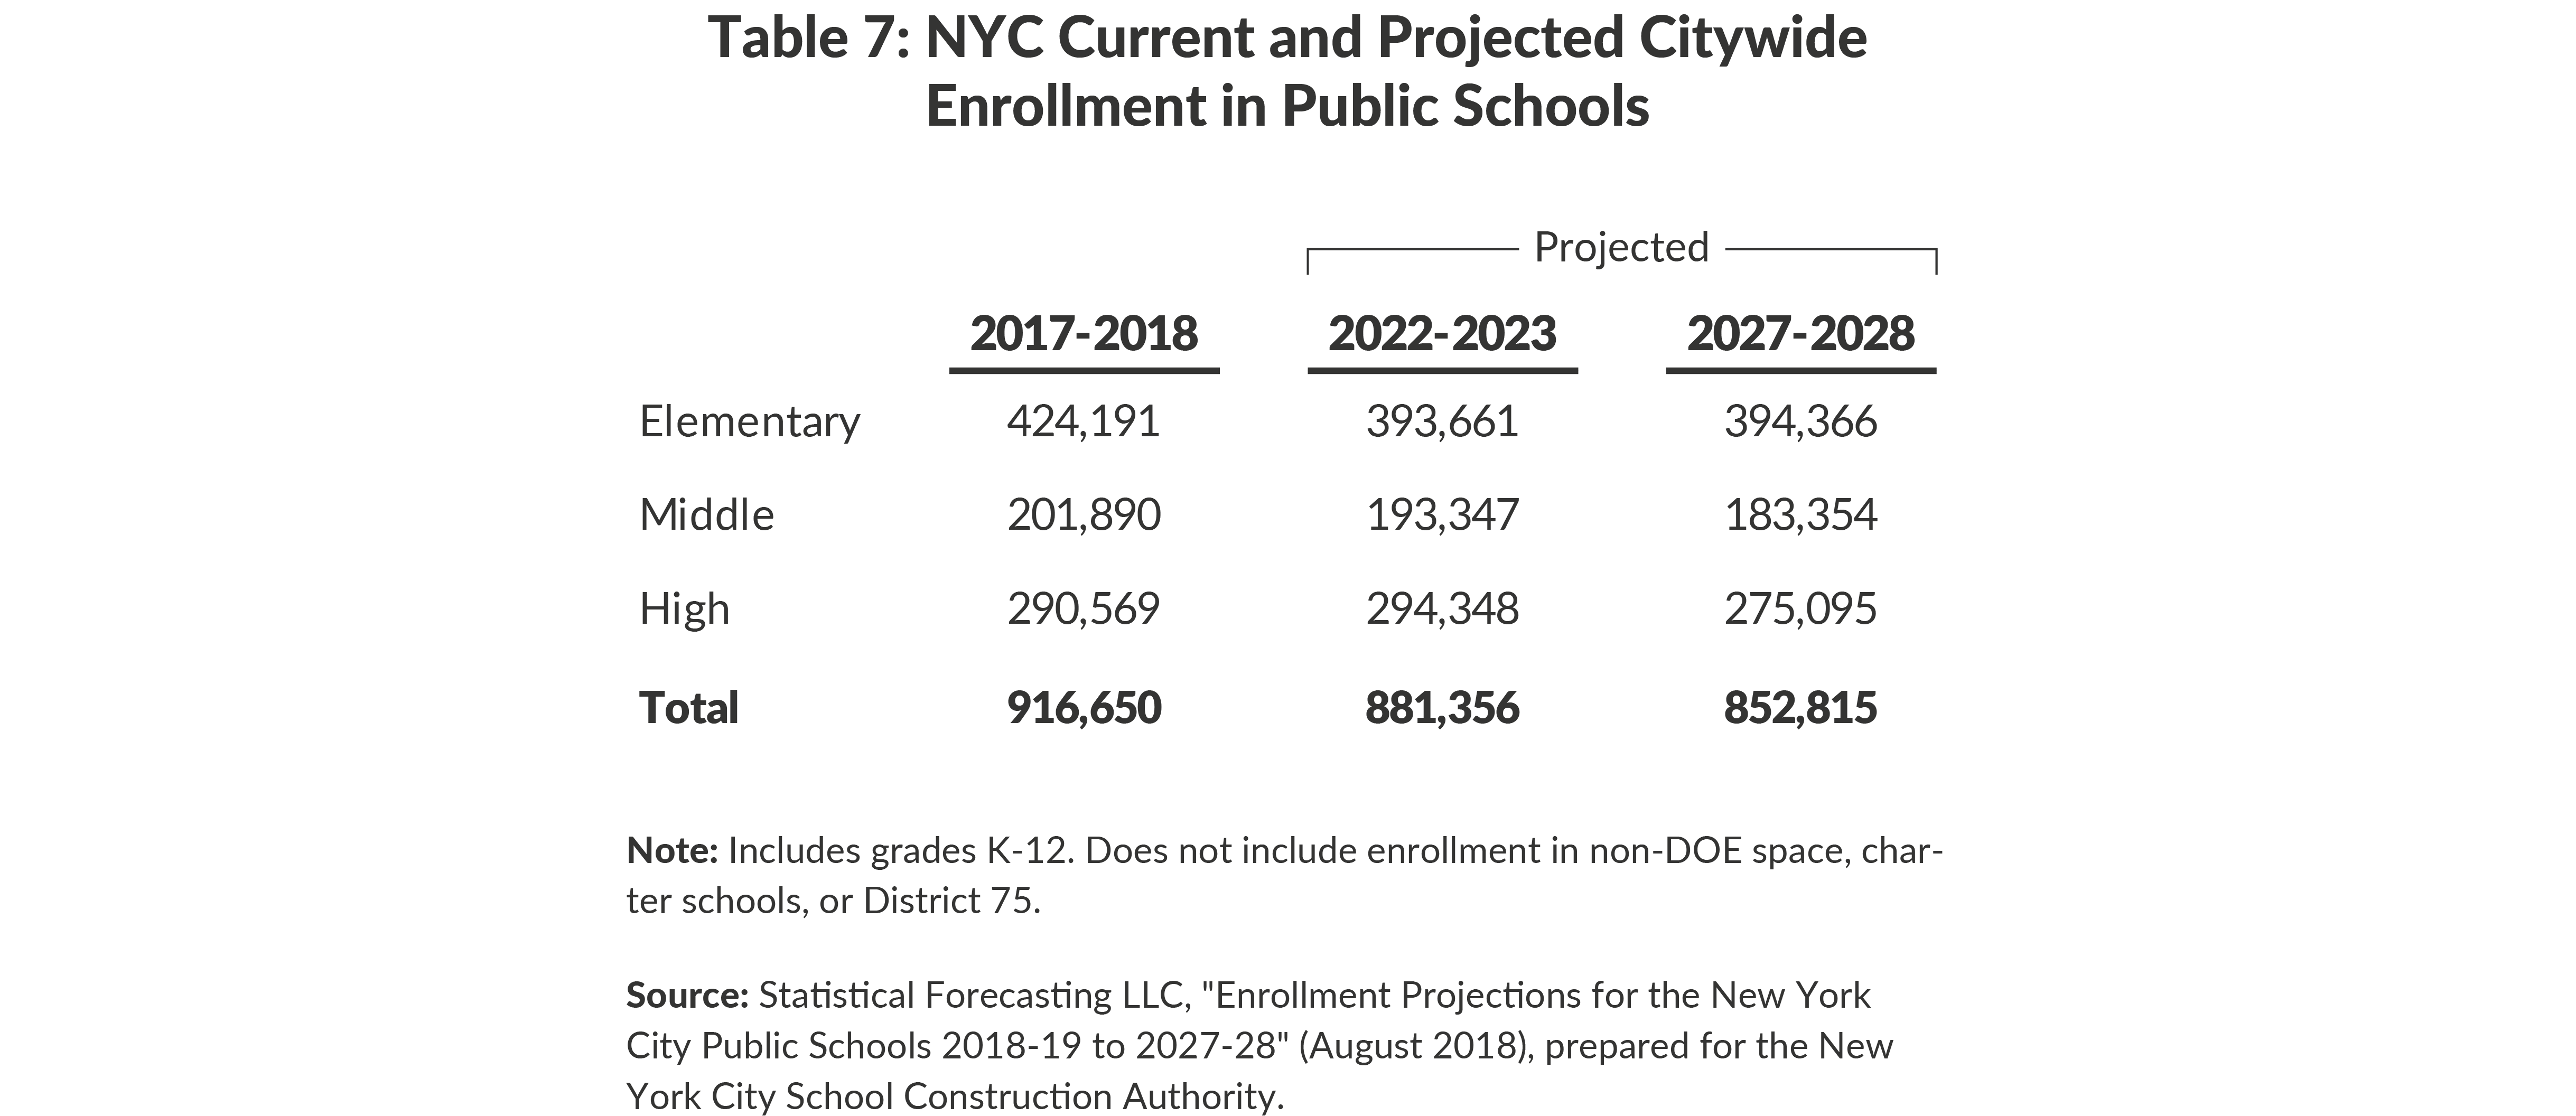
As the current capital plan is completed and projected enrollment declines, the current level of crowding may lessen. By 2022 20,488 seats in the current capital plan still in design or construction are slated to be completed. Furthermore, the DOE’s enrollment projections forecast a decline of 4 percent of total enrollment including 7 percent in elementary school enrollment from the 2017-2018 school year to the 2022-2023 school year. (See Table 7.) Taking into account these dynamic factors could further reduce the need for new seats.
Saving in the Capital Plan
The DOE’s capital plan for fiscal years 2020-2024 totals $17 billion. Of this nearly $8.3 billion is for purposes other than creating new capacity, such as repairing and enhancing existing buildings ($5.2 billion) and conforming to legal mandates relating to environmental and other concerns ($3.1 billion). The greatest amount, nearly $8.8 billion, is for capacity projects, with nearly $7.9 billion for new K-12 capacity and the other funds for projects that deal with space for pre-K programs, expanded space at existing schools, and removal of TCUs. The $7.9 billion in new capacity funding includes $6.4 billion that is allocated for specific new buildings, $1.1 billion for site acquisition and environmental remediation citywide, and an unspecified allocation of $329 million.31
Table 8 shows the allocation of the $6.4 billion by school level and district crowding status (for elementary seats). Five new high schools account for $966 million and add 8,164 seats. If new admission policies were designed and enforced, these new buildings would not be needed to reduce crowding.
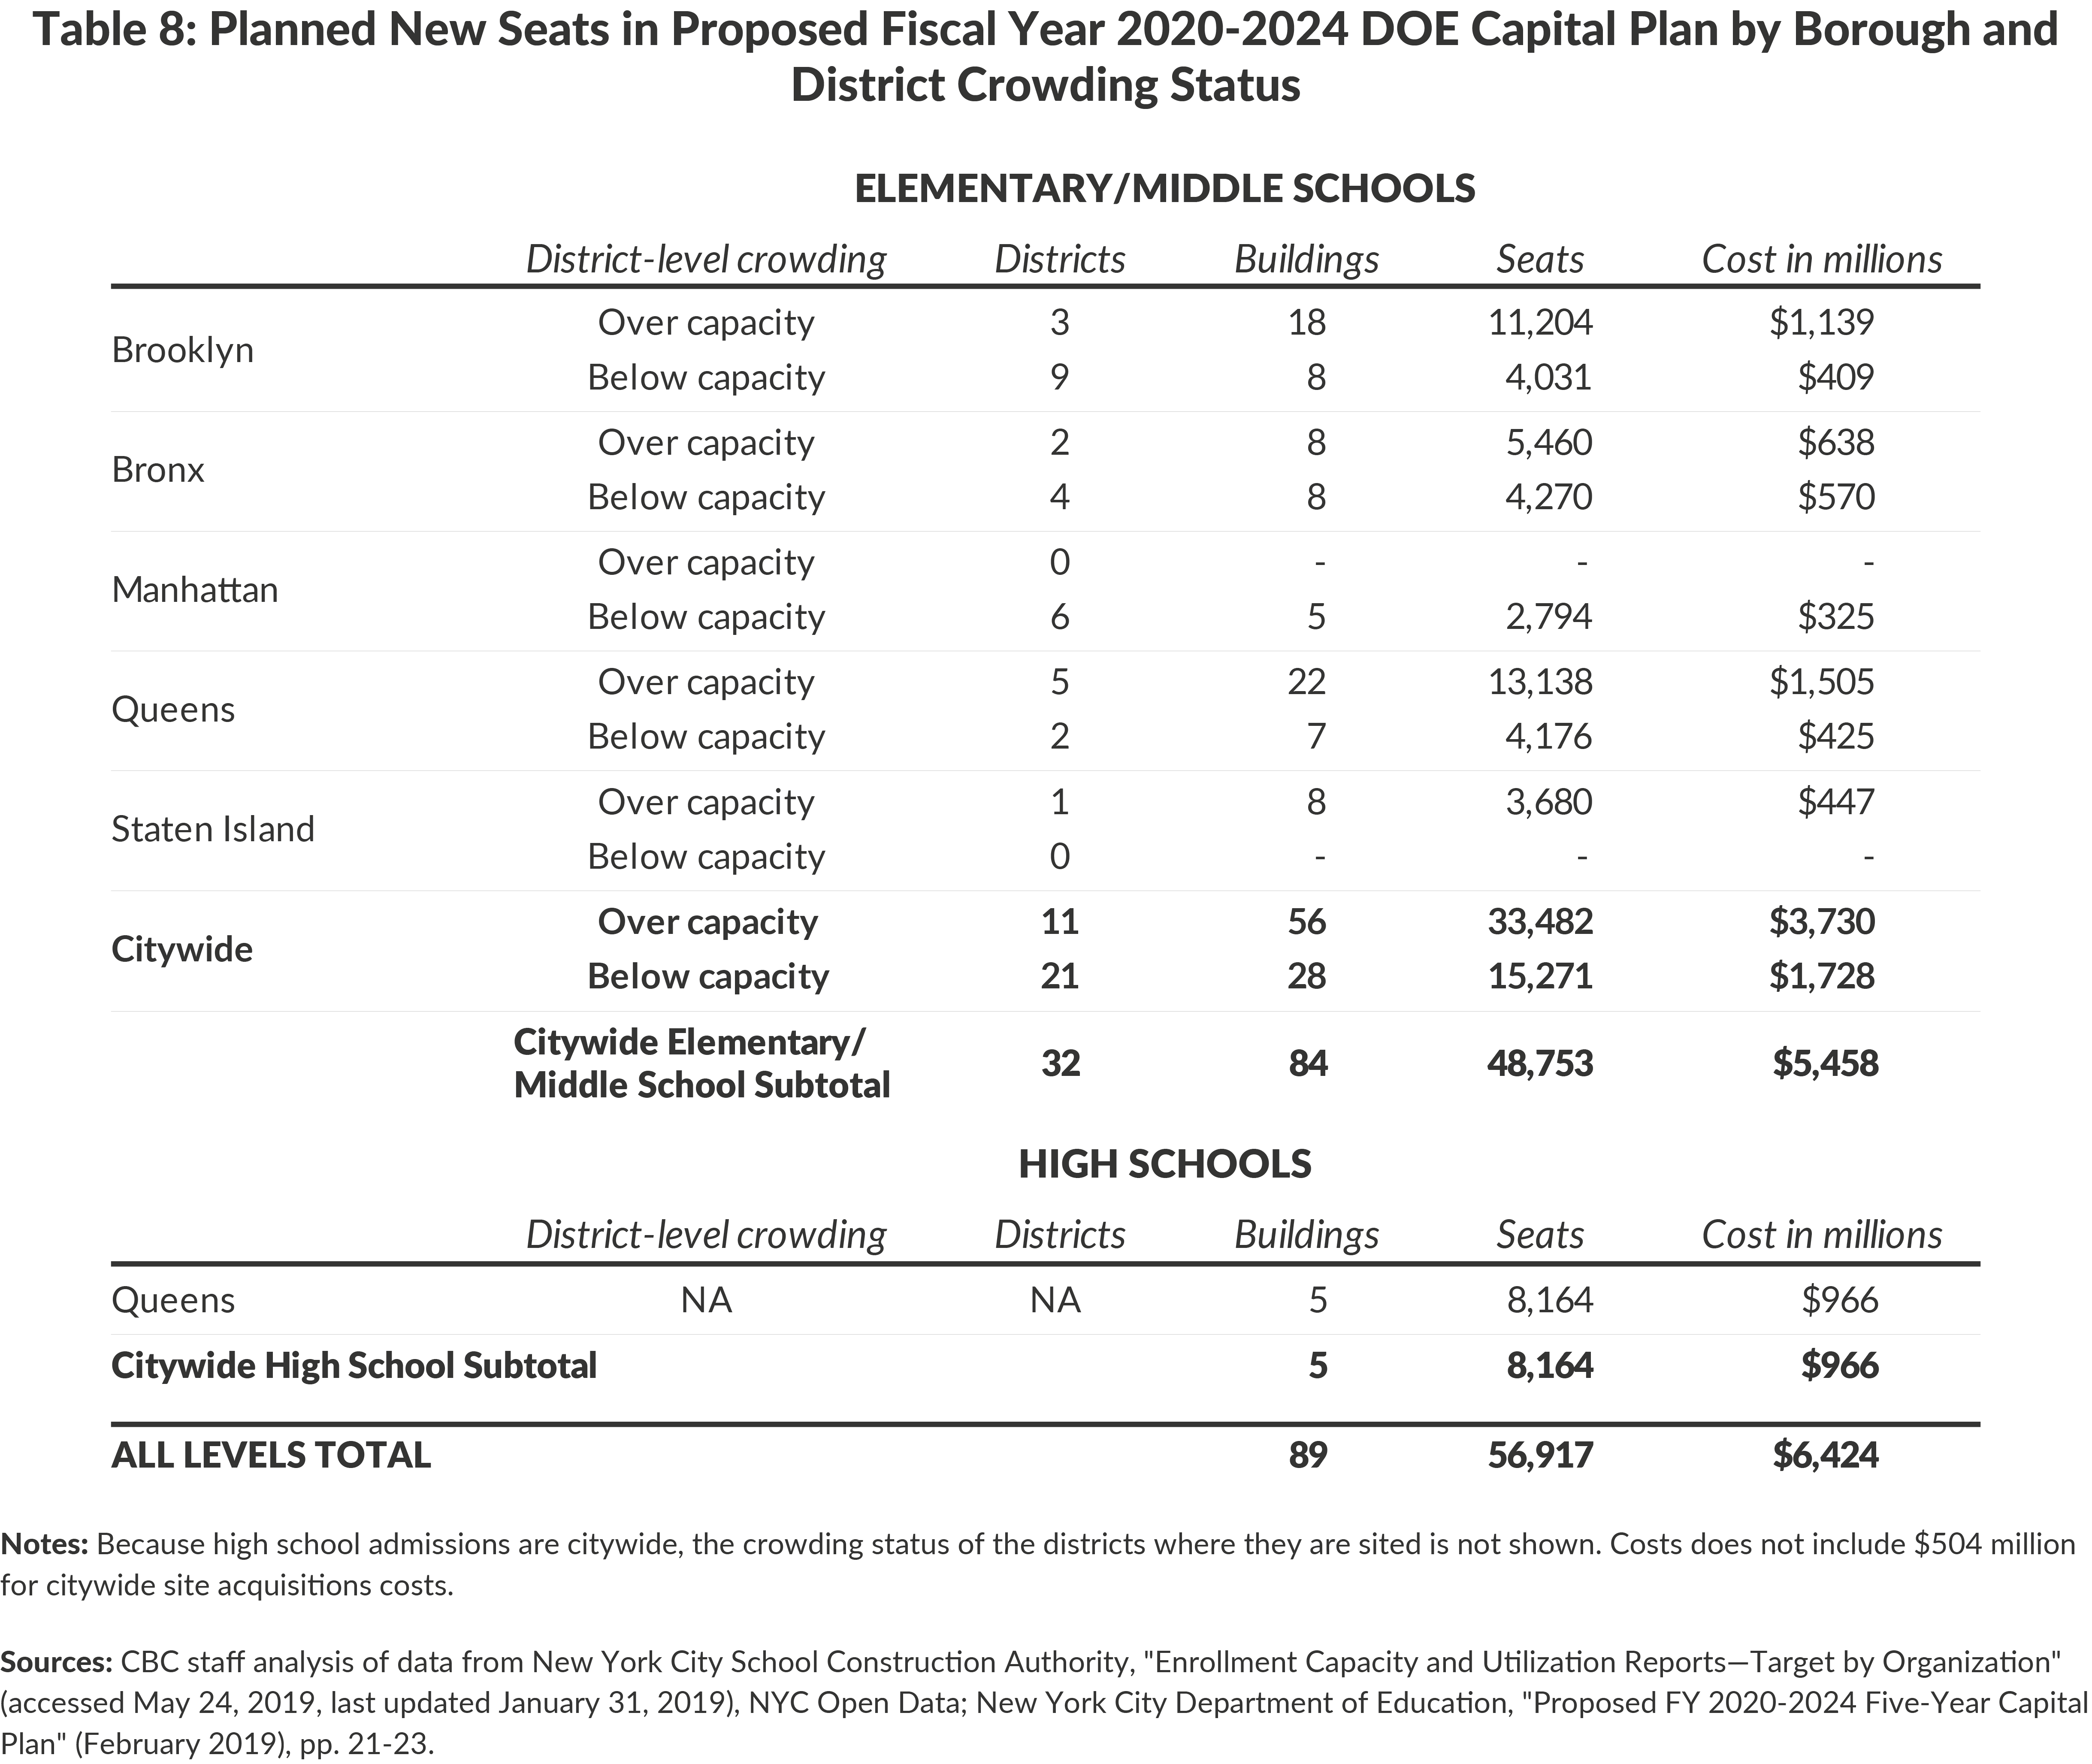
The remaining new capacity projects are 84 new schools of which 47 are elementary school buildings limited to grades K-5 and 37 are larger buildings with flexible space not yet designated for specific grades between pre-K and grade 8. The combined capacity of these new buildings is 48,753 seats.
Some of these new elementary school buildings may be intended to serve goals other than reducing crowding. The 84 projects are located in 22 of the 32 school districts. Of these 22 districts, 11 are districts in which total enrollment currently exceeds capacity; the 56 projects in these districts provide 33,482 new seats at a cost of $3.7 billion. The remaining 11 districts with planned new seats currently have unused capacity; the 28 projects in these districts add 15,271 seats at a cost of $1.7 billion. Some of the latter projects may be related to situations at specific schools in those districts that are crowded.
As discussed above, implementation of the four cost-effective strategies could reduce the combined middle school and elementary school need to about 36,000 seats, a 25 percent reduction in the capital plan of 48,753 seats. Applied to the cost of the new elementary school buildings in the plan ($5.5 billion), this could yield savings of $1.4 billion. Combined with the $966 million saved by not building high school seats, the total reduction in the planned fiscal year 2020 to 2024 capital plan could reach $2.4 billion. The previously noted projected enrollment decline and projects currently underway to expand capacity could further reduce the need for new capital investment and yield significant additional savings.
These savings could be put to productive use. Within the capital plan, more funds could be allocated to improvements and enhancements in existing buildings in order to bring them to a state of good repair more rapidly than in the existing plan. Alternatively, the funds in the operating budget necessary to pay the debt service on the bonds planned for this new capacity could be reallocated to the DOE’s operating budget to improve instruction with added staffing or other measures. The debt service on $2.4 billion would be roughly $150 million a year.32 Because approximately half of the DOE’s capital spending is reimbursed by State building aid, the City would save $75 million and the State an equal amount.33
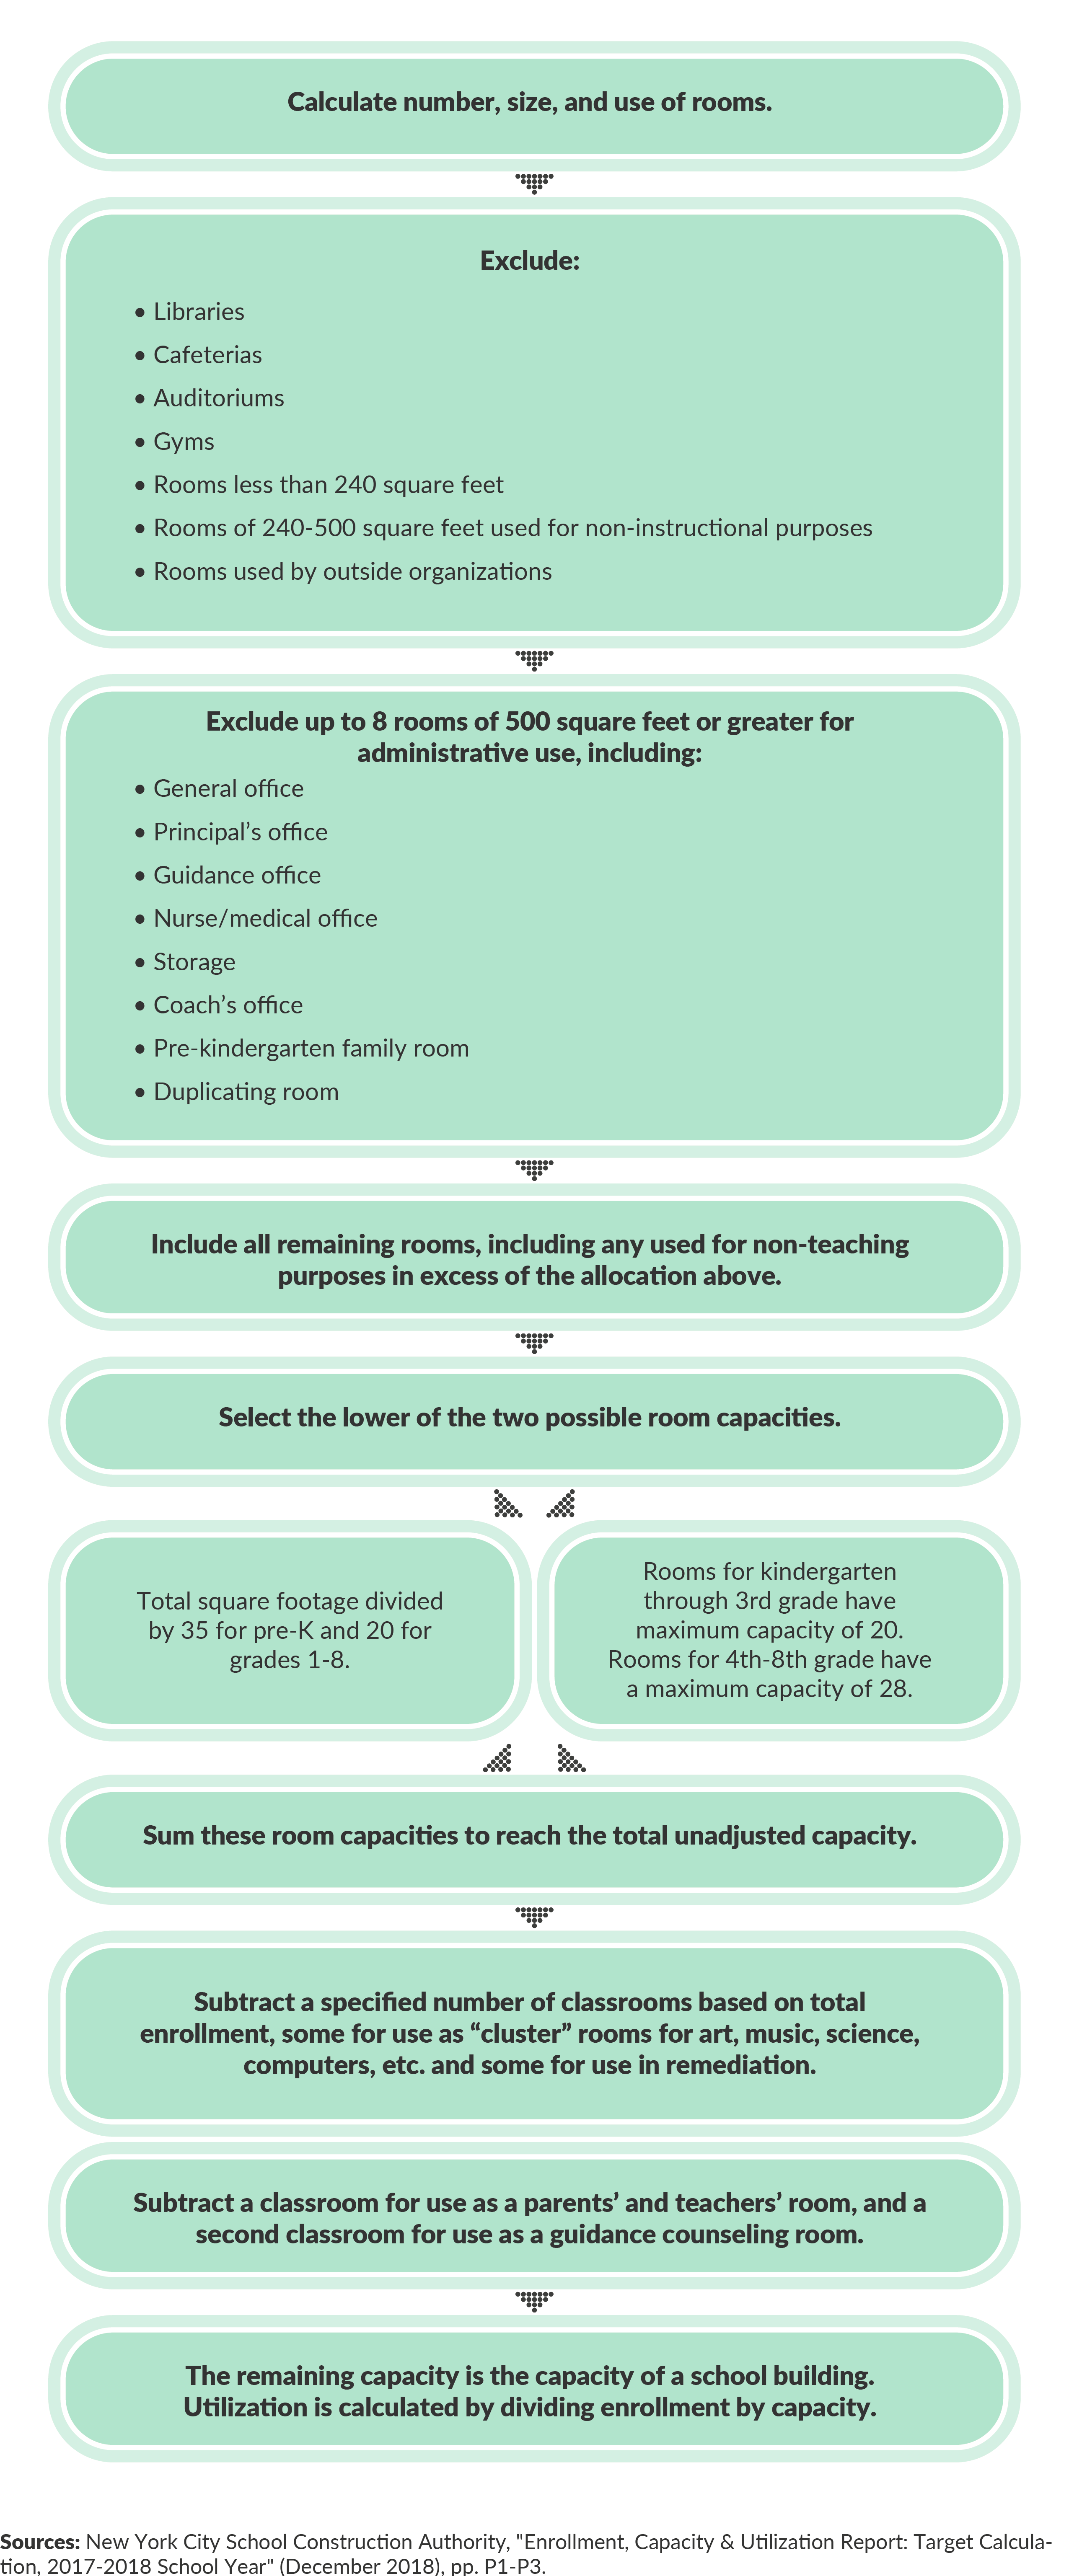
Appendix A: School Capacity Formula for Primary Schools
This flow chart illustrates a simplified version of the formula used to calculate capacity of primary schools, according to the 2017-2018 Enrollment, Capacity & Utilization Report.
Download Report
Cut Costs, Not Ribbons: Alternatives That Reduce School CrowdingFootnotes
- Changes in the methodology for calculating capacity make it difficult to compare capacity or utilization figures from before school year 2013-2014 directly to those from after 2014-2015.
- CBC staff analysis of data from New York City Department of Education, “2015-2018 Demographic Snapshot Pre-K For All” (accessed March 22, 2019, last updated September 10, 2018), New York City Open Data, https://data.cityofnewyork.us/Education/2015-2018-Demographic-Snapshot-Pre-K-For-All/u4g8-wkku.
- These figures include all enrollment in DOE space, including enrollment in charter schools in DOE buildings. Charter schools located in non-DOE space are not included in enrollment or capacity figures throughout the paper. See: CBC staff analysis of data from New York City School Construction Authority, “Enrollment Capacity and Utilization Reports—Target by Organization” (accessed May 24, 2019, last updated January 31, 2019), NYC Open Data, https://data.cityofnewyork.us/Education/Enrollment-Capacity-And-Utilization-Reports-Target/gkd7-3vk7.
- CBC staff analysis of data from Department of Education, “2017-2018 Diversity Report: Admissions Methods” (accessed May 29, 2019, last updated April 19, 2019), NYC Open Data, https://data.cityofnewyork.us/Education/2017-2018-Diversity-Report-Admission-Methods/d9fi-geci.
- Includes middle school admissions at K-8 schools, K-12 schools, middle schools, and secondary schools (grades 6-12). Dataset includes a total of 485 schools at these levels.
- Includes high school admissions at K-12 schools, high schools, and secondary schools (grades 6-12). Dataset includes a total of 423 schools at these levels. This does not correspond to the number of high school buildings, as buildings may contain multiple schools and schools may be located in multiple buildings. CBC staff analysis of data from Department of Education, “2017-2018 Diversity Report: Admissions Methods” (accessed May 29, 2019, last updated April 19, 2019), NYC Open Data, https://data.cityofnewyork.us/Education/2017-2018-Diversity-Report-Admission-Methods/d9fi-geci.
- This includes buildings categorized as elementary (K-5), early childhood (Pre-K or K through grade 2 or 3), and K-8. Buildings housing multiple schools were categorized based on the schools that made up the largest total enrollment in the building.
- CBC staff analysis of data from New York City School Construction Authority, “Enrollment Capacity and Utilization Reports—Target by Organization” (accessed May 24, 2019, last updated January 31, 2019), NYC Open Data, https://data.cityofnewyork.us/Education/Enrollment-Capacity-And-Utilization-Reports-Target/gkd7-3vk7.
- CBC staff analysis of data from Department of Education, “2017-2018 Diversity Report: Admissions Methods”(accessed May 29, 2019, last updated April 19, 2019), NYC Open Data, https://data.cityofnewyork.us/Education/2017-2018-Diversity-Report-Admission-Methods/d9fi-geci; and New York City School Construction Authority, “Enrollment Capacity and Utilization Reports—Target by Organization” (accessed May 24, 2019, last updated January 31, 2019), NYC Open Data, https://data.cityofnewyork.us/Education/Enrollment-Capacity-And-Utilization-Reports-Target/gkd7-3vk7.
- In considering the relatively modest degree of crowding among middle school buildings, it is relevant to recall that this analysis classifies buildings with some enrollment from middle school grades combined with elementary or high school grades in the latter categories; this reduces the middle school grade enrollment categorized as in middle school buildings and places some of that enrollment in buildings classified as elementary or high school. CBC staff analysis of data from New York City School Construction Authority, “Enrollment Capacity and Utilization Reports—Target by Organization” (accessed May 24, 2019, last updated January 31, 2019), NYC Open Data, https://data.cityofnewyork.us/Education/Enrollment-Capacity-And-Utilization-Reports-Target/gkd7-3vk7.
- CBC staff analysis of data from New York City School Construction Authority, “Enrollment Capacity and Utilization Reports—Target by Organization” (accessed May 24, 2019, last updated January 31, 2019), NYC Open Data, https://data.cityofnewyork.us/Education/Enrollment-Capacity-And-Utilization-Reports-Target/gkd7-3vk7.
- Total capacity figure of $13.8 billion does not include $535 million for charter school seats. The 2005-2009 plan totaled $12.9 billion, with $4.12 billion for new capacity and $224 million for replacement capacity. The 2010-2014 plan totaled $11.0 billion, with $3.05 billion for new capacity and $457 million for replacement. As of October 2018, the 2015-2019 plan totals $16.5 billion, with $5.29 billion for new seats, $490 million in funding for class size reduction projects, $872 million for Pre-K for All capacity, and $287 million for replacing seats.
- In addition to the $13.8 billion committed for new seats, $968 million has been committed to replacing space lost due to building closures or nonrenewal of leases. This is not included in Figures 2 and 3.
- This does not include replacement seats built when school leases expire or are not renewed. It also excludes 9,570 seats built in charter and partnership schools ($535 million in the 2005-2009 and 2010-2014 plans), partially funded by outside organizations.
- New York City Department of Education, “Proposed FY 2020-2024 Five-Year Capital Plan” (February 2019), pp. 16-17, www.nycsca.org/Community/Capital-Plan-Reports-Data#Capital-Plan-67.
- New York City Department of Education, “Proposed FY 2020-2024 Five-Year Capital Plan” (February 2019), pp. 17-22, www.nycsca.org/Community/Capital-Plan-Reports-Data#Capital-Plan-67.
- CBC staff analysis of data from New York City Mayor's Office of Operations, Mayor's Management Report (September 2018), p. 228, https://www1.nyc.gov/assets/operations/downloads/pdf/mmr2018/2018_mmr.pdf, and September 2008-2017 editions; and Engineering News-Record, "New York City Building Cost Index" (accessed November 2018), www.enr.com/economics.
- For example, the SCA seeks sites of at least 20,000 square feet, away from major roads, and not near buildings with an incompatible use. See New York City Council, “Planning to Learn: The School Building Challenge” (March 2018), p. 43, https://council.nyc.gov/land-use/wp-content/uploads/sites/53/2018/03/Planning-to-Learn-3.16.2018-high-resolution.pdf.
- See New York City Council, “Planning to Learn: The School Building Challenge” (March 2018), p. 43, https://council.nyc.gov/land-use/wp-content/uploads/sites/53/2018/03/Planning-to-Learn-3.16.2018-high-resolution.pdf.
- CBC staff analysis of data of capacity projects from New York City Department of Education, “Proposed FY 2015-2019 Five-Year Capital Plan Amendment” (February 2018), pp. C7-C11, www.nycsca.org/Community/Capital-Plan-Reports-Data#Capital-Plan-67.
- This assumes a cost per seat of $100,000, near the average for this period. (See Table 4.)
- GIS software was used to create a distance matrix of elementary school buildings. Only matches of crowded buildings to underutilized buildings within one mile were retained. Matches across borough lines between Brooklyn and Queens and between Manhattan and the Bronx were retained, as were matches across district lines within boroughs. Enrollment in excess of building capacity (seat need) was distributed to the nearest underutilized elementary school building match, with remaining seat need and available seats updated to reflect seats used. Seat need was then distributed to the second through fifth matches.
- This total excludes proposals to close schools.
- Dennis Walcott, Testimony Before the New York City Council Committee on Education (October 2, 2013), www.chalkbeat.org/posts/ny/2013/10/02/the-bloomberg-administrations-theory-of-school-improvement-in-a-nutshell/.
- CBC staff analysis of data from New York City School Construction Authority, “Enrollment Capacity and Utilization Reports—Target by Organization” (accessed May 24, 2019, last updated January 31, 2019), NYC Open Data, https://data.cityofnewyork.us/Education/Enrollment-Capacity-And-Utilization-Reports-Target/gkd7-3vk7.
- CBC staff analysis of data from New York City School Construction Authority, “DOE Building Space Usage” (accessed May 8, 2019, last updated March 14, 2019), NYC Open Data, https://data.cityofnewyork.us/Education/DOE-Building-Space-Usage/wavz-fkw8.
- These estimates assume an average capacity of 20 students per room, with half of the rooms used by the DOE and UFT over 500 square feet available to reduce crowding.
- CBC staff analysis of data from New York City School Construction Authority, “DOE Building Space Usage” (accessed May 8, 2019, last updated March 14, 2019), NYC Open Data, https://data.cityofnewyork.us/Education/DOE-Building-Space-Usage/wavz-fkw8.
- These estimates assume an average capacity of 20 students per room, with half of the rooms used by community-based organizations over 500 square feet available to reduce crowding.
- Francis Lewis High School’s utilization rate is 208 percent. It is the only building over 200 percent. See: New York City Department of Education, Office of District Planning, “Space Overutilization in New York City Public Schools: Report on the 2017-2018 School Year” (April 19, 2019), www.schools.nyc.gov/about-us/school-planning/district-planning.
- New York City Department of Education, “Proposed FY 2020-2024 Five-Year Capital Plan” (February 2019), pp. 15-24, www.nycsca.org/Community/Capital-Plan-Reports-Data#Capital-Plan-67.
- Debt service payments are estimated to be repaid as level payments over 30 years at a 4.5 percent interest rate.
- If the funds were redirected to capital improvements of existing buildings, they would remain eligible for State reimbursement. See: New York City Independent Budget Office, “The School Construction Budget: Seeming Decline in State Funding a Matter of Fiscal Reporting, Not Support” (May 2015), p. 1, https://ibo.nyc.ny.us/iboreports/school-construction-budget-seeming-decline-state-funding-matter-of-fiscal-reporting-not-support.pdf.