Fiscal Challenges Facing the New York City Health and Hospitals Corporation
Introduction
The New York City Health and Hospitals Corporation (HHC) is a public benefit corporation created in 1969 to manage more efficiently municipal hospitals and other health facilities. Currently more than one million patients annually receive care at HHC facilities and nearly 468,000 are enrolled in MetroPlus, the managed care insurance plan HHC launched in 1985.1
HHC plays a vital role in providing essential health care services to the most vulnerable New Yorkers. In calendar year 2011, the most recent available data, HHC hospitals discharged 210,296 patients, or 18 percent of the citywide total; discharges of uninsured and Medicaid patients from HHC’s hospitals comprised 45 percent and 26 percent of the citywide total, respectively.2 HHC hospitals also play a significant role in providing behavioral health services, operating 48 percent of all certified psychiatric beds in New York City.3
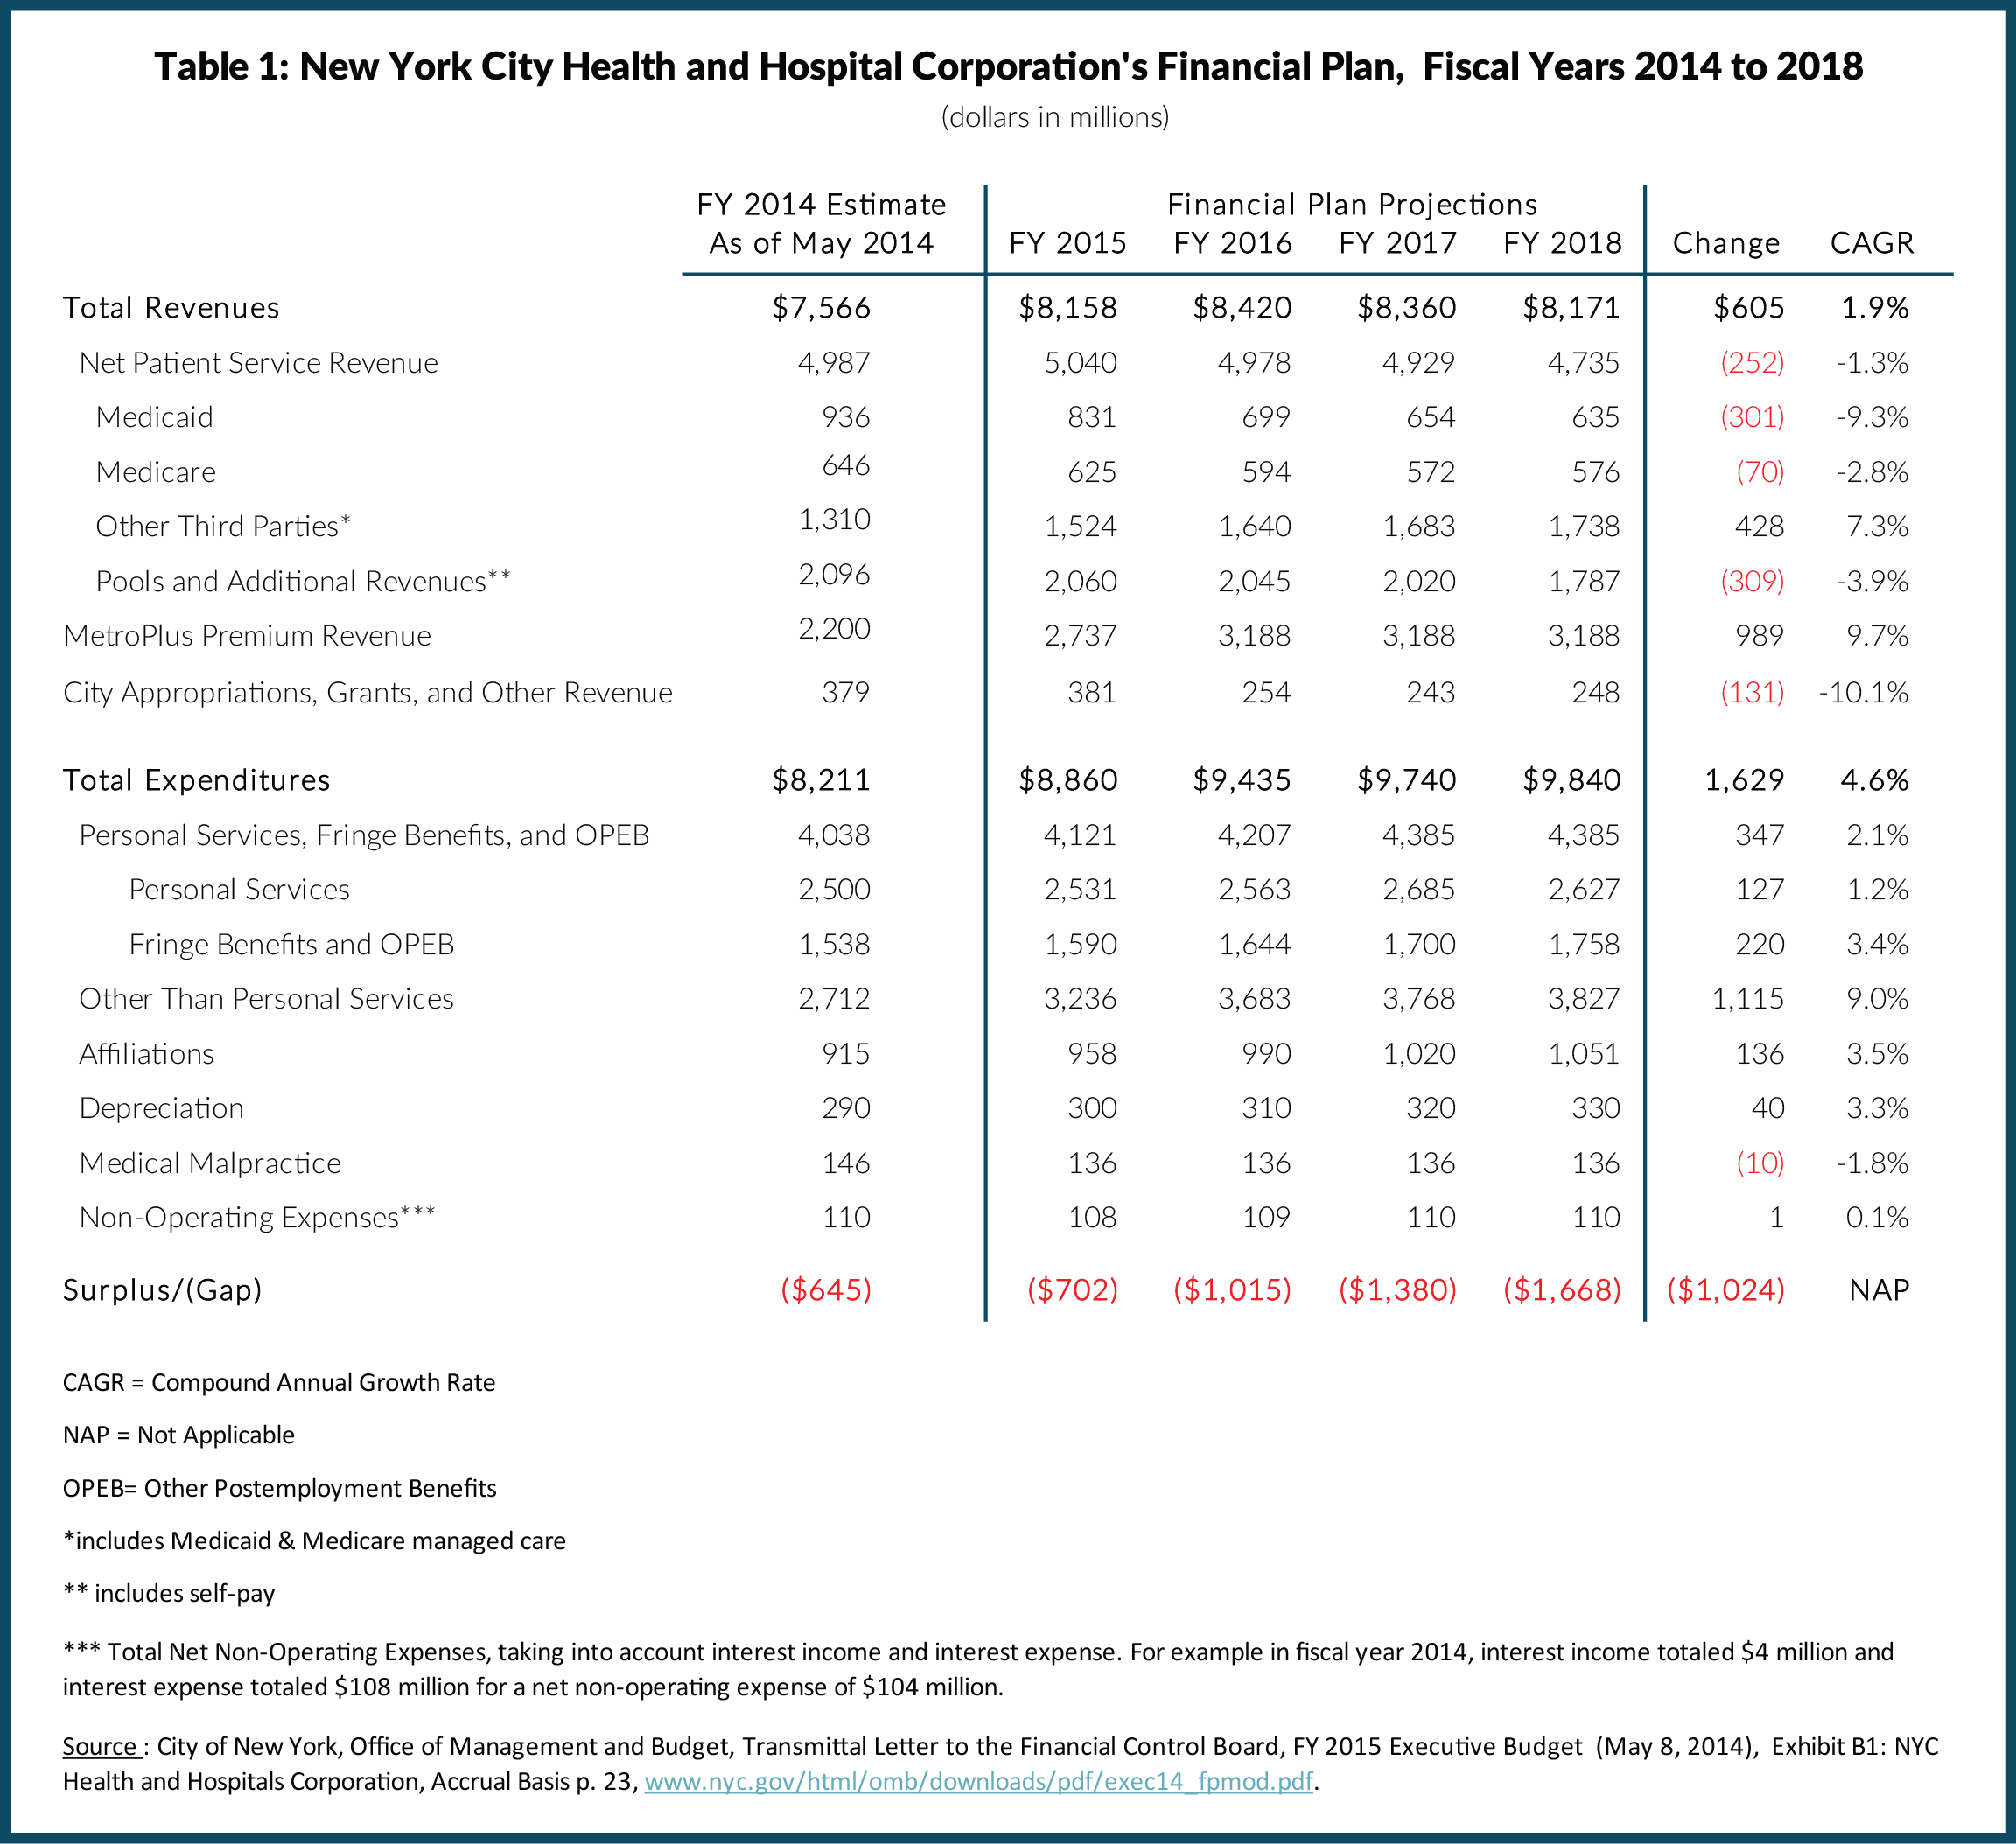
Despite its importance, HHC’s financial picture is troubled. In fiscal year 2013, HHC ran a deficit of $668 million; final numbers for fiscal year 2014 have not been released, but the estimated deficit is $645 million. In future years the imbalance between revenues and expenditures is expected to worsen with budget gaps growing from $702 million in fiscal year 2015 to $1.7 billion in fiscal year 2018. HHC’s cash resources are being depleted, and absent an aggressive gap-closing plan its cash reserves will be exhausted in fiscal year 2016.4
This policy brief reviews HHC’s current financial plan and discusses key challenges ahead for City leaders as they update HHC’s budget and financial plan to reflect evolving conditions. The brief discusses four major challenges:
- Implementing cost controls and the associated restructuring critical to HHC’s financial plan;
- Managing MetroPlus to grow enrollment and maximize returns;
- Addressing the financial burden of caring for a large population of uninsured residents, including undocumented immigrants, in the face of declining supplemental federal Medicaid funds that help offset the cost of this care; and,
- Developing a rational financial relationship with New York City to incentivize greater efficiencies and help fulfill HHC’s mission and mandates.
The Fiscal Outlook
HHC is required to submit and update an annual budget and four-year financial plan to the New York State Financial Control Board. In May 2014 it provided an updated budget for fiscal year 2014 (HHC’s fiscal year is the same as New York City’s—from July 1 to June 30), and financial plan for the fiscal years 2014-2018 with a preliminary budget for fiscal year 2015. These submissions are required to conform to generally accepted accounting principles (GAAP). In addition HHC prepares a cash budget and financial plan and manages its day-to-day financial operations on a cash basis. HHC’s outlook in both a GAAP basis and a cash basis is discussed below.
GAAP trends. In fiscal year 2014 HHC’s estimated total revenue was $7.6 billion—$5.0 billion (66 percent) from charges for patient services billed on a fee-for-service basis and other supplementary payments, $2.2 billion (29 percent) from MetroPlus insurance premiums, and $379 million (5 percent) from direct City appropriations, grants, and other sources. (See Table 1.) Patient service revenue includes fee-for-service payments from Medicaid, Medicare, and private insurers, and from Medicaid and Medicare managed care plans. HHC also receives supplemental payments from Medicaid, including disproportionate share (DSH) payments to hospitals that serve a significant population of uninsured and Medicaid patients and Upper Payment Limit (UPL) payments to supplement fee-for-service Medicaid payments up to the Medicare rate.5
Revenues from MetroPlus are a function of the number of enrollees and premium rates set by the State. In fiscal year 2013 MetroPlus offered plans for Medicaid, Medicaid HIV Special Needs, Managed Long-Term Care, Child Health Plus, Family Health Plus, and Medicare enrollees. In fiscal year 2014 MetroPlus began offering a Qualified Health Plan (QHP) on the New York State exchange under the federal Affordable Care Act (ACA). In fiscal year 2014 New York City appropriated about $379 million to HHC to provide health care services to inpatient healthcare services at hospitals for inmates of New York City jails and uniformed personnel, for other contractual services, and as a general City subsidy.
Revenue from patient services is projected to decrease from $5.0 billion in fiscal year 2014 to $4.7 billion in fiscal year 2018, a drop of $252 million or 1.3 percent annually. This decrease is driven largely by a projected decrease in Medicaid payments for fee-for-service patients. In recent years New York State has shifted Medicaid enrollees into managed care plans, and fee-for-service payments have decreased. Instead managed care companies such as MetroPlus are paid a capitated rate for each enrollee intended to cover a typical annual service use pattern set actuarially according to category of enrollee. In addition to decreased volume of encounters, fee-for-service revenues have declined due to rate reductions for some services. After the fiscal crisis of 2008, for example, New York State implemented 2 percent across-the-board rate reductions for all Medicaid providers, which are only now being restored. Also, supplemental Medicaid pool payments are expected to drop. As the ACA implementation continues the federal government is planning to reduce DSH payments reflecting the expected decline in the uninsured population.
MetroPlus premium revenue is projected to increase from $2.2 billion to $3.2 billion or 9.7 percent annually. However, the growth is projected only from fiscal years 2014 to 2016; 2017 and 2018 projections are flat at $3.2 billion, reflecting HHC’s conservative assumptions about enrollment and rate increases. City appropriations and grants are projected to decline slightly, again based on conservative assumptions.
HHC’s expenditures are projected to grow from $8.2 billion in fiscal year 2014 to $9.8 billion in fiscal year 2018, an increase of $1.7 billion or 4.6 percent annually. About $4.0 billion or 49 percent is for salaries and fringe benefits including pensions, health insurance and other postemployment benefits (OPEB); these items are projected to grow to $4.4 billion in fiscal year 2018, an increase of $333 million or 2.1 percent annually.
Growth in fringe benefit costs is driving growth in personal services expenditures. Fringe benefits are projected to increase from $1.5 billion to $1.8 billion, growth of $220 million or 3.4 percent annually. As a component unit of the City of New York, a public employer, HHC has long-term liabilities for providing health insurance and OPEB to its future retirees. Disclosure of these currently generated future costs is required by the Governmental Accounting Standards Board (GASB), and HHC includes an annual expenditure representing the actuarial contribution it would be required to make to fund the cost of these benefits in the future.
The projections in the May 2014 financial plan do not include the full cost of recent contract settlements with HHC’s major unions. On HHC’s behalf the City settled contracts with 1199SEIU United Healthcare Workers East (1199SEIU) and the New York State Nurses Association (NYSNA); 1199SEIU covers 2,366 employees and NYSNA covers more than 8,314 employees. Both contracts had expired in 2009 and involved terms for retroactive pay. The new contracts largely adhere to the pattern established by New York City’s recently-ratified contract with the United Federation of Teachers (UFT). In addition the City has set a pattern for other civilian workers including 17,106 in District Council 37 (DC37) who work for HHC and whose contract had expired in 2010.6 Full cost estimates including DC 37 are not available but the costs for the 1199SEIU and NYSNA contracts are estimated to be $431 million over the course of the fiscal years 2015 to 2018 financial plan, and $879 million over fiscal years 2014 to 2021, the full term of the contract.7
Although HHC’s labor costs will increase at a greater rate than the May financial plan projections because of the new contracts, the increase will not affect HHC’s projected budget gaps. Mayor de Blasio agreed to cover the incremental costs of the settlements with City funds.
Other than personal services (OTPS) comprises $2.7 billion or 33 percent of total expenditures; OTPS is projected to increase from $2.7 billion to $3.8 billion, growth of $1.1 billion or 9.0 percent on average annually. OTPS pending is largely driven by payments made to other providers by MetroPlus for patient services rendered outside of HHC. Mirroring the trend projected for MetroPlus premium revenue, $1 billion in OTPS growth is shown through fiscal year 2016, but budgeted expenditures for fiscal years 2017 and 2018 are relatively flat.
HHC's other expenditures, including “affiliation” agreements for services, mainly physicians, from private contractors such as medical schools, increase from $1.5 billion to $1.6 billion from fiscal years 2014 to 2018. The largest contract is $439 million in fiscal year 2014 with the Physician Affiliate Group of New York. Contracts with the medical schools of New York University and Mount Sinai Hospital are $275 million and $205 million, respectively, in fiscal year 2014.8 Affiliation contract expenditures in fiscal year 2014 were an estimated $915 million. The figure is projected to increase to $1.1 billion by fiscal year 2018, an average annual increase of 3.5 percent. HHC targeted these contracts for savings in past cost containment efforts through better aligning physicians’ services with community demand, and in 2012 implemented a bonus payment system to reward doctors for achieving quality and efficiency targets and improving patient health.9 However, contracts with many of the doctors in the contract agencies are under negotiation and to the extent wage increases are passed along in affiliation contracts, HHC will face higher costs. Other expenditures in the category include depreciation and medical malpractice. Costs for these two items are projected to remain relatively stable.
Cash trends. HHC’s cash receipts and disbursements are less than revenues and expenditures under GAAP. For fiscal year 2014, for example, reported revenues were $7.6 billion but cash receipts were $7.2 billion. Lower cash receipts are largely explained by timing lags between billing of and payment from insurers including Medicaid and Medicare, and the recording of noncash transactions with the City. In addition, disputes with the State and federal governments over Medicaid and Medicare payments can lead to large, delayed retroactive payments that widen the gap between reported revenue and cash receipts in some years and lead to cash receipts exceeding reported revenues in other years.
The difference between accrued expenditures and cash disbursements is also significant; for example $8.2 billion compared to $7.2 billion in fiscal year 2014. (For HHC’s detailed cash financial plan see Appendix A.) The major differences are:
- The unfunded actuarial cost of OPEB, an expenditure under GAAP but not a cash disbursement; this was $316 million in fiscal year 2014;
- Capital-related items are treated differently under GAAP and cash accounting. GAAP counts as expenditures depreciation and interest on long-term debt; cash accounting excludes depreciation but counts interest and principal payments (that is, debt service) on long-term debt. In fiscal year 2014 expenditures were $100 million lower than disbursements; and,
- Timing differences in the amounts HHC incurs as expenditures (mostly for services to MetroPlus enrollees by other providers) and the actual cash payments for those items and timing differences in the amounts HHC records as revenue earned from third parties for services it provides and the actual receipt of cash from the payers. In fiscal year 2014 these timing adjustments account for the bulk of the remaining difference.
Although on a GAAP basis HHC ran deficits in eight of the nine years from fiscal years 2005 to 2013, on a cash basis it ran deficits in just five years. HHC remains fiscally viable despite persistent GAAP and cash deficits partly because it has made strides to cut costs and benefited from favorable changes in Medicaid policy. These cash reserves have been available to cover annual deficits. In addition, HHC has postponed non-cash liabilities reported under GAAP. (See Appendix A and Appendix B.)
Download Report, Including Appendices
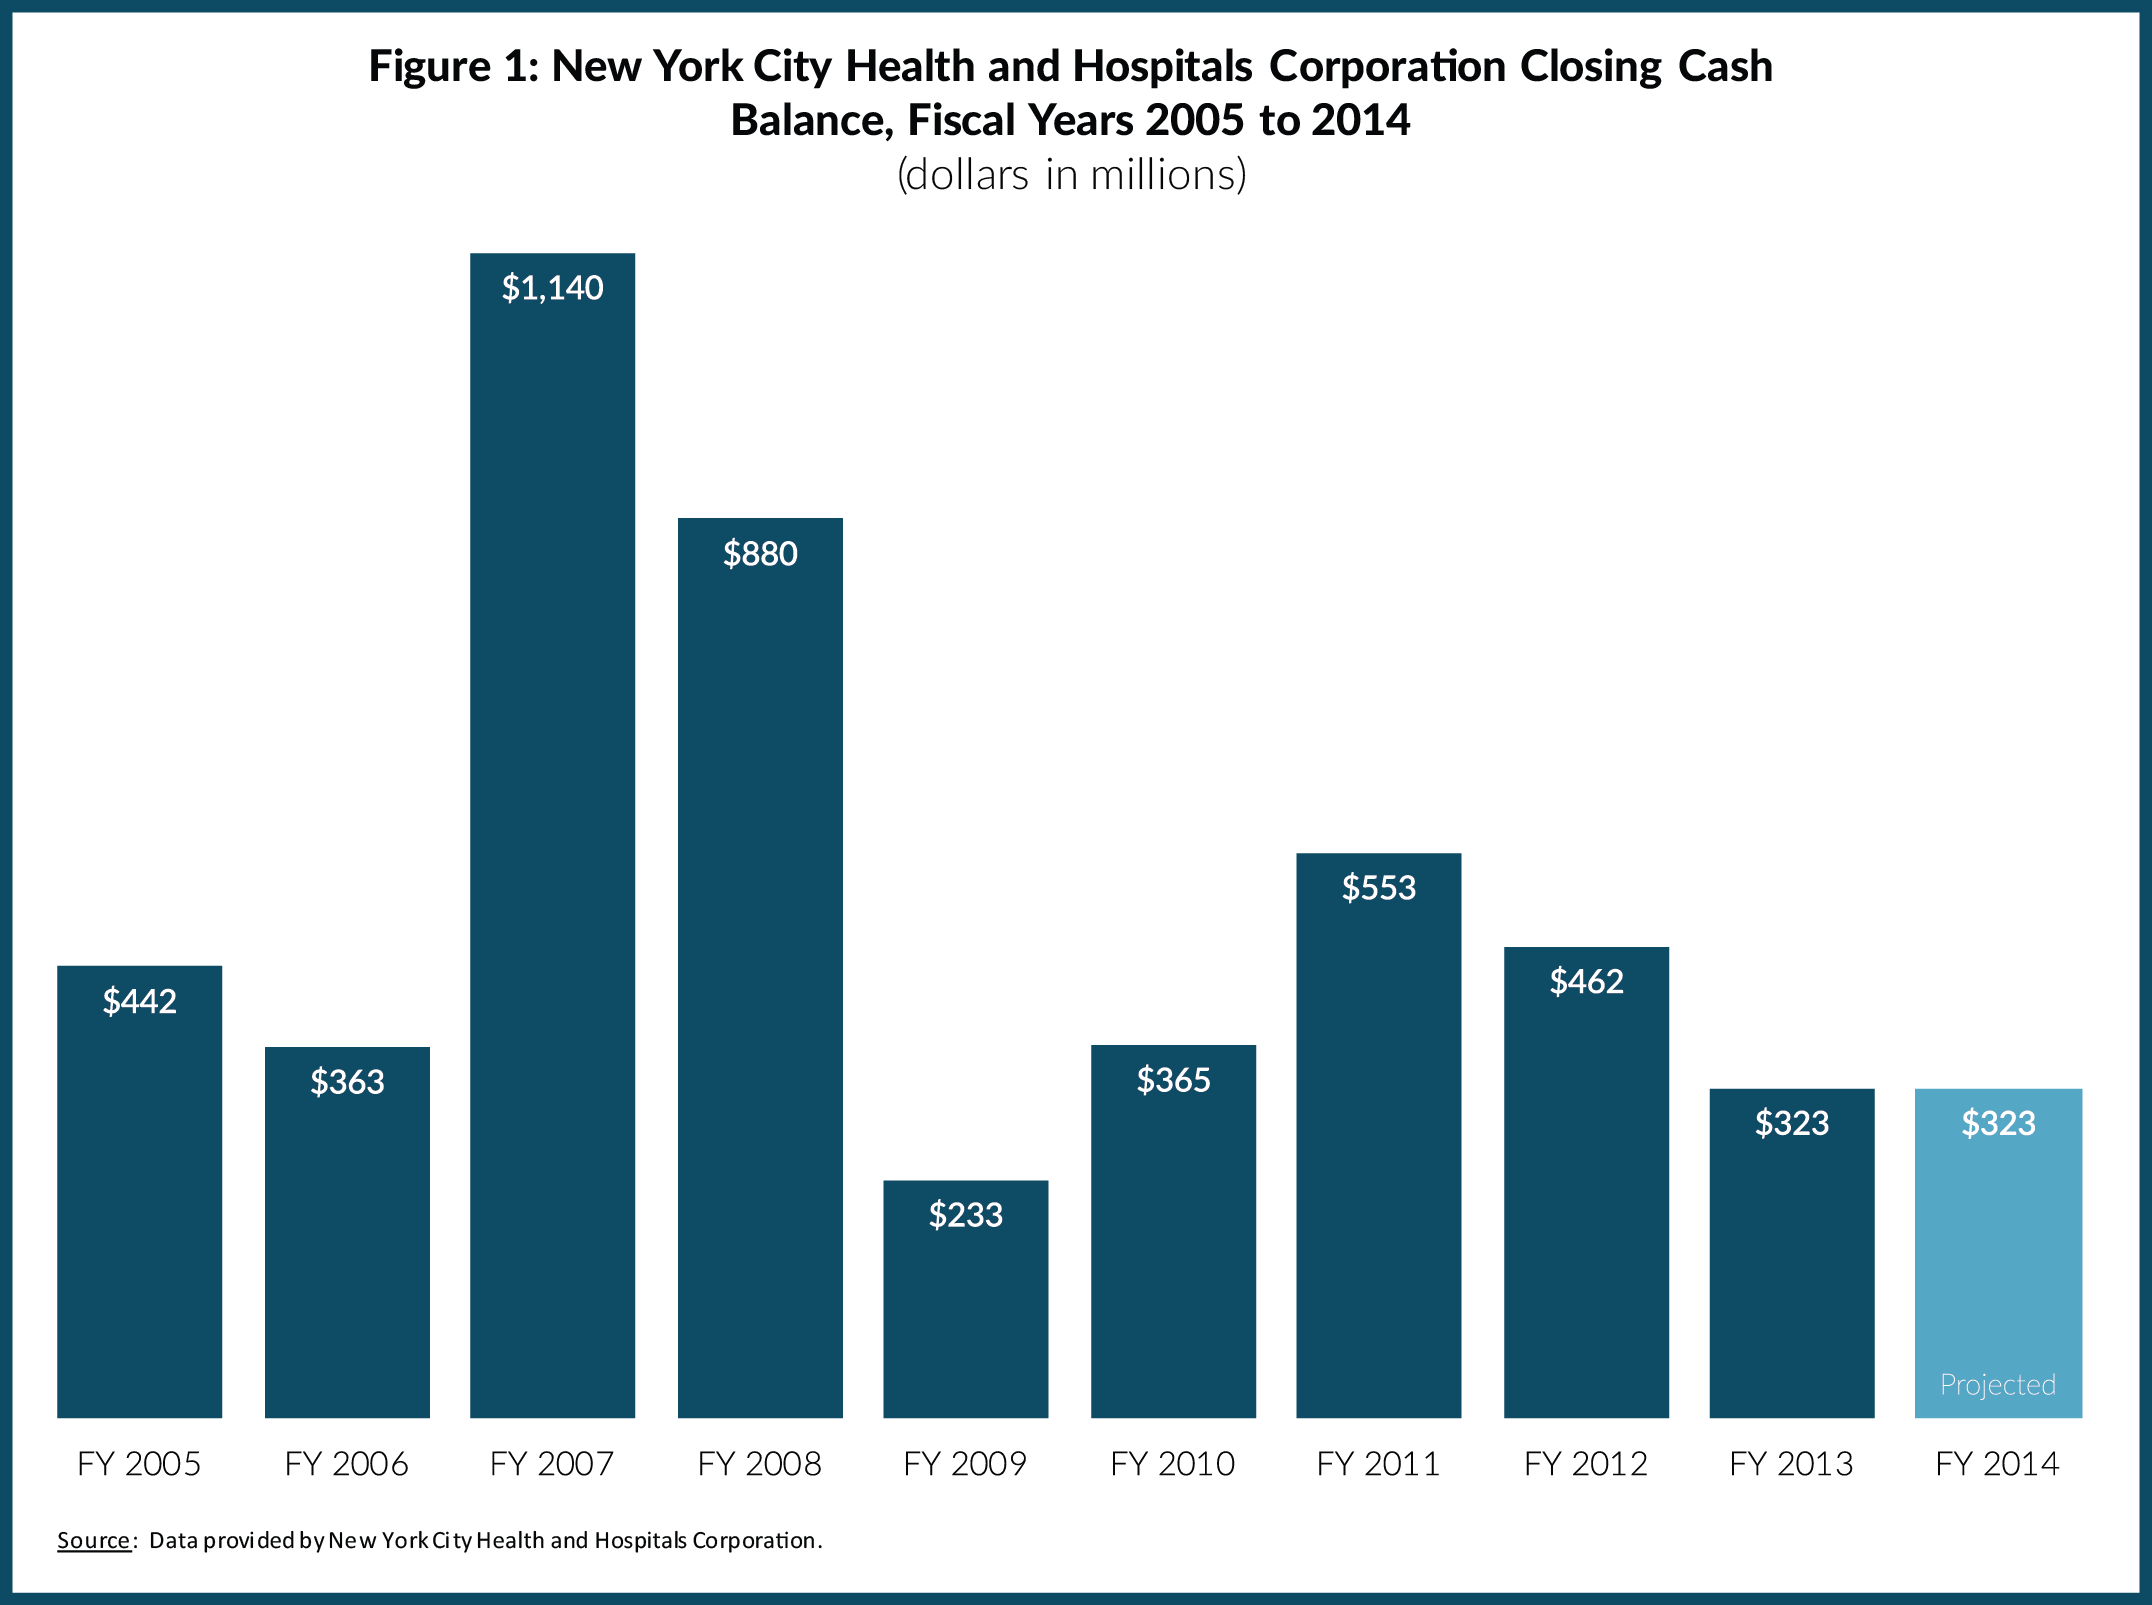
Fiscal Challenges Facing the New York City Health and Hospitals CorporationAccumulation and use of cash reserves. HHC’s cash reserves peaked in fiscal year 2007 when it was the beneficiary of favorable policy changes in Medicaid. In that year HHC collected retroactive payments and enjoyed additional support from changes in the intergovernmental financing of DSH and UPL payments.10 The additional funding helped HHC end fiscal year 2007 with a cash surplus of $780 million and an accumulated $1.1 billion in cash reserves. (See Figure 1 and Appendix C.)
Download Report, Including Appendices
Fiscal Challenges Facing the New York City Health and Hospitals CorporationAlthough HHC has maintained a positive cash balance, after the peak HHC drew from cash reserves in fiscal years 2008 and 2009, and added to them again in fiscal years 2010 and 2011, ending fiscal year 2011 with a cash balance of $553 million. HHC closed fiscal year 2013 with $323 million in cash reserves and shows a $323 million cash balance in fiscal year 2014 with no planned use of reserves. The $323 million carries forward into fiscal year 2015 and, with no further action, will be applied to a $203 million projected cash shortfall in that year. Under those assumptions HHC will enter fiscal year 2016 with $120 million remaining in cash reserves and a cash shortfall of $827 million. In short, without other actions HHC will run out of cash by fiscal year 2017.
Risks to the Plan to Close the Budget Gaps
Absent new initiatives, HHC’s accumulated cash shortfall is projected to be $3.2 billion by fiscal year 2018, and its accumulated GAAP deficit is projected to be $4.8 billion. In its gap-closing plan HHC addresses only the $3.2 billion cash shortfall by making two assumptions: 1) an additional $1.6 billion in unrestricted state and federal aid; and 2) $1.6 billion in cost containment initiatives. Both measures are at best risky and may prove unachievable.
HHC included $90 million in incremental savings from prior cost containment actions for fiscal year 2015. However, the same estimate appeared in the original financial plan for fiscal year 2014 and was removed in the most recent update, casting doubt on its achievability. Target savings from unspecified cost containment initiatives are $200 million in fiscal year 2015, $300 million in fiscal year 2016, $350 million in fiscal year 2017, and $400 million in fiscal year 2018. These cost containment figures for future years lack specificity and detailed plans to achieve them.
An additional $400 million per year is expected from the State or federal governments and in particular from the Medicaid Waiver approved by the federal government in April 2014. Although HHC is likely to get additional funds from the Medicaid Waiver, $400 million annually may be too optimistic.
As part of the Medicaid Redesign Team (MRT) initiatives, the New York State Department of Health has been granted a Section 1115 Waiver Amendment from the federal government. The waiver amendment allows the State to test new ways of delivering services. New York’s waiver allows the state to retain $8 billion in savings that otherwise would have gone to the federal government and to invest it over a five-year period to incentivize beneficial changes in patient care. The bulk of the funds, about $6 billion, are for Delivery System Reform Incentive Payments (DSRIP) to networks of providers, grouped together in Performing Provider Systems (PPSs) after they meet performance benchmarks such as reducing avoidable hospitalizations.11 Smaller investments will be made to improve managed care—about $890 million to expand access to primary care and $190 million for the development of “health homes,” offering comprehensive case management within a large network of providers.
HHC expects to qualify for significant funding in DSRIP and as a financially troubled hospital through the Interim Access Assurance Fund (IAAF). The waiver set aside $500 million for IAAF to provide an immediate cash infusion to struggling hospitals. HHC was awarded $152 million of its $213 million IAAF request, more than half of the $250 million available to large public hospitals statewide.12 Seven HHC hospitals have been identified as emerging PPSs because they submitted letters of intent to apply for the program, although the final number of applicants may be smaller. If any HHC hospitals are selected as the lead provider of a PPS they will spearhead and be accountable for clinical initiatives with their other network partners to better coordinate outpatient care. The goal is to reduce avoidable hospitalizations by 25 percent over five years.13
Because all DSRIP payments are performance-based, HHC will not receive full payment if it fails to meet performance targets. “Pay-for-performance” models carry particular risk for HHC, which serves patients for whom care is difficult to manage. In the past HHC has underperformed Medicare benchmarks related to avoidable hospitalizations. When Medicare began to reduce payments for facilities with readmission rates higher than national norms in 2012, all 11 HHC hospitals failed to meet the target and 7 suffered payment losses that exceeded the citywide norm.14 By 2014 nine hospitals had reduced their payment losses but two, Coney Island Hospital and North Central Bronx Hospital, lost more. Unlike the Medicare targets which were based on national benchmarks, DSRIP payments will be based on HHC’s prior performance. Failure to meet performance targets statewide could also jeopardize HHC’s DSRIP payments; the terms of the waiver specify financial penalties for failing to meet performance targets must be spread evenly among providers in the state.
Moreover, if the new models of care are successful in reducing hospital admissions, then HHC’s revenues from inpatient care will decrease and its facilities will need restructuring to better align with a payment system focused on capitation and outpatient care. Given the scale of HHC’s hospital-centered operations, a five-year stream of performance payments may not be enough to facilitate a complete transition.
New York State is also continuing its overhaul of Medicaid through continued use of the MRT process. The MRT began in January 2011 as part of Governor Andrew Cuomo’s effort to close a $10.5 billion State budget gap. The MRT engaged stakeholders and made recommendations to improve the cost-effectiveness of New York’s program. More than 250 MRT recommendations have been adopted including rate reductions, payment reforms, and utilization controls.15 A global cap on State-share Medicaid spending was instituted, limiting year-to-year increases to the 10-year rolling average of the medical component of the consumer price index. The cap has had a disciplining effect, reducing the annual growth rate to about 4 percent compared to an average of 6 percent from 2000 to 2009.16 Some MRT initiatives have reduced HHC revenue, including a 2 percent across-the-board rate cut restored this year, further outpatient rate cuts, rate reductions for beneficiaries dually eligible for Medicaid and Medicare, and a reduction in the allowable profit margin for Medicaid managed care plans. The MRT limits on physical therapy, occupational therapy, speech therapy, and personal care services have reduced patient volume at HHC for these services, also decreasing revenue.17 These reductions in service volume should translate into reductions in costs, and HHC is expected to restructure the supply of services to better meet demand. HHC has reduced the number of staff by 2,203 between fiscal year 2010 and fiscal year 2014, lowering its headcount from 40,060 to 37,857 full-time equivalent employees.18
The risky cost containment measures and revenue enhancements are critical elements for HHC’s plan. If, for example, HHC receives all the federal aid it has assumed, but fails to reach its cost containment target, it will run out of cash in fiscal year 2017 instead of fiscal year 2016, postponing severe financial duress by just one year.
Challenges in a Changing Landscape
HHC faces four major challenges in a changing landscape. First, successful implementation of cost controls including restructuring services is critical to managing with less revenue. Second, MetroPlus needs to continue to grow enrollment and increase returns. Third, HHC needs to address the financial burden of continuing to care for a large population of uninsured residents including undocumented immigrants in the face of declining supplemental federal Medicaid funds. Finally, the frequently varying financial relationship with New York City should be made more rational with incentives for greater efficiencies in HHC’s services.
- Implementing Cost Controls
In September of 2009, HHC embarked on a restructuring effort, engaging Deloitte Consulting and preparing a plan called Restructuring HHC: The Road Ahead, with 39 cost-saving initiatives totaling more than $300 million in five areas—administration, long-term care, affiliation/physician contracts, acute care, and ambulatory care.19 Administrative savings opportunities totaling $141 million were identified through greater efficiencies in materials management, plant maintenance, environmental services, and laundry and linen services. In addition, central office cost reduction, insourcing of information technology (IT) contracts, and standardized laboratory services and costs were recommended. The realignment of long-term care to match supply and demand through the consolidation and closure of underutilized facilities and improvement of diagnostic coding and billing was estimated to save $47 million.
The Plan identified $51 million in savings from affiliation contracts by better matching physician staffing with patient volume. Acute care realignment, including proposals to reduce hospital stays, consolidate selected inpatient services, and keep more surgeries within the HHC system was estimated to save $26 million. Ambulatory care realignment was estimated to save $40 million through consolidation of specialty outpatient services and closure of six satellite clinics with low utilization, approval of six diagnostic and treatment centers as Federally Qualified Health Centers (FQHCs), and the transition of dialysis services to a joint-venture model.
Specific accomplishments include the closure of the Brooklyn laundry facility, the insourcing of 140 IT jobs, closing 426 long-term care hospital beds and 410 skilled nursing facility beds, bariatric surgery expansion for 1,000 patients, improved cancer care utilization at Kings County Hospital and Queens Hospital, and improved Neonatal Intensive Care Unit utilization at Bellevue Hospital Center and Jacobi Medical Center.20 HHC reports baseline savings of $230 million from restructuring initiatives in fiscal year 2013.
Changes in ambulatory care services have proved more difficult. Six underutilized satellite clinics were closed, but HHC is awaiting federal approval for six FQHCs, postponing the realization of $25.7 million in savings. HHC has faced difficulty fully implementing some of the initiatives. The Brooklyn laundry facility closure met with initial opposition; eventually a contract was signed with a private company, but it resulted in less cost reduction than originally expected, $9.2 million versus $13.5 million.21 Although HHC initially planned to privatize outpatient dialysis services, estimated to save $20 million annually, in May 2014 the plan was indefinitely postponed.22
HHC has identified $90 million in specific cost containment actions for the current fiscal year. However, the financial plan assumes another $200 million in savings; by fiscal year 2018 the financial plan calls for cost containment to increase to $400 million. To realize savings of that magnitude by fiscal year 2018 HHC will need to intensify its restructuring efforts. Service delivery needs to be made more efficient and unneeded hospital capacity reduced.
Excess hospital capacity is a pressing and difficult issue not unique to HHC. As the health care system reduces unnecessary admissions and substitutes outpatient for inpatient services, the need for hospital beds will continue to decrease. Data provided by HHC show potentially preventable admission rates for HHC facilities are 23.8 percent compared to a citywide average for non-HHC facilities of 17.2 percent.23 Shrinking hospital capacity is a political challenge. In 2007 the New York State Commission on Health Care Facilities in the 21st Century (The Berger Commission) recommended hospital closures or shrinkage to address overcapacity across the state and succeeded in closing about 3,400 beds statewide by using the model the federal government used to close military bases.24 The model allowed the closure plan to automatically become law unless it was explicitly rejected by the legislature. However, a later commission set up without special legal powers to address the health care needs in Brooklyn was unable to achieve restructuring of five of the six hospitals it identified as obsolete and in major need of overhaul. The commission concluded Brooklyn had about 1,200 excess beds. The continuing controversy and delay of the closing of the sixth hospital, Long Island College Hospital, epitomizes the difficulties of hospital downsizing.25 If all goes well with HHC’s effort to reduce preventable admissions and HHC is to ‘right-size’ its services, support from elected leaders will be needed.
- Effectively Managing MetroPlus
MetroPlus is a major Medicaid managed care plan, which increased its revenue from $485 million in fiscal year 2005 to $2.2 billion in fiscal year 2013. An effective management strategy for MetroPlus has two parts: 1) growing enrollment with an increased emphasis on greater market share; and 2) maximizing cost-coverage ratio while improving quality.
Growing enrollment. The substantial growth in MetroPlus revenue is due largely to its enrollment growth. From 2005 to 2014, Medicaid managed care enrollment in MetroPlus more than doubled from 230,200 to 467,823.26 This growth can be attributed to a combination of growth in statewide Medicaid eligibility and State policies expanding mandatory managed care enrollment among those eligible for Medicaid. Enrollment in Medicaid surged in the wake of the Great Recession; from 2010 to 2014 Medicaid enrollment in New York State increased more than 1 million.27 In this period mandatory managed care was applied to many more of those in the program; in December 2012 the share of the “mainstream” Medicaid population in managed care plans was 96 percent, up from 78 percent five years earlier.28
MetroPlus will have opportunities to reach additional Medicaid eligibles in the coming years, but increasingly enrollment growth will have to be based on an increased market share rather than a growing market. New sources of growth are those made eligible for Medicaid by the ACA, individual and small business enrollment under the ACA, and new long-term care managed care arrangements promoted by State policies.
An additional 525,283 people have already enrolled in New York’s Medicaid program as a result of the ACA.29 This includes 68,287 single adults with income from 100 to 138 percent of the federal poverty line who are newly eligible, and many others who found it easier to apply and qualify for Medicaid on New York’s health exchange, the so-called “woodwork effect” enrollees.
Another source of new Medicaid enrollment is long-term care. The State is launching a major effort to enroll recipients dually eligible for Medicaid and Medicare in fully capitated managed care programs to better coordinate care. New York City had about 104,000 enrolled in partially capitated managed long-term care. MetroPlus had enrolled just under 1,200 as of July 2014.30 If HHC enters the rapidly expanding long-term care marketplace aggressively and successfully there are opportunities for growth.
HHC also entered the private managed care marketplace. In January 2014 MetroPlus began offering Qualified Health Plans (QHP) through the New York State of Health, New York’s insurance exchange established under the ACA. The plan has proved popular; by March 2014, MetroPlus in the four counties where it is offered enrolled 56,062 individuals, or 35 percent of the individual marketplace.31 Small businesses are also opting for MetroPlus, with 25 percent of the total small businesses enrollment in New York City.32
While segments of the managed care market are expanding, the mainstream Medicaid market is largely saturated and MetroPlus will likely have to increase its market share in order to continue enrollment expansion at a vibrant pace. As of August of 2014, MetroPlus had 16 percent of all mainstream Medicaid managed care enrollment in New York City. MetroPlus had a 13 percent share of the New York City market for partially capitated managed long-term care and 8 percent of the Medicare Advantage market, a plan that partners with Medicaid to offer partially capitated care to dually eligible beneficiaries.33 HHC does not offer Medicare Advantage Plus with fully capitated care for dual eligible beneficiaries who qualify for nursing homes. As indicated, market share of individual QHP enrollment in MetroPlus is 35 percent and 25 percent for small businesses.
For QHP enrollment price competition appears important, and MetroPlus has been aggressive in its pricing. In the individual market, HHC offered the least expensive option for three of the four plan levels.34 However, this strategy has risks. Some argue that the first wave of enrollees on the exchanges is likely to be sicker and costlier patients for whom coverage is of greatest benefit.35 Some large providers such as Kaiser Permanente in California have not aggressively sought the first wave of enrollment and cautiously priced their plans relatively high on the state exchange.36 If MetroPlus attracts mostly expensive and sicker enrollees, then its costs may exceed the anticipated rate and the gains in market share may backfire with operating losses. Price competition should be used, but cautiously, in expanding the share of this segment of the market.
Price competition is not relevant for Medicaid managed care enrollment because the State sets the rates for plans. Perceived quality is a critical factor among those choosing plans, and MetroPlus has room for improvement in this arena. A snapshot of MetroPlus quality based on data for 2012 yields a mixed picture.37 The plan performed better than the statewide average for all plans in some areas and lagged in others. Physician quality and quantity are significant challenges. The board certification rate for physician providers is significantly lower than the statewide average for most specialties; for primary care physicians, for example, 78 percent of MetroPlus doctors were board certified compared to 98 percent statewide. MetroPlus had more enrollees per provider; for example, it had 148 enrollees per primary care physician compared to a statewide average of 60. In the behavioral health discipline, MetroPlus had 208 enrollees per provider, a ratio more than three times the statewide average of 60.
MetroPlus performed better on measures of preventive care. Its rates for adolescent well-care visits, breast cancer screening, cervical cancer screening, chlamydia screening, monitoring for patients on persistent medications, child health, and medical management for people with asthma are all higher than the statewide average. However, among all enrollees MetroPlus performed initial health screenings on just 24.7 percent of enrollees compared to a statewide average of 36.1 percent.
Quality indicators in the Mayor’s Management Report also point to potential improvements. The shares of patients continuing care within HHC after their initial encounter show declines. For example, the percent of prenatal patients retained in care through delivery declined from 89.2 percent in fiscal year 2009 to 81.4 percent in fiscal year 2014. HIV patients retained in care declined from 87.1 percent in fiscal year 2010, the first year the metric became available, to 86.6 percent in fiscal year 2014. Wait times for primary care visits increased 30 percent in the past five years, from 59 minutes in 2010 to 77 minutes in 2014.38
In order to expand future enrollment HHC will need to take steps to improve the quality of the MetroPlus plan. Without quality improvements enrollment expansion will slow and perhaps even reverse.
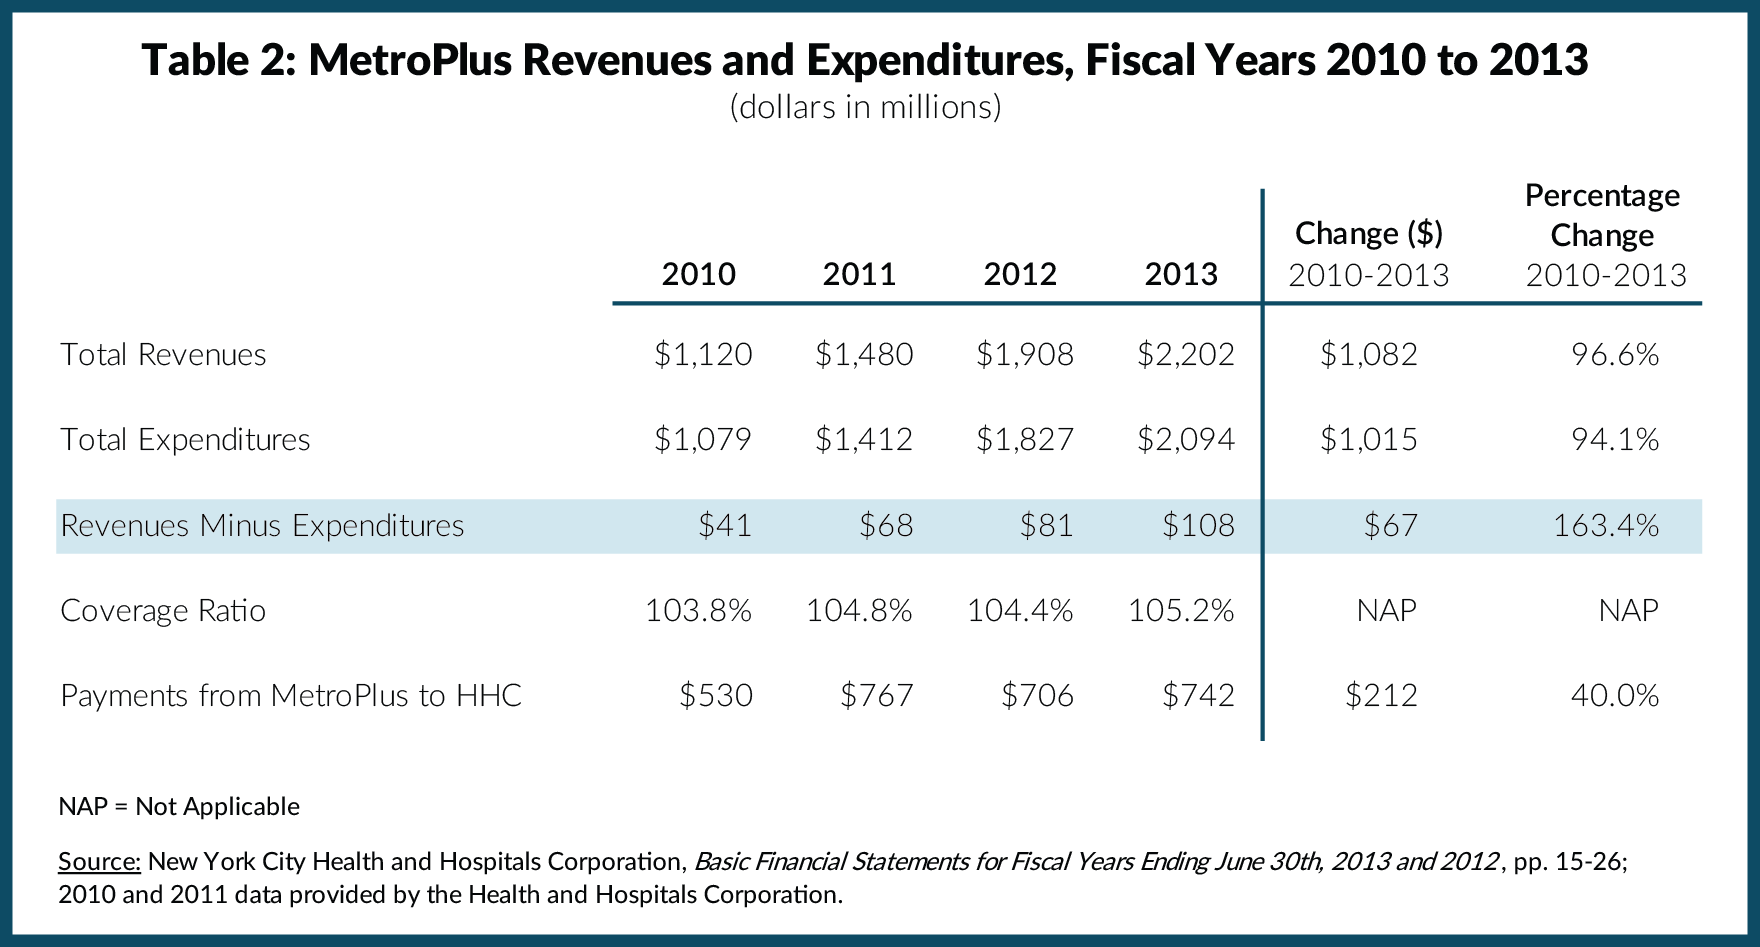
Increasing cost-coverage ratios without compromising quality. One reason MetroPlus is fiscally important for HHC is that it generates a profit. From fiscal years 2010 to 2013 the MetroPlus profit margin increased from 3.8 percent to 5.2 percent. (See Table 2.) Revenues increased $1.1 billion, or 96.6 percent while expenditures grew 94.1 percent. Although the margin increased, it is not likely to increase enough to allow HHC to cover major shortfalls in other areas.
The MetroPlus margin can improve due to higher premium rates, but such opportunities are limited. Rate increases of some magnitude are likely, but their revenue potential is constrained. For Medicaid enrollees the rates are determined by the State; as previously noted, the State is engaged in a rigorous campaign to limit Medicaid expenditure growth, and increases in capitation rates for its plans are likely to be limited. For QHP rates two factors are relevant. First, rate increases are regulated by the New York State Financial Services Department, and allowable increases may not cover cost increases. This year, for example, rate increases of 5.7 percent on average have been approved for plans participating in New York’s health exchange over the objection of some plan directors, who sought larger increases.39 Second, increasing the cost of the plan for consumers is likely to undermine positive price competition for MetroPlus and reduce its market share.
Another avenue for MetroPlus to enhance its fiscal role at HHC is for the plan to retain more of its members’ utilization at HHC facilities. To the extent members rely on HHC services the premium revenue stays within HHC and payments to outside providers are reduced. In fiscal year 2013 payments from MetroPlus to HHC were $742 million, just one-third of premiums collected, up from $530 million, or 40 percent, in fiscal year 2010. To increase the share of MetroPlus services provided by HHC, patients should be attracted to in-house providers because of their high quality relative to others and their proximity to member residences. As noted, planning for improved quality is critical to a promising future for MetroPlus.
- Financing Care for the Uninsured
The ACA increased the size and share of the insured population, and accordingly decreased the cost of uncompensated care for HHC and other hospitals. Nonetheless, a number of people will remain uninsured in New York. The Kaiser Family Foundation estimates 33 percent of New York’s approximately 2.2 million uninsured nonelderly, about 700,000 people, will not obtain health insurance through the ACA. About 12 percent of them, or 264,000 individuals, a large number of whom reside in New York City, are estimated to be ineligible because they are undocumented immigrants.40 Although some of the remaining uninsured individuals are expected to purchase coverage privately many will not, either because they are unable to pay premiums from discretionary income or because they calculate their risk of incurring large medical expenses as low due to their good health status.41 Many of the latter group are young adults, characterized by analysts as the self-perceived “invincibles."Given its mission, HHC will likely continue to play a major role in caring for the uninsured. The fiscal strategies to support this mission are to seek funding for this purpose including retaining current sources and to promote an equitable division of responsibility for the uninsured between HHC and the voluntary sector.
Currently HHC relies heavily on Medicaid DSH payments to offset the costs of providing care to the uninsured; in fiscal year 2013 about 11.1 percent of its revenue came from DSH.42 The ACA authorized reductions in DSH funds based on reduced need due to the expansion of insurance coverage; these reductions were originally to begin in 2014, but as opposition to the cuts mounted they were postponed until 2017. HHC expects a $2.6 billion cut over the eight-year phase-in period, beginning with a $260 million reduction in fiscal year 2017.43 Although the cuts may be postponed again due to sustained political pressure from affected jurisdictions, HHC and City leaders still face the larger question of how best to finance care for the uninsured despite reduced federal support.
Another strategy for HHC is to reduce its share of the fiscal burden for the uninsured by seeking a different allocation of responsibility with the voluntary sector. As noted earlier, HHC cares for 18 percent of all hospital inpatients in the city but 45 percent of the uninsured inpatients. In addition to providing significant inpatient care to uninsured New Yorkers, in 2012 70 percent of clinic visits and 43 percent of emergency room visits by uninsured patients were to HHC facilities.44 As tax-exempt nonprofit entities, voluntary hospitals are required by federal law to provide community benefits and care to the indigent, and are required by State law to have financial assistance programs to provide care at reduced rates for qualified patients.45 Voluntary hospitals also receive funding from the State indigent care pools to provide care for the uninsured. HHC leaders can advocate for conditioning available tax exemptions and funding sources on greater participation by all voluntary hospitals in sharing the burden of caring for the uninsured.
-
Creating a rational financial relationship with the City of New York
The City’s role in funding HHC has varied among recent Mayoral administrations. The Giuliani Administration sought to privatize some HHC facilities and to cap the size of the City subsidy to HHC. The privatization effort was unsuccessful, but in response to the tighter subsidy arrangement HHC closed hospital beds and reorganized for greater efficiency. The City also agreed to a swap in which it assumed responsibility for HHC’s debt service payments, but received money from HHC to offset the cost of medical malpractice litigation.46 With an incentive to reduce malpractice costs HHC successfully implemented safety protocols that have reduced claims.47The Bloomberg Administration took a different posture, supporting intergovernmental efforts to enable HHC to increase its revenue from federal supplementary payment programs. Beginning in fiscal year 2006 HHC retained the full share of supplemental Medicaid programs to which it was entitled under federal regulation, and retroactive and increased ongoing supplemental payments enhanced HHC’s financial condition. In addition, in fiscal year 2012, when HHC encountered fiscal difficulties, the City allowed HHC to defer its payment for malpractice claims, debt service, and other payments in order to maintain an adequate cash flow.48
Most recently, Mayor de Blasio expanded City support beyond that under Bloomberg by using City funds to cover the incremental cost of contract settlements with HHC’s major unions. In late August the City Council approved a budget modification appropriating the first $95 million transfer to HHC to cover the incremental cost of the labor contracts.49 This new policy provides generous new support for HHC but creates future risks. The incremental labor costs extend beyond the Mayor’s current term, and HHC may face large funding gaps should the next Mayor change the policy.
As HHC faces the fiscal challenges ahead, municipal leaders should develop more rational and stable guidelines for funding HHC in its efforts to meet its mandates. The new approach should seek to improve HHC’s financial stability, its ability to engage in long-term financial planning, and its incentives for cost-effective service delivery. Possibilities include capitated payments for the uninsured that reflect the actuarially-based cost of providing care to them and incentive payments for state-of-the-art care management models that improve quality and reduce costs. City leaders should begin a dialogue with HHC and other national health care experts about the best way to rationalize the financial relationship.
HHC has navigated financial difficulties since its inception. The new administration provides an opportunity to chart a new course to enable HHC to take on future challenges with some assurance of fiscal stability and sustainability.
Download Report, Including Appendices
Fiscal Challenges Facing the New York City Health and Hospitals CorporationFootnotes
- MetroPlus enrollment as of September 2014 provided by New York City Health and Hospitals Corporation.
- CBC staff analysis of New York State Department of Health, 2011 Annual Report: Table 9 (I) Discharges/Average Length of Stay by County of Hospitalization and Hospital by Expected Primary Source of Reimbursement (October 2012), www.health.ny.gov/statistics/sparcs/annual/ip/2011/t2011_09i.htm.
- CBC staff analysis of New York State Department of Health, “NYS Health Profiles” (accessed October 27, 2014), http://profiles.health.ny.gov/hospital/.
- City of New York, Office of Management and Budget, Transmittal Letter to the Financial Control Board, FY 2015 Executive Budget (May 8, 2014), Exhibit B1: NYC Health and Hospitals Corporation, Accrual Basis, p. 23, www.nyc.gov/html/omb/downloads/pdf/exec14_fpmod.pdf.
- Center for Health Care Strategies, Inc. Medicaid Supplemental Payments: Where Do They Fit in Payment Reform? (August 2011), p. 2, www.chcs.org/media/Medicaidsupplementalpaymentbrief1.pdf.
- Union membership figures provided by New York City Health and Hospitals Corporation.
- The City of New York, "Mayor de Blasio, 1999SEIU, NYSNA Announce Tentative Contract Agreements" (press release, June 25, 2014), www1.nyc.gov/office-of-the-mayor/news/308-14/mayor-de-blasio-1199seiu-nysna-tentative-contract-agreements.
- Data on affiliation contracts for fiscal year 2014 provided by New York City Health and Hospitals Corporation.
- New York City Health and Hospitals Corporation, “HHC Will Award Up to $59 Million in Bonus Payments to Physicians for Achieving Quality, Efficiency Targets, and Improving Patient Health ” (press release, January 12, 2013), www.nyc.gov/html/hhc/html/news/press-release-2013-01-11-efficiencyqualitybonus-2012.shtml.
- Independent Budget Office, Larger City Subsidy Saves Public Hospitals, For Now (March 2008), p. 3, www.ibo.nyc.ny.us/iboreports/HHC0308.pdf.
- New York State Department of Health, “Delivery System Reform Incentive Payment (DSRIP) Program” (accessed October 29, 2014), www.health.ny.gov/health_care/medicaid/redesign/delivery_system_reform_incentive_payment_program.htm.
- New York State Department of Health, “IAAF Awards for Large Public Hospitals” (accessed September 12, 2014), www.health.ny.gov/health_care/medicaid/redesign/iaaf/docs/iaaf_awards_large_publics.pdf.
- New York State Department of Health, “Emerging Performing Provider Systems” (accessed, August 15, 2014), www.health.ny.gov/health_care/medicaid/redesign/dsrip_loi_received/emerging_pps/.
- New York City Independent Budget Office, Will New York City Hospitals That Treat Many Low-Income Patients Face the Heaviest Penalties under New Federal Reimbursement Policies? (June 12, 2013), http://ibo.nyc.ny.us/cgi-park2/?p=398.
- New York State Department of Health, "MRT Phase One Updates" (accessed September 4, 2014), www.health.ny.gov/health_care/medicaid/redesign/mrt_progress_updates.htm; and Jason Helgerson, Medicaid Director, New York State Department of Health, “Medicaid Redesign Team Update and Next Steps” (presentation to the Citizens Budget Commission, New York City, May 14, 2013), p. 20, http://www.slideboom.com/presentations/761944/Presentation-Given-by-NYS-Medicaid-Director-Jason-Helgerson.
- Elizabeth M. Patchias and Sarah K. L. Samis, Medicaid Institute at United Hospital Fund, New York’s Medicaid in Transition: A New Primer for 2014 (July 2014), p. 14, www.uhfnyc.org/publications/880994.
- Testimony of Alan Aviles, President and Chief Executive Officer, New York City Health and Hospitals Corporation, before the New York City Council Committee on Health, Committee on Finance & Committee on Mental Health, Mental Retardation, Alcoholism, Drug Abuse and Disability Services (May 24, 2011), www.nyc.gov/html/hhc/html/about/city-council-testimony-20110524.shtml.
- Office of Management and Budget, Executive Budget: Fiscal Year 2011, Message of the Mayor (May 6, 2010), p. 229, http://www.nyc.gov/html/omb/downloads/pdf/mm5_10.pdf; fiscal year 2014 data provided by the New York City Health and Hospitals Corporation.
- New York City Health and Hospitals Corporation, Restructuring the HHC: The Road Ahead (May 2010), pp. 5-8, www.nyc.gov/html/hhc/downloads/pdf/hhc-road-ahead-report.pdf.
- Alan Aviles, President, New York City Health and Hospitals Corporation, “Restructuring HHC: An Update on the Road Ahead and the Challenges Going Forward” (presentation to the New York City Council Health Committee, New York City, February 24, 2014), www.nyc.gov/html/hhc/downloads/pdf/hhc-restructuring-city-council-hearing-201402.pdf.
- New York City Health and Hospitals Corporation, Strategic Planning Committee Meeting of the Board of Directors (January 14, 2014), pp. 4-17, www.nyc.gov/html/hhc/downloads/pdf/board-packets/2014/201401-strategic.pdf.
- New York City Health and Hospitals Corporation, “HHC President Dr. Ram Raju Testifies at City Council Executive Budget Hearing”, (press release, May 27, 2014), www.nyc.gov/html/hhc/html/about/city-council-testimony-20140527.shtml.
- Data on potentially preventable admission rates provided by the New York City Health and Hospitals Corporation.
- New York State Department of Health, “Berger Commission Measures Implemented, State Health Commissioner Reports” (press release, July 2, 2008), http://www.health.ny.gov/press/releases/2008/2008-07-02_berger_commission_measures_implemented.htm.
- Health Systems Redesign Workgroup, Medicaid Redesign Team, At the Brink of Transformation: Restructuring the Healthcare Delivery System in Brooklyn, 2011 (November 28, 2011), pp. 5-10, www.health.ny.gov/health_care/medicaid/redesign/docs/brooklyn_mrt_final_report.pdf.
- MetroPlus enrollment for September 2014 provided by New York City Health and Hospitals Corporation; New York City Office of Management and Budget, Mayor's Management Report (September 2011), p. 14, www.nyc.gov/html/ops/downloads/pdf/mmr/0911_mmr.pdf.
- Department of Health and Human Services, Centers for Medicare and Medicaid Services, Medicaid and CHIP: March 2014 Monthly Applications, Eligibility Determinations, and Enrollment Report (May 1, 2014), p. 9, www.medicaid.gov/AffordableCareAct/Medicaid-Moving-Forward-2014/Downloads/March-2014-Enrollment-Report.pdf; and New York State Department of Health, Number of Medicaid Enrollees by Category of Eligibility by Social Service District – Calendar Year 2010 (May 6, 2011), www.health.ny.gov/statistics/health_care/medicaid/eligible_expenditures/el2010/2010-cy_enrollees.htm.
- CBC staff analysis of New York State Department of Health, Monthly Medicaid Managed Care Enrollment Reports (September 2014), www.health.ny.gov/health_care/managed_care/reports/enrollment/monthly/; and
- New York State Department of Health, Archives Monthly Medicaid Managed Care Enrollment Reports (January 2013), https://www.health.ny.gov/health_care/managed_care/reports/enrollment/monthly/archives.htm.
- New York State Department of Health, New York State of Health, 2014 Open Enrollment Report June 2014 (June 2014), p. 5, http://info.nystateofhealth.ny.gov/sites/default/files/NYSOH%202014%20Open%20Enrollment%20Report_0.pdf.
- New York State Department of Health, Recipient Counts for Medicaid Long Term Care Services, Service Date Calendar Year 2003 through 2012 Statewide Table 2 (July 2013), Provided by the New York State Department of Health.
- New York State Department of Health, 2014 Open Enrollment Report (June 2014), pp. 23-45, http://info.nystateofhealth.ny.gov/2014OpenEnrollmentReport.
- New York State Department of Health, 2014 Open Enrollment Report (June 2014), pp. 42-45, http://info.nystateofhealth.ny.gov/2014OpenEnrollmentReport.
- New York State Department of Health, Open Enrollment Report (August 2014), pp. 23-45, www.health.ny.gov/health_care/managed_care/reports/enrollment/monthly/2014/docs/en08_14.pdf.
- On a monthly basis, HHC offered the least expensive plan in New York City on the Platinum, Gold, and Silver plan levels, and the second least expensive plan on the Bronze level. On the Platinum level, HHC’s plan cost $443, compared to a median cost of $637 in the New York City area. On the Gold level, HHC’s plan cost $395, with the median cost of a gold plan priced at $539. On the Silver level, HHC’s plan was offered at $359, with the median plan at that level costing $459.22. On the Bronze level, HHC’s plan cost $334.44, with the median plan costing $395.33.
- Center on Budget and Policy Priorities, Why a State’s Health Insurers Should Support Expanding Medicaid (September 2012), p. 3, www.cbpp.org/files/medicaid-and-insurers-memo.pdf.
- Chad Terhune, “Kaiser’s Obamacare rates surprise analysts,” The Los Angeles Times (June 12, 2013), http://articles.latimes.com/2013/jun/12/business/la-fi-kaiser-health-rates-20130613.
- New York State Department of Health, Office of Quality and Patient Safety, External Quality Review Technical Report for MetroPlus Health Plan, Inc. Reporting Year 2012 (May 2014), https://www.health.ny.gov/statistics/health_care/managed_care/plans/reports/docs/metroplus.pdf.
- City of New York, Office of Management and Budget, Mayor's Management Report (September 2014), p. 140, www.nyc.gov/html/ops/downloads/pdf/mmr2014/2014_mmr.pdf.
- New York State Department of Financial Services, “Superintendent Lawsky Announces Setting of 2015 Health Insurance Rates for New York, Including Rates for Health Benefits Exchange” (press release, September 4, 2014), www.dfs.ny.gov/about/press2014/pr1409041.htm.
- The Henry J. Kaiser Family Foundation, How Will the Uninsured in New York Fare Under the Affordable Care Act? (January 2014), http://kaiserfamilyfoundation.files.wordpress.com/2013/12/8531-ny.pdf.
- The Center for Studying Health System Change, If the Price is Right, Most Uninsured – Even Young Invincibles- Likely to Consider New Health Insurance Marketplaces (September 2013), pp. 3-5, www.hschange.org/CONTENT/1379/1379.pdf.
- New York City Health and Hospitals Corporation, Basic Financial Statements for Fiscal Years Ending June 30th, 2013 and 2012, pp. 15-26.
- New York City Health and Hospitals Corporation, Minutes: Strategic Planning Committee Meeting of the Board of Directors (May 13, 2014), www.nyc.gov/html/hhc/downloads/pdf/board-packets/2014/201405-strategic.pdf.
- Testimony of Alan Aviles, President and Chief Executive Officer, New York City Health and Hospitals Corporation, before the New York City Council Committee on Health, (March 13, 2014), www.nyc.gov/html/hhc/html/about/city-council-testimony-20140313.shtml.
- Elisabeth Benjamin and Arianne Slagle, Community Service Society and the New York State Health Foundation, Covering More New Yorkers While Easing the State’s Budget Burden (June 2011, Revised January 2012), pp. 14, http://nyshealthfoundation.org/uploads/resources/bridging-gap-exploring-basic-health-insurance-options-january-2012.pdf.
- New York City Independent Budget Office, “Larger City Subsidy Saves Public Hospitals, For Now,” (March 2008), p. 5, www.ibo.nyc.ny.us/iboreports/HHC0308.pdf.
- Elizabeth Wyner, “Controlling the Cost of New York City’s Settlements and Judgments: A Tale of Two Agencies,” The Citizens Budget Commission (blog entry, August 12, 2014), www.cbcny.org/cbc-blogs/blogs/controlling-cost-new-york-city%E2%80%99s-settlements-and-judgments-tale-two-agencies.
- New York City Health and Hospitals Corporation, Basic Financial Statements for Fiscal Years Ending June 30th, 2013 and 2012, p. 8.
- Sally Goldenberg, “Council approved $95M budget shift for labor costs” Capital New York (August 21, 2014), http://www.capitalnewyork.com/article/city-hall/2014/08/8551202/council-approves-95m-budget-shift-labor-costs#.