Keys to a Cap-and-Invest Design That’s Earth- and Economy-Focused
Recommendations for a Cost-Effective Program to Meet New York's Ambitious Climate Goals


EXECUTIVE SUMMARY
To help achieve the Climate Leadership and Community Protection Act’s (CLCPA) ambitious goal to reduce greenhouse gas (GHG) emissions by 85 percent by 2050, New York will implement a Cap-and-Invest (NYCI) program—an economy-wide carbon pricing initiative to reduce GHG emissions and generate funds for energy efficiency and transition efforts.
This form of carbon pricing caps allowable GHG emissions and creates a market in which polluting companies purchase or trade the right to generate limited emissions—thereby offering more flexibility in meeting emissions requirements, incentivizing cost-effective options, and typically generating revenue for climate investments.
While NYCI provides a great opportunity to reduce emissions in a cost-effective manner and fund critical investments strategically, its success depends on it being well designed and implemented. Poor design and implementation could simply shift emissions from New York to other states—thus failing to reduce GHG emissions overall—and impede New York’s economic and job growth. To inform good design, this paper identifies five design goals and seven design parameters. CBC then makes seven recommendations to help ensure the program’s success.
Program Design Goals
New York State is currently designing the NYCI program. Many critical design choices will affect whether and to what extent NYCI is an efficient and cost-effective means to reduce New York’s GHG emissions. Making strategic design choices based on the right goals will help avoid or minimize adverse impacts. CBC identified five program design goals that the State should consider when evaluating design choices:
- Maximize GHG emissions reduction: The primary objectives of Cap-and-Invest are to incentivize the reduction of GHG emissions and use revenue generated to help achieve climate goals;
- Minimize the financial cost to businesses and households: NYCI should be designed such that its climate goals can be achieved without imposing prohibitive direct financial costs that could risk the state's economic competitiveness and strain pocketbooks. Emissions reductions should stem from the lowest-cost decarbonization strategies and efficiency improvements, rather than economic or population declines;
- Prevent emissions leakage: Shifting emissions to another jurisdiction (emissions leakage) could undermine NYCI's environmental benefits and cost-effectiveness by pushing economic activity and its associated emissions elsewhere;
- Minimize adverse economic impacts: NYCI should consider potential wider economic disruptions, such as job loss or instability in emission-intensive industries, to protect against adverse effects and economic stagnation during the energy transition; and
- Maximize benefits to disadvantaged communities: The program should aim to minimize the burden on disadvantaged communities, which are most vulnerable to increased energy costs, while maximizing the economic and environmental benefits within these communities.
Program Design Parameters
- Sectoral and geographic scope: The program’s geographic and sectoral scope plays a pivotal role in determining its potential for emissions reduction and the associated costs. A wider scope can tap into varied emissions reduction opportunities across different regions and economic sectors, potentially lowering costs and reducing the risk of emissions leakage;
- Emissions cap setting: The emissions cap trajectory will significantly influence the pricing of allowances—the permits that allow firms to generate a specified amount of emissions; it will also drive the program’s compliance costs. While a decreasing cap over time is necessary to drive emissions reduction, too steep of a cap decline could escalate the prices of emissions allowances in auctions and the secondary market, thereby raising the financial burden on businesses complying with the program;
- Allowance allocation method: How allowances are allocated in cap-and-invest programs influences the revenue raised and the direct costs borne by firms. The allocation method can also provide tools to mitigate the risk of emissions leakage;
- Price stability mechanisms: Allowance price stability in NYCI will affect businesses’ investment decisions in emissions-reducing efforts. While the program inherently will control the quantity of emissions, a fixed cap can lead to allowance price volatility, posing risks to long-term investments;
- Emitter compliance flexibility: Flexibility options, including allowance banking, carbon offsets, and allowance trading, enhance the scheme's cost effectiveness and predictability. These options aid in smoothing compliance costs over time, incentivizing early emissions reductions, and encouraging emissions reduction in uncapped sectors;
- Revenue management and use: NYCI has the potential to generate billions of dollars in annual revenue that must be managed prudently. Transparent and accountable on-budget appropriation is needed to ensure program-aligned investments. Prioritizing investments in energy transition and efficiency initiatives, along with targeted support for disadvantaged communities, will help reduce political diversions and maintain the integrity of the program; and
- Monitoring, evaluation, and modification: New York’s economy is not identical to those in regions with existing economy-wide, carbon trading programs. While lessons should be learned from the experiences of other programs, some design elements may have different effects here. NYCI’s design should be iterative as needed, with continuous modification informed by evaluation of program data.
Considering these design goals and parameters, to ensure that NYCI is a cost-effective tool for reducing GHG, CBC recommends that the State:
- Allow and pursue linkage with other cap-and-invest programs. Expanding the scope of Cap-and-Invest by linking with other programs enhances cost-effectiveness by providing a larger pool of emissions reduction opportunities and promoting a more robust emissions trading market;
- Keep sectoral coverage as broad as possible. Exemptions from coverage under the program should be limited to sectors that are exceedingly difficult or expensive to regulate. Limiting the sectoral scope of the program could overburden the sectors that are ultimately included. If specific sectors face a greater risk of emissions leakage, a share of allowances could be provided for free to alleviate this risk, but these sectors should still have an obligation to comply with the program;
- Maintain flexibility in compliance through trading, banking, and verifiable offsets. These features are integral to ensuring that the Cap-and-Invest program behaves as a true market, fostering efficient emissions reductions by emulating natural market dynamics and accommodating businesses' varying circumstances and capabilities;
- Allocate revenue on-budget, segregating it for uses that promote cost-effective emissions reduction. Ensuring revenues are accounted for transparently within the State's budget promotes accountability and efficient use of funds toward climate-benefitting initiatives, avoiding wasteful or politically driven spending allocation;
- Regularly monitor, publicly report, and evaluate program data and modify the program based on evidence. Continuous monitoring and evaluation, coupled with transparent reporting, improves accountability, informs necessary programmatic modifications, and facilitates public scrutiny;
- Align the program with other CLCPA-related regulations. Considering other climate policies holistically when designing Cap-and-Invest minimizes overlapping regulatory costs and improves overall policy effectiveness, ensuring that the program complements, rather than conflicts with or inappropriately compounds, other measures; and
- Finalize clear and comprehensive rules with adequate time for businesses to prepare. Businesses need predictability for their compliance strategies and emissions reduction investments. Ensuring timely, finalized regulations can facilitate a smooth carbon market transition.
Meeting New York’s CLCPA goals will be a huge challenge, but a well-designed NYCI should be a valuable component of the State’s strategy to achieve its ambitious emissions reduction targets.
INTRODUCTION
Cap-and-invest is a form of carbon pricing that caps allowable greenhouse gas (GHG) emissions and creates a market for regulated companies to purchase and trade the right to generate emissions, while also yielding revenue that can be invested in climate initiatives.1 Optimally, carbon pricing systems should be implemented at the national or global level, and they should regulate the sources of all emissions across all geographies. When it comes to cap-and-invest, broader is better. Short of the ideal global carbon price, regional and state-level programs, such as New York’s forthcoming Cap-and-Invest (NYCI), provide a pragmatic approach to progress. State- or region-specific carbon pricing schemes play a vital role across the globe in driving emissions reduction in several countries and can serve as laboratories for policy experimentation. Over time they can also be designed to link with other similar programs, broadening their scope and enhancing cost-effectiveness.
New York State is currently designing its cap-and-invest system. It will make many critical choices that will affect whether and to what extent NYCI is an efficient and cost-effective means of driving a rapid reduction of New York’s GHG emissions.
This report provides guidance on how to design and evaluate the effectiveness of NYCI by:
- Providing context and background on the development of cap-and-invest programs;
- Explaining major risks to cap-and-invest programs;
- Identifying the goals that should be used to guide NYCI design choices;
- Describing the design choices that need to be made; and
- Recommending specific design choices and features.
BACKGOUND
The Climate Action Council Identified Cap-and-Invest as Centerpiece to Meeting CLCPA Goals
Alongside objectives for renewable energy production and energy efficiency, New York’s Climate Leadership and Community Protection Act (CLCPA) established statewide goals to reduce GHG emissions: 40 percent reduction by 2030 and 85 percent by 2050, relative to the 1990 emissions levels.2 The law also created the Climate Action Council (CAC), composed of State agency leaders and non-agency members appointed by the Governor and Legislature, to develop a scoping plan outlining potential strategies to meet these goals.3
The CAC’s Final Scoping Plan (FSP), published in December 2022, included dozens of policy options that the State may pursue to reduce emissions, including recommending an economy-wide strategy.4 The CAC considered three economy-wide strategies: a carbon tax, a cap-and-invest program, and a clean energy supply standard. They chose to recommend cap-and-invest because of its potential on two fronts: comprehensively covering emissions from energy production and other economic activities, and providing more certain emissions reduction.
New York is currently developing the rules and regulations for NYCI. Very few details are known; almost all programmatic details of NYCI will be determined by forthcoming regulations developed by the Department of Environmental Conservation (DEC), as directed by the CLCPA.5 The Final Scoping Plan provides some insight into potential design parameters. The FSP envisioned a program that would cover all major sectoral emissions sources that can feasibly be regulated and an emissions cap designed to be consistent with CLCPA emissions limits. Furthermore, the New York State Fiscal Year 2024 Enacted Budget established three distinct accounts within a newly created special revenue fund into which any proceeds raised by NYCI would be transferred.6
The Basics of Cap-and-Invest
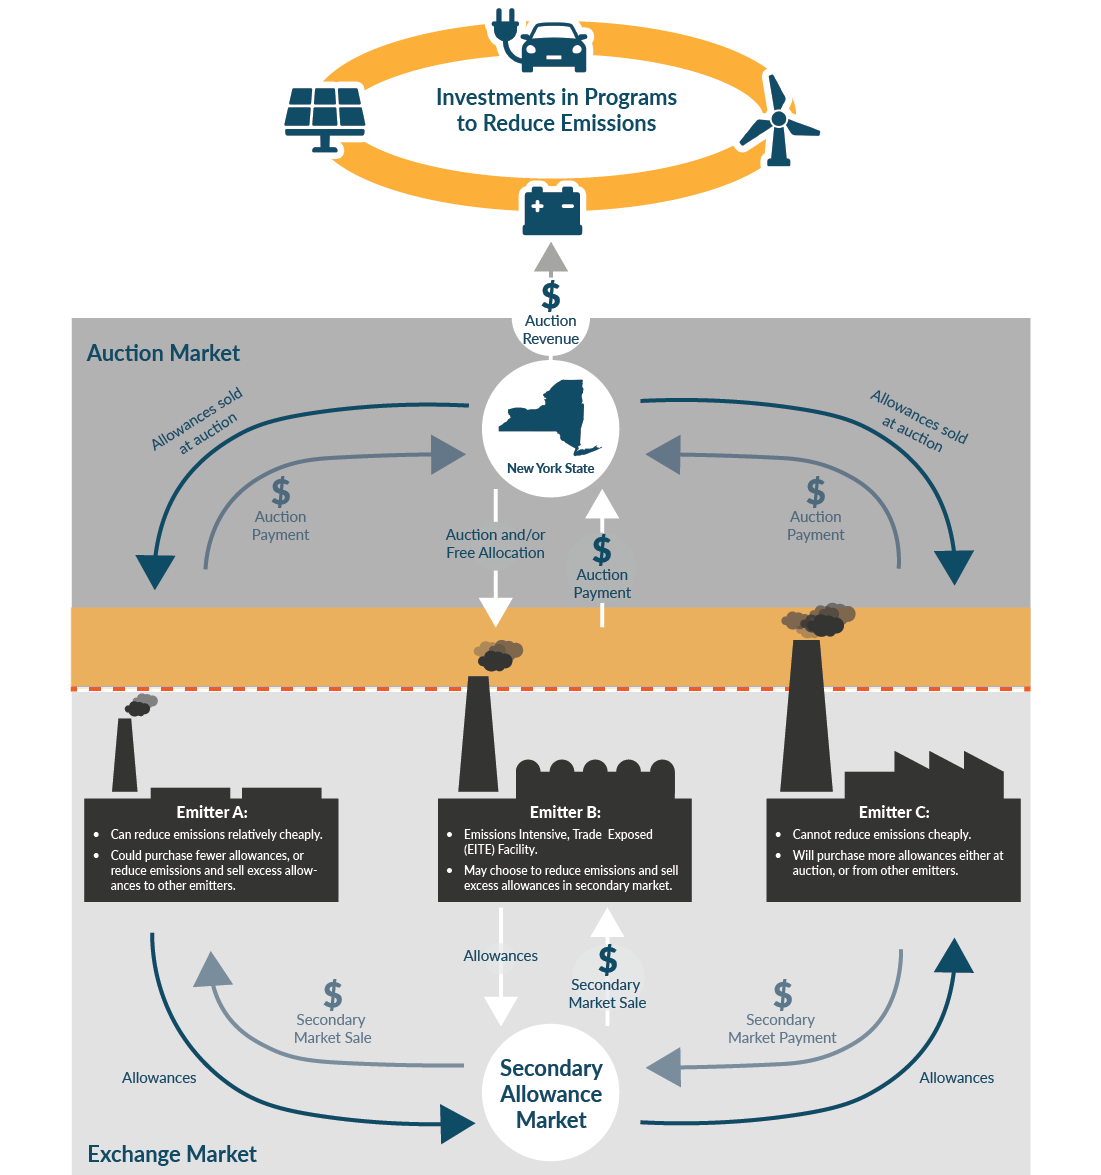
The theory behind cap-and-invest is relatively simple: the State sets a cap on allowable emissions, distributes allowances—the permits that allow firms to generate a specified amount of emissions—to large-scale emitters via auction, and uses the proceeds of the auction (and penalties for non-compliance) to invest in programs to reduce emissions.7 Companies that can reduce their marginal emissions at a lower cost than purchasing allowances will be incentivized to do so, while emitters that cannot reduce their emissions as easily will opt to purchase allowances to cover all of their emissions. (See Figure 1.)
Revenues from the auction can then be allocated to programs supporting climate initiatives, like energy efficiency and renewable energy development, or returned to households to ease the impact of costs. Over time, the emissions cap is gradually lowered, and the incentive to reduce the emissions at the lowest marginal cost persists. If the cost of allowances increases as the cap is reduced, more companies will be incentivized to reduce emissions. Alternatively, the development of new technology could lower the cost of reducing emissions, incentivizing more firms to invest in emissions reduction rather than allowance purchasing.
The advantage of a market-based approach to emissions reduction policy, over one that imposes uniform emissions limits on all companies covered by the program, is that it allows market participants to prioritize the easiest and cheapest emissions to reduce. This will result in a more economically efficient allocation of emissions reduction and reduce the costs imposed on businesses, thereby striking a balance between environmental protection and economic competitiveness. (For a more complete discussion of the theory behind cap-and-invest, see the Appendix.)
Figure 1: Illustration of Cap-and-Invest Mechanism
Successful Early Emissions and Pollution Trading Programs Triggered New Wave of More Comprehensive Cap-and-Invest Systems
Economy-wide emissions reductions policies, including cap-and-invest, are not new. (See Figure 2.) The Clean Air Act of 1970, and subsequent amendments in 1977, included some elements that resemble a trading system framework. But the first major pollutant-trading system to demonstrate applying the theory to practice was the U.S. Environmental Protection Agency’s (EPA) program to reduce lead content in gasoline.8 While the program initially imposed refinery-level limits on the average lead content per gallon of gasoline produced, in 1982 it was adjusted to limit the average lead content across all gasoline sold in the U.S. After this modification the EPA also allowed firms that reduced lead content below limits to generate credits which could be sold to other refineries. The sharp reduction in gasoline’s lead content resulted in substantial health benefits, while the addition of credit trading lowered costs relative to the initial command-and-control form of the regulation.9
Figure 2: Emissions and Pollution Trading History
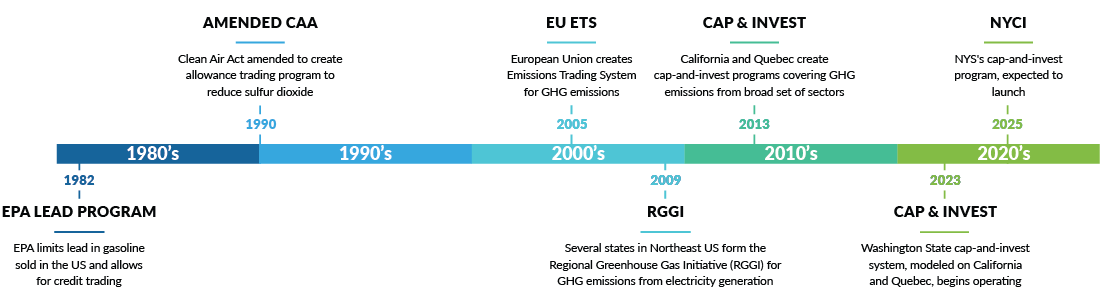
A trading system was also instrumental to the massive reduction of acid rain during the 1990s and 2000s. A 1990 amendment to the Clean Air Act created an allowance trading program similar to the lead phasedown for sulfur dioxide (SO2) emissions from electric power plants. SO2 emissions fell by 40 percent—from 1980 levels— by 2000 under the program, and at a cost that was 50 percent lower than what could have been achieved under an equivalent command-and-control regulation.10
The cap-and-invest model was first applied to carbon emissions when the European Union (EU) established its Emissions Trading System (ETS) in 2005; that program still covers the largest share of global emissions. (See Table 1.) The ETS covers emissions from power generation facilities, heating fuel installations, certain high-emissions industrial facilities, and as of 2012, emissions from the aviation sector as well.11
Then in 2009, several Northeastern US states (including New York) jointly created the Regional Greenhouse Gas Initiative (RGGI), a regional emissions trading system that covers emissions from electricity generation.12 California and Quebec both created state- and province-level GHG cap-and-invest systems in 2013.13 These two trading systems have a much greater scope than RGGI, covering emissions from power generation, heating fuels, industrial activities, and transportation fuels. Most recently, Washington began operating its cap-and-invest program in spring 2023, modeled closely on those used in California and Quebec.14
Table 1: Existing Cap-and-Trade Systems
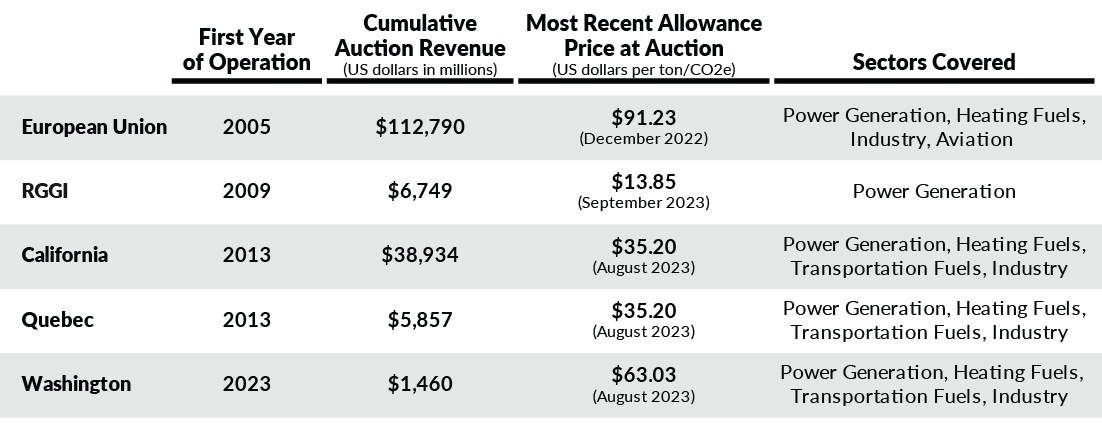
Foreign currencies were converted to US dollars using 2022 average exchange rates. Allowances for all programs represent a permit to emit 1 ton of carbon dioxide equivalent emissions. There are a few other national emissions trading systems in China, South Korea, New Zealand, and Kazakhstan, and pilot programs elsewhere, that were excluded because they do not have a typical emissions cap, they have not begun fully operating, or program data are not accessible. New York's share of cumulative RGGI revenue is $2.1 billion. Quebec and California share a joint allowance market; allowances sold in one region could be used for compliance in the other. The European Union cumulative auction revenue figure is the total for the common auction platform, which excludes Germany and Poland, both of whom operate independent auctions.
European Commission, "Auctions by the Common Auction Platform – October, November and December 2022" (accessed April 19, 2023); The Regional Greenhouse Gas Initiative, Inc., "Auction Results" (updated September, 2023); California Air Resource Board, "California Cap-and-Trade Program: Summary of Proceeds to California and Consigning Entities" (updated June, 2023), and "Summary of California-Quebec Joint Auction Settlement Prices and Results" (updated August 2023); Québec Ministère de l’Environnement, de la Lutte contre les changements climatiques, de la Faune et des Parcs, "Auction Proceeds Allocated to the Electrification and Climate Change Fund" (updated May, 2023); Washington Department of Ecology, "Washington Cap-and-Invest Program Auction #3 August 2023 Public Proceeds Report" (September 27, 2023).
RISKS TO PROGRAM EFFECTIVENESS AND PROGRAM DESIGN GOALS
Emissions Leakage and Related Adverse Economic Impacts Can Threaten Effectiveness of Cap-and-Invest Programs
Cap-and-invest programs impose new direct or indirect costs on businesses and individuals. In response, those businesses or individuals may seek to avoid costs by looking beyond the borders of the cap-and-invest program. This is called leakage; economic activity continues elsewhere but avoids emissions reduction policies. When leakage occurs, it appears that emissions reductions have taken place, but they have simply been exported outside the borders of the program.
Local or regional cap-and-invest programs are highly susceptible to emissions leakage, which severely undermines both the intended goals and the economic competitiveness of the regulated region. Therefore, it is essential to counteract and minimize emissions leakage.
Leakage occurs in two main ways: 1) regulated firms pass costs to consumers through prices, and demand shifts to cheaper, unregulated alternatives within the region or to lower-priced goods produced outside the region; and 2) regulated firms relocate or choose not to invest in further operations in the regulated region. These changes in demand and business investment decisions can adversely affect local labor market outcomes, particularly in the manufacturing sector and in energy-intensive industries.15
Leakage can affect all emissions trading schemes to some degree, but it is a pronounced threat to the effectiveness of RGGI due to its confinement to the electricity generation sector. Given the interconnected nature of electricity grids, power generated in non-member states can replace generation in member states when their relative costs change. It is difficult to measure leakage, but clearly some occurs. For example, one analysis estimated that between 43 percent and 86 percent of emissions reductions benefits within the RGGI region were offset by increased emissions in neighboring states.16 Two of the states included among the neighboring states in the study where emissions move—Pennsylvania and Virginia—have since joined RGGI, although neither state is fully future participating in the program due to ongoing court action and other factors.17
Program Goals to Guide the Design of a Successful Cap-and-Invest Program
NYCI’s primary objective is to reduce greenhouse gas emissions by increasing costs to emit GHGs and spending the proceeds to facilitate further emissions reductions. These higher costs are spread across the economy, and the program must be designed well to prevent possible unintended adverse effects.
The CLCPA’s emissions reduction goals are ambitious and laudable. But a NYCI program that results in untenable costs to businesses and individuals could be counterproductive. Designing and implementing a program that is cost effective and successfully achieves its environmental objectives will be a delicate balancing act. If emissions reductions are pursued too aggressively, the high costs would threaten the economic competitiveness of the state, potentially leading to an increase in emissions leakage as businesses seek more favorable operating conditions or cheaper materials. Conversely, a program that sets only modest emissions limits and imposes no costs would not provide effective incentives. Striking a balance creates a path for a successful transition to a low-carbon future.
Five critical goals should be considered when assessing the design choices and proposed NYCI program.
- Maximize GHG emissions reduction: Cap-and-Invest is likely to be the primary regulatory vehicle for accelerating GHG emissions reduction in New York. The success of the program will largely hinge on how effectively it incentivizes the mitigation of emissions that can feasibly be reduced. However, there are practical limits to what can be achieved, especially in the near-term, due to technological constraints and the availability of low-emissions energy.
- Minimize the financial cost to businesses and households: Regulators should consider how much the program will cost businesses and households, to avoid putting New York’s economic competitiveness and affordability at risk. Pushing to achieve overly aggressive environmental goals would result in substantial and unproductive direct financial costs. Emissions reductions should be brought on by the lowest-cost decarbonization, energy efficiency, and conservation strategies, rather than being the result of declines in economic activity or population.
- Prevent emissions leakage: NYCI’s environmental benefits and cost-effectiveness could be undermined if emissions leakage is not adequately limited. If the emissions reduction targets are set too aggressively, economic activity, jobs, and emissions could be pushed out of the state to neighboring regions with less stringent regulation.
- Minimize adverse economic impacts: Beyond the direct financial costs, wider economic disruptions such as reduced employment or instability in emission-intensive industries must also be considered. The program should aim to prevent these adverse effects to ensure that the energy transition does not come at the cost of economic vitality.
- Maximize benefits to disadvantaged communities: Low-income households spend a greater share of their income on energy, making them more vulnerable to the costs imposed by a cap-and-invest program. At the same time, disadvantaged communities are likely to feel more of the effects of emissions. NYCI should (and is required to) minimize the burden imposed on the communities that are most sensitive to increased costs of necessities, like home heating and transportation, and maximize economic and environmental benefits within those communities.
Cap-and-invest incentivizes emissions reduction precisely by imposing costs that will reverberate throughout the economy. There is an inherent give-and-take among the goals—one goal cannot be maximized without compromising another. Design choices should be made to balance these goals, appropriately making the inevitable trade-offs.
PROGRAM DESIGN PARAMETERS
NYCI design choices will affect how well the program’s balance between goals is struck. CBC’s review of the literature and existing programs identified seven parameters that will be critical to NYCI’s success.
Sectoral and Geographic Scope
NYCI will be designed to cover a range of economic sectors, and its rules will determine whether it can be expanded geographically. The geographic and sectoral scope of a cap-and-invest program significantly affects both its emissions reduction potential and imposed costs. An emissions-trading system with broad coverage will be able to tap into a wider array of emissions reduction opportunities that can be achieved at a lower cost, because the tools available to reduce emissions vary across economic sectors or across regions. Including more jurisdictions can also help to reduce the risk of emissions leakage, which arises when regulatory conditions differ among regions. Including more sectors is preferable, as it spreads the cost of emissions reduction, minimizing the financial burden on any single sector.
One path to expand the geographic scope of a state-level cap-and-invest program is designing the program to facilitate linkage with other state or regional systems. For instance, the cap-and-invest systems of California and Quebec are linked; they conduct a joint auction for emissions allowances, and businesses can trade allowances purchased in one region for compliance in the other.18 Allowances allocated in each region hold the same standardized emissions value—one metric ton of carbon dioxide equivalent emissions (CO2e). Washington recently announced plans to pursue linkage with these systems.19 The linkage of trading systems is not a trivial task; it requires consistency across regulatory actions that are typically developed independently.
Designing the new system to allow for geographic linkage would yield great benefit. Alternatively, New York could pursue expansion of the scope of its current regional system, RGGI, to include emissions from sectors beyond electric power generation. In addition to its broader geographic scope, RGGI already has the necessary regulatory infrastructure in place to administer allowance allocation, and it would benefit from sectoral expansion, which could potentially reduce the program's leakage.
NYCI should include as many sectors as is feasible, providing more opportunities for reduction and helping to spread the cost of emissions reduction rather than concentrating the financial burden on a subset of sectors. Including some sectors may be a challenge due to the difficulty in precisely tracking the amount and source of emissions or because of jurisdictional legal reasons their emissions cannot be regulated by the State. The FSP and recent stakeholder webinars have highlighted this constraint and suggested separating sectors or businesses into those that have a compliance obligation and those that do not.20 The program should consider these exclusions from compliance obligations with caution. If those without compliance obligations are substantial emitters and NYCI is designed so that sectors required to comply must reduce emissions to compensate for those who do not, achieving the program’s emissions reduction targets may not be feasible or may well overburden sectors required to comply, risking unforeseen economic consequences.
GHG Emissions Accounting and Linkage
New York's CLCPA employs a unique method for GHG emissions accounting, utilizing a Global Warming Potential (GWP) over a 20-year horizon (GWP-20) and including emissions from electricity imported from other states, exported waste management services, and from biogenic sources. The GWP-20 accounting method emphasizes the short-term impacts of greenhouse gases and is particularly sensitive to gases like methane that have a higher warming potential but shorter atmospheric lifespan.
By contrast, the most commonly used standard for GHG accounting, including by the Intergovernmental Panel on Climate Change (IPCC) and cap-and-invest systems in California, Quebec, and Washington, is the GWP over a 100-year horizon (GWP-100). The GWP-100 metric places more emphasis on the long-term effects of GHGs and is less sensitive to short-lived gases like methane.
The alternative emissions accounting methodology employed in New York's climate policy could complicate linking NYCI with other state-level emissions trading systems. Linkage would require coordination and agreement on GHG accounting standards. Using different emissions accounting methods would make the value of emissions allowances in different jurisdictions not equivalent, severing a fundamental aspect of linked cap-and-invest systems. While the State uses GWP-20 for other CLCPA statewide emissions limits, designing NYCI using the same emissions accounting framework as other states would make it easier to facilitate linkage with other cap-and-invest systems, although it also would create an inconsistency among New York’s various programs.
Emissions Cap Setting
The level of the initial emissions cap and its trajectory over time will play a large role in shaping the price of allowances and the cost of compliance with NYCI. To incentivize investment in emissions reduction, the cap must decline over time. A steeper decline increases the rate of emissions reduction, but also likely leads to a higher price of emissions allowances in auctions and in trade, increasing the financial cost imposed on businesses complying with the program.
When the earliest cap-and-invest systems were implemented, GHG emissions data were less widely reported.20 There was a high level of uncertainty both for businesses trying to comply with programs, and for regulators designing the emissions cap. Because of this uncertainty, some systems set their emissions cap and allocated allowances too conservatively, resulting in very low allowance prices and an ineffective incentive.21 In other instances, such uncertainty resulted in significant price volatility in the allowance market. While emissions reporting has become more common now, it is crucial for regulators to ensure sectors with a compliance obligation start their emissions accounting and reporting before the program commences, and opt for caution when setting the initial emissions cap to avoid unnecessary volatility.
Changes to the trajectory of the emissions cap over time have coincided with increased allowance prices in existing cap-and-invest programs. From 2015 to 2020, California’s emissions cap declined by 3.0 to 3.5 percent annually, with the rate of decline increasing annually.23 During this time, the settlement price of allowances increased slowly from $12 to $17, barely exceeding the price floor at most quarterly auctions.24 When the annual rate of decline increased to over 4.1 percent in 2021, the auction settlement price diverged from the reserve price, reaching $28 by the end of the year, and $35 at the most recent auction. A similar pattern occurred under RGGI. Prior to 2013, the auction settlement price rarely exceeded $2, and emissions from covered power facilities consistently measured well below the cap. Subsequently, increases in the annual cap reduction rate coincided with hikes in the market clearing price, most notably in 2021 when the annual decline increased from 2.5 percent to 3.0 percent and allowance prices increased to their current level of around $13.25
While these allowance prices may not necessarily be prohibitively expensive, it is critical to closely monitor the relationship between the cap decline and allowance prices, as well as any adverse impacts ensuing from these changes. Gradually increasing the cap decline over time can help mitigate the risk of allowance price spikes and prevent unnecessary risks for businesses strategizing their compliance approach.
Allowance Allocation Method
NYCI regulations must determine how the program will allocate allowances. While that is almost certain to include an auction, it could also include various methods of free allocation. Early cap-and-invest programs, including the European Union ETS, primarily allocated allowances for free to regulated businesses. Over time this has changed; most existing emissions trading systems now utilize auctions to allocate most emissions allowances, while distributing a portion for free to alleviate leakage risk or consumer costs. The benefits of allocation by auction from the perspective of governments is obvious: cap-and-invest can generate substantial revenue. Since it began operating in 2013, California’s system has generated more than $38 billion.
There are reasons beyond the revenue generating potential that auctions may be preferable, though. While allocation via auction means that all firms covered by the program will bear a direct cost for their emissions, firms still face costs under a regime in which allowances are allocated at no cost. When allowances are allocated for free some market participants will still face a direct cost by purchasing allowances from other companies, and others face an opportunity cost—companies must decide whether to use allowances to comply with the policy, or instead reduce their emissions and sell excess allowances to generate revenue. Several analyses indicate that when the European carbon market allocated allowances for free to electric power companies, the implicit opportunity cost of those allowances was largely passed through to consumers in the form of higher electricity prices.26 If costs are likely to be imposed on households regardless of the allocation method, the opportunity to reinvest proceeds in programs that induce further emissions reduction—like investment in renewable energy generation, energy efficiency subsidies, or transit improvements—may advantage auctions over free distribution.
Cap-and-invest systems that utilize auctions may also retain free distribution for firms or sectors that are especially exposed to the risk of emissions leakage and knock-on economic effects. These sectors are typically characterized as Emissions-Intensive, Trade-Exposed (EITE) industries. Firms in EITE industries face a higher energy cost as a share of their total production cost and face greater exposure to competition from regions with less stringent emissions regulation. Because of this, it is more difficult for them to pass the cost of emissions allowances onto consumers. If left unaddressed, the risks these industries face could result in loss of jobs or reduced investment in the regulated region.27
While initially free allocation of emissions allowances in many cap-and-invest systems was based on a firm's historic emissions levels, many have now shifted to allocate allowances to EITE industries based on production or production efficiency.28 Under both emissions-based and production-based allocation, businesses may be awarded more allowances as output increases. However, under production-based allocation, businesses are incentivized to improve the efficiency of their production because it would allow them to sell excess allowances to other businesses and may more effectively mitigate leakage concerns.29
Price Stability Mechanisms
NYCI’s design can also affect the volatility of allowance prices in the market. Cap-and-invest gives the government some certainty over the level of emissions within the scope of the program, but the price of allowances will be variable. Allowance price volatility is a concern because it adds risk to the decision to invest in technologies that could reduce emissions—especially investments that have high upfront fixed costs.30 Extreme allowance prices on the high end raise the costs imposed on businesses and households. While businesses may be primarily concerned with high allowance prices, sudden price swings may discourage them from making investments if they expect the cost of compliance in the long-run to change. An excessively low allowance price indicates that the supply of allowances (the emissions cap) may closely mirror, or exceed, market demand for allowances, meaning there’s a weak incentive to invest in emissions reduction. Mechanisms to rein in excessive auction volatility and price extremes can mitigate these risks.
Cap-and-invest systems use several related tools to limit extreme allowance prices on the high end and low end. Cap-and-invest systems in California, Quebec, and Washington include cost containment reserves (CCRs)—a supply of emissions allowances that is set aside in the market and only released when the auction settlement price exceeds a specified threshold. These reserves serve as a pressure valve, alleviating upward price pressure in the allowance market. The CCR of the joint California-Quebec market has two threshold tiers, adding an extra layer of defense against spiking allowance prices.31 These carbon markets also include an auction reserve price, or a price floor, which restricts auction bids below a predetermined level. Both the cost containment reserve and auction reserve prices in these markets increase annually to accommodate inflation and the declining supply of allowances available each year.32
RGGI’s carbon market similarly uses a CCR mechanism to alleviate allowance price volatility, but in 2021 the system also introduced an emissions containment reserve (ECR) in addition to the hard price floor they and other American emissions trading systems often employ. The ECR functions in the opposite manner of a CCR, automatically removing allowances from the auction if the settlement price is below a predetermined level and effectively lowering the emissions cap of the program.33
The European Union ETS instead utilizes a market stability reserve (MSR), which adjusts the quantity of allowances made available in future auctions based on the circulation of unused allowances already in the market: if current allowance circulation is relatively high, allowances are removed from future auctions and placed in the MSR; if circulation is low, additional allowances are released from the MSR in future auctions.34 Recent research has suggested that the MSR may actually increase uncertainty about future price and cap levels in the ETS; thus a containment mechanism triggered by price thresholds may more effectively alleviate volatility concerns.35
In practice, price stability mechanisms are seldom invoked, but they give participating businesses greater certainty over a range of possible compliance costs. Reduced allowance price volatility reduces the risk for businesses that must comply with the program and enhances the predictability of revenue generation.36
Emitter Compliance Flexibility
Providing emitters with various ways to achieve compliance can improve the overall cost-effectiveness of NYCI without compromising its objective of emissions reduction. Allowance trading, carbon offsets and allowance banking can help to lower compliance costs and enhance the efficiency of the program. These flexibility mechanisms allow the artificial market created by the cap-and-invest program to emulate real market behavior. This can help to ensure that sudden changes in the market don't lead to extreme price volatility, making the program more predictable and manageable for participating businesses. This adaptability has been key to the success of existing emissions trading systems.
The ability to trade allowances is perhaps the most important form of flexibility in a cap-and-invest system. Disallowing the trading of allowances in a secondary market outside of the auction, as was proposed in the Senate’s fiscal year 2024 one-house budget, would introduce an additional layer of uncertainty, and likely result in higher compliance costs.37 Without intra-compliance period trading, companies would need to acquire enough allowances during auctions to fully cover their emissions. If they fail to acquire sufficient allowances, they would be unable to compensate through trading. Consequently, companies with a compliance obligation might bid for more allowances in the auction than they would otherwise, potentially driving up the settlement price.
Allowance banking gives regulated businesses the opportunity to save their unused allowances for future use. Banking can help to smooth the cost of compliance over time, alleviating uncertainty that arises due to the variability of the cost of reducing emissions year-to-year due to fluctuations in fuel prices, changes in consumer economic conditions, or the development of new technologies.38 Allowance banking also encourages early emissions reductions, as firms that reduce their emissions below their cap in the early years can bank those allowances for use in later years when the cap becomes more stringent. Several existing cap-and-invest systems also allow implicit borrowing of emissions allowances by employing a multi-year compliance period and only requiring a portion of businesses’ compliance obligation be met in the early years within a period. The flexibility provided by multi-year compliance is likely not sufficient for smoothing all cost-shocks and would thus provide limited value unless paired with other mechanisms.39
Carbon offsets can also be a valuable flexibility tool in a cap-and-invest program. Offsets allow regulated entities to meet a portion of their compliance obligation by investing in or purchasing emission-reduction credits from projects outside of the capped sectors. These might include forestry projects or agricultural practices that sequester carbon, or methane capture from landfills. If the agriculture and waste sectors are not required to comply with NYCI, creating a secondary market for offsets could incentivize these sectors to improve their efficiency. Offsets can provide an affordable alternative for compliance, but they have been the subject of frequent scrutiny due to concerns that the emission benefits they generate would have occurred regardless of investment in the credited activity.40 Research on offsets does indicate establishing equivalency of offset projects to more direct emissions reduction is a challenge.41 Despite their imperfection, offsets can provide a real value, especially in the near term when strategies to reduce emissions are more limited. The CLCPA addresses these concerns by requiring that DEC verify that any emissions offsets used to comply with environmental regulation are, “real, additional, verifiable, enforceable, and permanent.”42
The cap-and-invest programs in California and Washington have developed offset protocols that define the types of projects that are permitted to sell credits and ensure credits are quantifiable and verifiable.43 These standards may reduce the number of offsets available to carbon market participants, but ensuring the quality of offsets is critical to maintaining the legitimacy and environmental effectiveness of the program.44 Offsets can also be used for a small share of firms’ compliance obligations under RGGI, but the relatively low price of allowances in this market justifies little use.45 From 2009 to 2020, no firms in New York with a compliance obligation submitted offset credits.46
Tradeoffs from Limiting Flexibility
The possibility of including a trading mechanism in NYCI, rather than setting facility-specific caps in the program, has drawn scrutiny. This is largely out of concerns that polluters in or near Disadvantaged Communities (DAC) would be able to continue polluting, and instead simply buy allowances and maintain their current emissions levels. Historically, these communities have often been disproportionately exposed to air and water pollution, giving reasonable rise to this concern.
One proposed path to alleviating these concerns is limiting trading into and out of DACs, or assigning facilities in these communities their own emissions caps. These conditions have not been tested in existing economy-wide cap and-invest programs, but a report recently released by Resources for the Future tests what the results might be of applying a similar change to the California Cap-and-Trade program.
The report authors estimate how the carbon market would have performed differently in the past if emissions sources in DACs were given a facility-specific cap requiring them to reduce emissions proportional to the overall cap. Under the individual caps, these facilities would have been required to reduce their emissions more than they did under the economy-wide cap. Consequently, they would then purchase fewer allowances in the market. With more allowances available to other facilities in the market, those without individual caps would be able to generate more emissions. To mitigate this inter-facility leakage, the program-wide emissions cap would need to shrink to maintain the same incentive to reduce emissions. The authors estimate that the reduction required would result in approximately a 3 percent increase in the price of allowances in the market.
This allowance price increase could be passed on to households. This example highlights the inherent tension between different objectives of cap-and-invest; facility-specific targets may well protect DACs from some additional burdens, but limiting flexibility in this way would also result in greater costs.[47]
Revenue Management and Use
Ensuring the transparent, accountable, and efficient use of the revenue generated is critical to the success and legitimacy of a cap-and-invest system. If auction prices are similar to those in the state-level cap-and-invest systems in California and Washington, NYCI could generate billions of dollars annually.
Research on carbon pricing revenue primarily focuses on comparing the distribution and efficiency of various revenue uses, such as offsetting reductions in other government revenue sources (like income or payroll taxes) or returning the proceeds to consumers in the form of lump-sum rebates. In general, there is a trade-off between economic efficiency and progressivity—rebates are more progressive but less efficient than reducing distortionary taxes.48 However, most existing cap-and-invest programs direct revenue to other uses.
Even with mechanisms in place to limit allowance price volatility, revenue generated is likely to be variable. Since 2016, California’s annual auction proceeds have ranged from less than $900 million to more than $4 billion.49 This variability does not lend itself to replacing more steady revenue sources in state budgets when spending is often recurring and relatively stable.
Instead, state cap-and-invest programs dedicate most revenues to investments in other state climate and energy programs. Revenues generated by the California program are appropriated by the state legislature to the Greenhouse Gas Reduction Fund. Currently, 65 percent of these proceeds are distributed to State agencies to support transportation projects like local and regional public transit and high-speed rail, as well as community programs like drinking water infrastructure upgrades and affordable housing projects.50 Remaining revenue is appropriated to similar programs during the budget process. Washington similarly earmarks auction proceeds for related purposes, with all revenues distributed across a Carbon Emissions Reduction Account, Climate Investment Account, and an Air Quality & Health Disparities Improvement Account. Reinvesting revenues generated by cap-and-invest in programs that target emissions reduction could reduce the financial burden imposed by the policy. Investments in energy efficiency programs, development of renewable energy infrastructure, and incentives for the adoption of clean technologies would reduce the cost of emissions abatement for businesses.
Appropriating and accounting for program revenues on budget promotes transparency, public oversight, and accountability. However, when funds become part of the regular budget process, they become more susceptible to capture and diversion. For example, New Yorkers have seen revenues from the Health Care Reform Act (HCRA)–a $6 billion pot of special revenue generated chiefly by taxes on health insurance–slowly drift from their intended purposes. Whereas HCRA was intended to generate proceeds from insurers to invest in public health programs and support safety net providers, it has effectively become a flat tax on all New Yorkers to pay for billions in costs that would be more appropriately financed through broad-based, progressive taxes.51
Revenue capture is common with new revenue sources. Marijuana taxes were once floated as a solution to close operating gaps at the Metropolitan Transportation Authority. While “weed for trains” did not come to pass, all marijuana revenues were dedicated with a large share captured for education spending.52 This example provides a cautionary tale of the ease with which new revenues can be captured and spent in other areas.
NYCI revenues should not be used for politically catchy purposes. NYCI will maximize its environmental benefits if all of its revenues are invested into achieving the goals of the program–primarily energy decarbonization and efficiency, but also targeted direct support for disadvantaged individuals and communities. These appropriations should be strictly limited to administrative and evaluation costs, critical environmental adaptation needs like resiliency infrastructure, and investments that ease the cost of emissions reduction, such as energy efficiency programs, low-carbon energy infrastructure investments, and workforce training in skills needed to facilitate the energy transition. This will be a difficult balance to strike but can be achieved through strategies such as fully appropriating the revenues as one pot to be spent by DEC and other agencies and authorities within clearly defined statutory guidelines.
Monitoring, Evaluation, and Modification
All existing GHG emissions trading systems began operating in the last two decades, and significant changes have been made to all of their structures since being implemented. While evidence supports many of the design parameters discussed in previous sections, it is limited by the short time these policies have been in operation and the unique environmental and economic characteristics within each region. It is crucial that robust monitoring and evaluation mechanisms be incorporated with cap-and-invest to assess the program’s performance over time and inform any adjustments to the program as necessary.
Analyzing the liquidity of the market, the price volatility of allowances, and exchange patterns would provide crucial information on the functioning of the market and indicate whether any modifications are needed. Auction proceed reports published annually by the California Air Resources Board include data on funding allocations, and estimated GHG reductions from programs funded by the state’s cap-and-invest at the program level. These reports could serve as a model for similar reporting in New York but could be further improved with greater granularity by providing project-level performance data.53 RGGI publishes firm-level emissions and auction participation data in its CO2 Allowance Tracking System, including a breakdown of standard allowances and offsets used to comply in each period.54
Emissions, productivity, trade, and employment data within sectors covered by a cap-and-invest program could be used to evaluate the risk of emissions leakage and adverse impacts on economic competitiveness. Furthermore, the effects of the program on energy prices and the resulting impacts on businesses and households, especially in vulnerable and disadvantaged communities, should also be monitored closely.
RECOMMENDED CAP-AND-INVEST DESIGN FEATURES
While the Cap-and-Invest program proposed by the State could reduce emissions more cost-effectively than other regulatory approaches, its success will depend greatly on its design. Efforts to make the program more stringent by limiting trading of allowances, or imposing source-specific emissions limits, while well intentioned, would ultimately increase the costs imposed on New Yorkers and may exacerbate emissions leakage and economic competitiveness risks.
It is important to also recognize NYCI would not exist in a vacuum. NYCI is a central component of New York’s efforts to reduce emissions, but alone, is unlikely to ensure CLCPA goals are met. If additional regulations are pursued that include facility-specific limits or energy standards, the interaction with cap-and-invest could render it less cost-effective. Traditional regulatory standards could require some firms to reduce their emissions beyond what they otherwise would have under only cap-and-invest. This would reduce demand in the allowance market, pushing down prices and undermining the incentive for businesses only covered by cap-and-invest to reduce their emissions. Facility-specific regulations may still be appropriate if there are local health impacts or other negative externalities not adequately covered by the emissions market.55
CBC recommends the State follow these approaches when designing the Cap-and-Invest program:
- Allow and pursue linkage with other emissions trading programs. While a national cap-and-invest program that covers all economy-wide emissions is optimal, broadening the scope of Cap-and-Invest beyond the boundaries of New York, by linking with other programs, would enhance the program’s cost-effectiveness by providing a larger pool of emissions reduction opportunities. The State should ensure that NYCI regulations are designed to be consistent with emissions trading systems in other states to enable future linkage.
- Keep sectoral coverage as broad as possible. NYCI should cover emissions from as many sectors as is feasible. Exceptions should only be made if inclusion is exceedingly difficult or expensive to administer. Excluding certain sectors could shift the entire burden of reducing economy-wide emissions onto sectors with a compliance obligation. Sectors that face a greater emissions leakage risk could instead be given a share of allowances for free to alleviate this risk, but they should still have an obligation to comply with the program.
- Maintain flexibility in compliance through trading, banking, and verifiable offsets. An efficient Cap-and-Invest program should provide businesses with multiple options for compliance to accommodate the differences in their conditions. Trading should not be restricted; limiting this critical component of cap-and-invest would add uncertainty to the market, and potentially drive up the price of allowances without increasing the environmental benefits of the program. Permitting banking of allowances can encourage early emission reductions and help companies smooth out their compliance costs over time. Allowing the use of verifiable offsets to meet a portion of firms’ compliance obligation can reduce the cost of compliance and incentivize emissions reduction in non-regulated sectors.
- Allocate revenue on budget, but free from capture. Revenues generated through NYCI should be included and appropriated within the State's regular budget process, as other taxes and fees are within the financial plan, to promote transparency and accountability and ensure that funds are not spent wastefully. Furthermore, this revenue should be allocated to costs related to administering and evaluating the program, and investments that further the goals of the program, such as energy efficiency programs, development of low-carbon energy infrastructure, and incentives for the adoption of clean technologies. These investments can accelerate the transition towards a low-carbon economy, reduce the burden of compliance costs, and deliver additional environmental and economic benefits. The revenue generated by NYCI should be free from capture and diversion to short-sighted spending endeavors and unrelated political priorities.
- Regularly monitor, publicly report, and evaluate program data and modify the program based on evidence. Effective monitoring and evaluation are key to the success of the Cap-and-Invest program. Regularly reporting on the program outcomes, including emissions reduction progress, the functioning of the allowance auction and secondary market, and the use of auction revenues, can ensure transparency, accountability, and inform adjustments to improve NYCI. Data collected from auctions and programs receiving revenue should be publicized to allow for adequate public scrutiny.
- Align the program with other regulations implemented in accordance with the CLCPA. Any additional climate policies that may be pursued to meet CLCPA goals should be considered holistically when designing Cap-and-Invest to minimize overlapping regulatory costs and improve overall policy effectiveness. This approach can help ensure that the program complements rather than conflicts with, or inappropriately compounds the costs of, other measures.
- Finalize clear and comprehensive rules and give adequate time for businesses to prepare. Predictability and certainty are necessary for businesses to plan their compliance and emissions reduction investments. Finalizing clear and comprehensive rules in a timely manner can reduce uncertainty and facilitate a smooth transition for the carbon market. The State should finalize regulations well in advance of the first compliance period.
CONCLUSION
Most public interventions to accelerate the pace of GHG emissions reductions will cost money. The approach taken will dictate the level of these costs, and who pays them, be it through a direct tax, through utility rate setting, or the prices of goods and materials households and businesses use every day. Given the enormity of the efforts required to meet CLCPA goals, New York should pursue the most cost-effective strategies available and consider who pays the costs and feels the impacts.
Only so much can be done to address climate change within the borders of an individual state; less than 3 percent of US GHG emissions come from New York.56 The scale of the problem necessitates greater national and global cooperation. The State should pursue cross-border collaboration where possible. A well-designed NYCI program—one that recognizes the wide ranging environmental and economic effects of carbon pricing and is structured to realize the benefits of a market-based approach to emissions reduction—could lead to needed progress in meeting New York’s ambitious climate goals.
APPENDIX
The Economics Behind Cap-and-Invest: Internalizing Externalities
Cap-and-invest is a form of carbon pricing that seeks to reduce greenhouse gas emissions by utilizing market mechanisms. Carbon dioxide and other GHG emissions are perhaps the quintessential example of negative externalities. They are the byproduct of the production or consumption of goods which generate costs borne by someone other than the consumer of said goods. These costs incurred by parties outside of the transaction are not accounted for in the transaction. The combustion of gasoline in cars or natural gas to heat homes generates greenhouse gases that accumulate in the atmosphere and can contribute to the warming of the Earth for hundreds of years. The costs of global warming are experienced globally, not just by the person commuting to work or turning up their air conditioning. Carbon pricing policies like carbon taxes and cap-and-invest are intended to correct this imbalance, internalizing the externality.
A carbon tax seeks to make this correction more directly by levying a fee on the price of goods based on the emissions involved in their production or consumption. When societal costs are internalized in the prices individuals pay, demand shifts away from emissions-intensive products to alternatives. Cap-and-invest on the other hand establishes a price on carbon indirectly by setting a cap on legally allowable emissions that declines over time within an economy, and creating a regulated market in which emitting companies could purchase and trade the right to emit GHGs. Assuming there are no significant transaction costs within the market, this trading system is likely to result in an efficient allocation of emissions allowances—companies that can reduce their emissions at the lowest cost would choose to do so rather than purchase allowances, such that the emissions cap enforced on market participants is not exceeded.57 Traditional command-and-control regulations that limit pollutants or emissions at the individual source level can result in a higher average cost of emissions abatement because they lack this flexibility.
The Social Cost of Carbon and Benefits of Climate Action
The Social Cost of Carbon (SCC) is a tool employed by policymakers to estimate the present discounted economic damages associated with an increase in GHG emissions in a given year. This estimate, which is typically expressed in dollars per metric ton of carbon dioxide emitted (or CO2 equivalent), encompasses a range of potential impacts, such as changes in net agricultural productivity, health effects, property damages from increased flood risk, and changes in energy system costs.
In the context of New York's Climate Action Council's (CAC) scoping plan, the SCC plays a pivotal role in the Integration Analysis, which models the costs and benefits of high-level scenarios under which the goals of the CLCPA could be met. The “cost” side of this equation is conceptually straightforward, representing the estimated investment required to meet the outcomes envisioned in the scenarios. The “benefit” side, however, warrants a closer look. Approximately 60 percent of the calculated benefits were derived by multiplying the State’s SCC value by the expected emissions reduction in each scenario.
It's crucial to understand, however, that the “benefits” calculated through the SCC reflect global, not just local, benefits. This means that while the SCC is helpful for recognizing the broader societal value of emissions reductions, it doesn't directly translate to local savings or benefits.
In the context of the CAC's scoping plan, this means that while the estimated benefits may exceed the estimated costs, this does not imply that the state will save money in the long run from investments in meeting CLCPA goals. Most of these benefits represent avoided global societal costs rather than direct financial savings to New York.
Cap-and-Invest System Designs
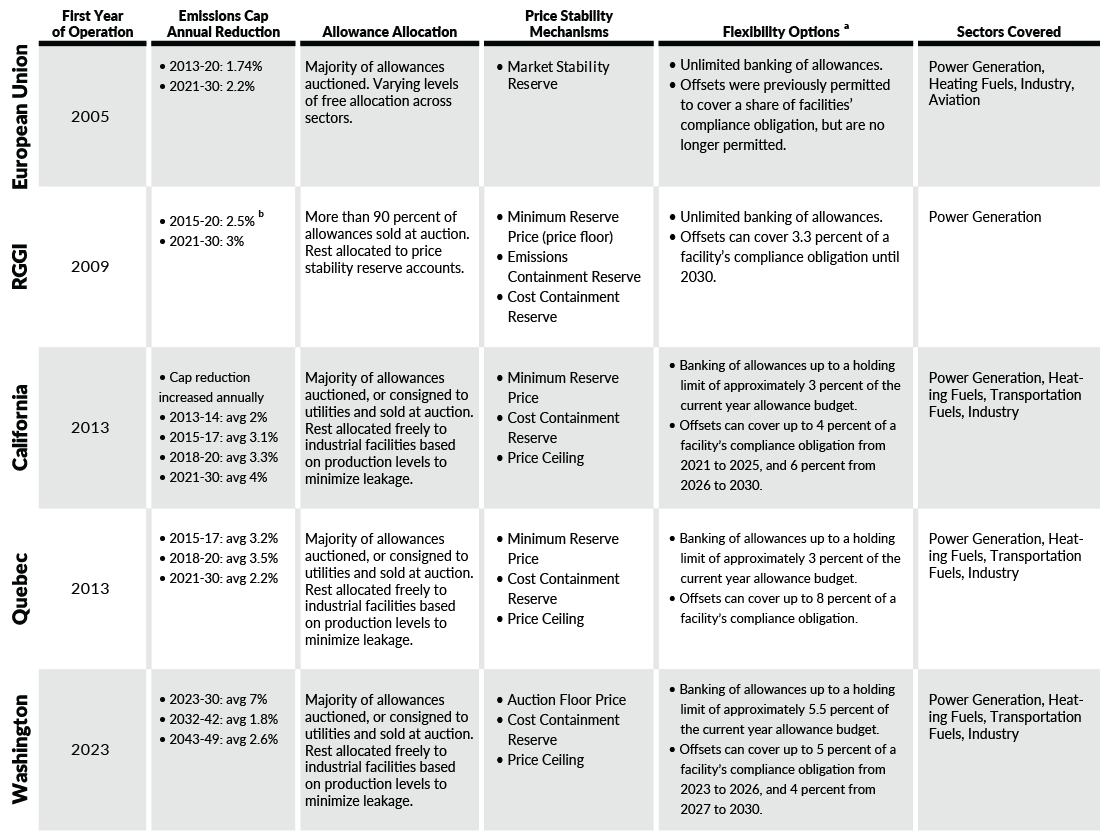
There are other national emissions trading systems in China, South Korea, New Zealand, and Kazakhstan, and pilot programs elsewhere, that were excluded because they do not have a typical emissions cap, they have not begun fully operating, or program data are not accessible.
(a) All cap-and-invest systems included in the table allow facilities to trade allowances outside of the auction in the secondary market.
(b) The RGGI emissions cap has also been adjusted several times to account for states entering and leaving the initiative, and to account for the substantial accumulation of banked allowances in early compliance periods.
Council Directive 2018/410 of the European Parliament and Council Directive 2003/87/EC of the European Parliament; Regional Greenhouse Gas Initiative, "Model Rule 2017," and "Principles to Accompany Model Rule Amendments"; California Code of Regulations, Title 17, Division 3, Chapter 1, Subchapter 10, Article 5; Quebec Consolidated Statutes, Environmental Quality Act, Chapter Q-2, r. 46.1; California Air Resources Board, “Cap-and-Trade Program: Cost Containment Information,” (accessed April 24, 2023), and “California Cap-and-Trade and Quebec Cap-and-Trade System: 2023 Annual Auction Reserve Price Notice,” (last updated December 21, 2022); Revised Code of Washington, Title 70A, Chapter 70A.65; and Washington Administrative Code, Title 173; Chapter 173-446.
Footnotes
- New York State has consistently referred to its proposed economy-wide emissions reduction system as a “cap-and-invest” program, drawing a distinction from the more widely known “cap-and-trade” moniker. Both terms generally refer to systems that cap emissions and allocate emissions allowances. New York State has repeatedly highlighted the importance of the revenue generation, investment, and climate justice elements of the cap-and-invest program. This report uses “cap-and-invest” throughout, except when referring to specific programs in other jurisdictions. See New York State Climate Action Council, Cap and Invest vs. Cap and Trade vs. Carbon Tax (January 2023).
- New York State Environmental Conservation Law, Article 75, Section 107.
- New York State Environmental Conservation Law, Article 75, Section 103.
- New York State Climate Action Council, Scoping Plan Full Report (December 2022), https://climate.ny.gov/Resources/Scoping-Plan
- New York State Environmental Conservation Law, Article 75, Section 109.
- Part TT of New York Senate Bill 4006-C, 205th Session, www.nysenate.gov/legislation/bills/2023/S4006.
- The State has emphasized the importance of the investment side of cap-and-invest, so any proposed program is likely to include an allowance auction that generates revenue. The allowances allocated within a cap-and-trade system can also be allocated for free to businesses based on firms’ emission or production levels.
- United State Environmental Protection Agency, The United States Experience With Economic Incentives to Control Environmental Pollution (July 1992), https://nepis.epa.gov/Exe/ZyPDF.cgi/2000829J.PDF?Dockey=2000829J.PDF
- Robert W. Hahn and Gordon L. Hester, "Marketable permits: Lessons for theory and practice,” Ecology Law Quarterly, vol. 16 (1989), pp. 361-406, https://heinonline.org/HOL/LandingPage?handle=hein.journals/eclawq16&div=26&id=&page=; and United States Environmental Protection Agency, Costs and Benefits of Reducing Lead in Gasoline, Final Regulatory Impact Analysis (February 1985).
- Dallas Burtraw and Sarah Jo Szambelan, U.S. emissions trading markets for SO2 and NOx, Resources For the Future Discussion Paper (October 2009), https://media.rff.org/documents/RFF-DP-09-40.pdf; and Curtis Carlson and others, “Sulfur Dioxide Control by Electric Utilities: What Are the Gains from Trade?” Journal of Political Economy, vol. 108 (December 2000), pp. 1292-1326, www.journals.uchicago.edu/doi/abs/10.1086/317681.
- Council Directive 2018/410 of the European Parliament and Council Directive 2003/87/EC of the European Parliament.
- New York Codes, Rules and Regulations, Title 6, Chapter 3A, Part 242.
- California Code of Regulations, Title 17, Division 3, Chapter 1, Subchapter 10, Article 5; and Quebec Consolidated Statutes, Environmental Quality Act, Chapter Q-2, r. 46.1.
- Revised Code of Washington, Title 70A, Chapter 70A.65.
- E. Mark Curtis, “Who Loses under Cap-and-Trade Programs? The Labor Market Effects of the NOx Budget Trading Program,” The Review of Economics and Statistics, vol. 100, no. 1 (March 2018), pp. 151-166, https://direct.mit.edu/rest/article-abstract/100/1/151/58423/Who-Loses-under-Cap-and-Trade-Programs-The-Labor
- Yishu Zhou and Ling Huang, “How Regional Policies Reduce Carbon Emissions in Electricity Markets: Fuel Switching or Emission Leakage,” Energy Economics, vol. 97 (May 1, 2021), www.sciencedirect.com/science/article/abs/pii/S0140988321001146.
- Virginia’s State Air Pollution Control Board voted to repeal the regulation that enabled their participation in the RGGI carbon market in June of this year, and the program has been scrutinized by Governor Glenn Youngkin. While Pennsylvania joined RGGI in 2022, their participation in allowance auctions was held up by the State’s Supreme Court pending the outcome of lawsuits arguing the regulation is unconstitutional. The Pennsylvania Commonwealth Court ultimately struck down the regulation, and ruled that participation in RGGI could only be valid if enacted through legislation. See Governor of Virginia, “Governor Glenn Youngkin Praises State Air Pollution Control Board’s Repeal of RGGI” (press release, June 7, 2023), www.governor.virginia.gov/newsroom/news-releases/2023/june/name-1005558-en.html; Cassie Miller, “Pa. misses 7th RGGI auction as litigation keeps involvement in limbo,” Pennsylvania Capital-Star (September 13, 2023), www.penncapital-star.com/blog/pa-misses-7th-rggi-auction-as-litigation-keeps-involvement-in-limbo/; and Rachel McDevitt, ”Pa. Court rules climate program is an illegal tax, says state cannot join RGGI,” StateImpact Pennsylvania (November 1, 2023), https://stateimpact.npr.org/pennsylvania/2023/11/01/pa-court-rules-climate-program-is-an-illegal-tax-says-state-cannot-join-rggi/.
- California Air Resources Board, “Program Linkage,” (January 13, 2006), https://ww2.arb.ca.gov/our-work/programs/cap-and-trade-program/program-linkage.
- State of Washington Department of Ecology, “Stronger together: The promise of connecting North America's clean energy leaders,” (accessed November 2, 2023), https://ecology.wa.gov/blog/november-2023/stronger-together-the-promise-of-connecting-north-america-s-clean-energy-leaders.
- New York State Department of Environmental Conservation and New York State Energy Research and Development Authority, “Cap-and-Invest: Pre-Proposal Stakeholder Outreach Overview of New York Cap-and-Invest,” (June 1, 2023), https://capandinvest.ny.gov/Meetings-and-Events.
- Richard Schmalensee and Robert N. Stavins, “Lessons Learned from Three Decades of Experience with Cap and Trade” Review of Environmental Economics and Policy, vol. 11, no. 1 (January 2017), pp. 59-79, www.journals.uchicago.edu/doi/full/10.1093/reep/rew017.
- Frank J. Covery and Luke Redmond, “Market and Price Developments in the European Union Emissions Trading Scheme” Review of Environmental Economics and Policy, vol. 1, no. 1 (January 2007), pp. 88-111, www.journals.uchicago.edu/doi/abs/10.1093/reep/rem010?journalCode=reep.
- California Code of Regulations, Title 17, Division 3, Chapter 1, Subchapter 10, Article 5.
- California Air Resources Board, “Summary of California-Quebec Joint Auction Settlement Prices and Results,” (last updated August 2023), https://ww2.arb.ca.gov/sites/default/files/2020-08/results_summary.pdf.
- Regional Greenhouse Gas Initiative, “Allowance Prices and Volumes,” (updated September 6, 2023), www.rggi.org/Auctions/Auction-Results/Prices-Volumes; and Regional Greenhouse Gas Initiative, “Model Rule 2017,” www.rggi.org/sites/default/files/Uploads/Program-Review/12-19-2017/Model_Rule_2017_12_19.pdf.
- Jos Sijm and others, “CO2 cost pass-through and windfall profits in the power sector,” Climate Policy, vol. 6, no. 1 (January 2006), pp. 49-72, www.tandfonline.com/doi/abs/10.1080/14693062.2006.9685588; and Natalia Fabra and Mar Reguant, “Pass-Through of Emissions Costs in Electricity Markets,” American Economic Review, vol. 104, no. 9 (September 2014), pp. 2872-2899, www.aeaweb.org/articles?id=10.1257/aer.104.9.2872.
- Carolyn Fischer and Alan K. Fox, “The Role of Trade and Competitiveness Measures in US Climate Policy,” American Economic Review, vol. 101, no. 3 (May 2011), pp. 258-262, www.aeaweb.org/articles?id=10.1257/aer.101.3.258.
- Ian Lange and Peter Maniloff, “Updating allowance allocations in cap-and-trade: Evidence from the NOx Budget Program,” Journal of Environmental Economics and Management, vol. 105 (January 2021), www.sciencedirect.com/science/article/abs/pii/S0095069620301030.
- Karen Palmer and others, “Using Production Incentives to Avoid Emissions Leakage,” Energy Economics, vol. 68 (October 2017), pp. 45-56, www.sciencedirect.com/science/article/abs/pii/S0140988317303729.
- Hung-Po Chao and Robert Wilson, “Option Value of Emission Allowances,” Journal of Regulatory Economics, vol. 3, no. 3 (September 1993), pp. 233-249, https://link.springer.com/article/10.1007/BF01065952.
- California Air Resources Board, “Cap-and-Trade Program: Cost Containment Information,” (accessed April 24, 2023), https://ww2.arb.ca.gov/our-work/programs/cap-and-trade-program/cost-containment-information
- California Air Resources Board, “California Cap-and-Trade and Quebec Cap-and-Trade System: 2023 Annual Auction Reserve Price Notice,” (last updated December 21, 2022), https://ww2.arb.ca.gov/sites/default/files/2022-12/nc-2023_annual_reserve_price_notice_joint_auction.pdf;and Washington Administrative Code, Title 173, Chapter 173-446-335.
- Regional Greenhouse Gas Initiative, “2017 Model Rule,” (accessed April 24, 2023), www.rggi.org/sites/default/files/Uploads/Design-Archive/Model-Rule/2017-Program-Review-Update/2017_Model_Rule_revised.pdf.
- Decision (EU) 2015/1814 of the European Parliament and of the Council of 6 October 2015 concerning the establishment and operation of a market stability reserve for the Union greenhouse gas emission trading scheme and amending Directive 2003/87/EC, https://eur-lex.europa.eu/legal-content/EN/TXT/?uri=uriserv:OJ.L_.2015.264.01.0001.01.ENG.
- Sebastian Osorio and others, “Reviewing the Market Stability Reserve in light of more ambitious EU ETS emission targets,” Energy Policy, vol. 158 (November 2021), www.sciencedirect.com/science/article/pii/S0301421521004006.
- Dallas Burtraw and others, Quantities with Prices: Price-Responsive Allowance Supply in Environmental Markets, Resources for the Future Working Paper 20-17 (Resources for the Future, September 2020), www.rff.org/publications/working-papers/quantities-prices-price-responsive-allowance-supply-environmental-markets/.
- Part AAA of New York Senate Bill 4008-B, 205th Session, www.nysenate.gov/legislation/bills/2023/S4008/amendment/B.
- Jonathan Rubin, “A Model of Intertemporal Emission Trading, Banking, and Borrowing,” Journal of Environmental Economics and Management, vol. 31, no. 3 (November 1996), www.sciencedirect.com/science/article/abs/pii/S0095069696900443.
- Stephen Holland and Michael Moore, “Market design in cap and trade programs: Permit validity and compliance timing,” Journal of Environmental Economics and Management, vol. 66, no. 3 (November 2013), www.sciencedirect.com/science/article/abs/pii/S0095069613000703.
- For example, see Benjamin Elgin and Akshat Rathi, "What Are Carbon Offsets? Are They a Credible Climate Solution?", The Washington Post (October 31, 2023), www.washingtonpost.com/business/energy/2023/10/31/are-carbon-offsets-a-good-solution-to-the-climate-change-crisis/e89233aa-780c-11ee-97dd-7a173b1bd730_story.html; and Heidi Blake, "The Great Cash-For-Carbon Hustle" The New Yorker (October 16, 2023), www.newyorker.com/magazine/2023/10/23/the-great-cash-for-carbon-hustle.
- Antonio Bento and others, "Optimal monitoring and offset prices in voluntary emissions markets," Resource and Energy Economics, vol. 41 (August 2015), https://www.sciencedirect.com/science/article/abs/pii/S0928765515000366?via%3Dihub; and Ben Groom and Frank Venmans, "The social value of offsets," Nature, vol. 619 (July 2023), https://www.nature.com/articles/s41586-023-06153-x.
- New York State Environmental Conservation Law, Article 75, Section 109.
- California Air Resources Board, “Compliance Offset Program,” (accessed May 4, 2023), https://ww2.arb.ca.gov/our-work/programs/compliance-offset-program; and State of Washington Department of Ecology, “Cap-and-invest offsets,” (accessed May 4, 2023), https://ecology.wa.gov/Air-Climate/Climate-Commitment-Act/Cap-and-invest/Offsets.
- Tatyana Ruseva and others, “Additionality and permanence standards in California’s Forest Offset Protocol: A review of project and program level implications,” Journal of Environmental Management, vol. 198 (August 2017), pp. 277-288, www.sciencedirect.com/science/article/abs/pii/S0301479717304309.
- Regional Greenhouse Gas Initiative, “2017 Model Rule,” (accessed April 24, 2023), www.rggi.org/sites/default/files/Uploads/Design-Archive/Model-Rule/2017-Program-Review-Update/2017_Model_Rule_revised.pdf.
- Regional Greenhouse Gas Initiative, “RGGI CO2 Allowance Tracking System,” (accessed May 2, 2023), https://rggi-coats.org/eats/rggi/index.cfm?hc=IShQICAK.
- Dallas Burtraw and Nicholas Roy, How Would Facility-Specific Emissions Caps Affect the California Carbon Market? (Resources for the Future, July 2023), https://www.rff.org/publications/reports/how-would-facility-specific-emissions-caps-affect-the-california-carbon-market/?_gl=1*189daiz*_ga*MjEzOTU5MDk1NC4xNjk2NTM4NDcz*_ga_HNHQWYFDLZ*MTY5NjUzODQ3My4xLjEuMTY5NjUzODgwMy4wLjAuMA...
- Economic efficiency in this context refers to the degree to which the use of revenue enhances overall societal welfare and minimizes distortions. Lawrence Goulder and others, “Impacts of a carbon tax across US household income groups: What are the equity-efficiency trade-offs?” Journal of Public Economics, vol. 175 (July 2019), pp. 44-64, www.sciencedirect.com/science/article/abs/pii/S0047272719300453?via%3Dihub; and Jared Carbone and others, Deficit Reduction and Carbon Taxes: Budgetary, Economic, and Distributional Impacts (Resources for the Future, August 2013), https://media.rff.org/documents/RFF-Rpt-Carbone.etal.CarbonTaxes.pdf.
- California Air Resources Board, “California Cap-and-Trade Program: Summary of Proceeds to California and Consigning Entities,” (accessed May 11, 2023), https://ww2.arb.ca.gov/sites/default/files/2020-09/proceeds_summary.pdf.
- California Climate Investments, “2023 Annual Report: Cap-and-Trade Auction Proceeds,” (April 2023), https://ww2.arb.ca.gov/sites/default/files/auction-proceeds/cci_annual_report_2023.pdf.
- Patrick Orecki, Six Things to Know About New York State Health Care Reform Act (HCRA) Taxes (Citizens Budget Commission, March 2020), https://cbcny.org/research/six-things-know-about-new-york-state-health-care-reform-act-hcra-taxes; and Patrick Orecki, “Time to Rethink HRCA Taxes” Citizens Budget Commission Blog (April 18,2017), https://cbcny.org/research/time-rethink-hcra-taxes.
- Patrick Orecki, “Don’t Get Too High on Potential Marijuana Revenues” Citizens Budget Commission Blog (December 13, 2018), https://cbcny.org/research/dont-get-too-high-potential-marijuana-revenues.
- California Climate Investments, “2023 Annual Report: Cap-and-Trade Auction Proceeds,” (April 2023), https://ww2.arb.ca.gov/sites/default/files/auction-proceeds/cci_annual_report_2023.pdf.
- Regional Greenhouse Gas Initiative, “RGGI CO2 Allowance Tracking System,” (accessed May 2, 2023), https://rggi-coats.org/eats/rggi/index.cfm?hc=IShQICAK.
- Carolyn Fischer and Louis Preonas, Combining Policies for Renewable Energy: Is the Whole Less than the Sum of its Parts? Resources for the Future Discussion Paper 10-19 (Resources for the Future, March 2010), https://papers.ssrn.com/sol3/papers.cfm?abstract_id=1569634; and Arik Levinson, Interactions Among Climate Policy Regulations, NBER Working Paper 16109 (National Bureau of Economic Research, May 2010), www.nber.org/system/files/chapters/c12138/revisions/c12138.rev0.pdf .
- See data available at U.S. Environmental Protection Agency, “State GHG Emissions and Removals,” (accessed April 25, 2023), https://www.epa.gov/ghgemissions/state-ghg-emissions-and-removals.
- Robert W. Hahn and Robert N. Stavins, “The Effect of Allowance Allocations on Cap-and-Trade System Performance,” The Journal of Law and Economics, vol. 100, no. 1 (November 2011), pp.267-294, https://www.journals.uchicago.edu/doi/full/10.1093/reep/rew017.