Managing Economic Development Programs in New York City
An Assessment of Progress
Mayor Bill de Blasio’s first term was a period of strong economic growth in New York City. While many of the forces driving this growth reflect national and global trends, the City has invested significantly in economic development through tax expenditures, capital spending, operating programs, and conduit financing.
One New York: The Plan for a Strong and Just City, released 16 months into de Blasio’s first mayoral term, included job growth, income growth, and outpacing national economic growth as indicators of success for the City’s economic development efforts. Since that time, median wages have risen and the technology sector has grown rapidly, but inequality persists and the sectors driving employment growth pay low wages. The share of the city’s employment located in Manhattan decreased slightly, continuing a long-term trend of outerborough growth.
This report analyzes the administration’s economic development policies and reviews the city’s progress on five recommendations made by the Citizens Budget Commission (CBC) prior to the start of Mayor de Blasio’s term in a report titled Managing Economic Development Programs in New York City: Lessons for the Next Mayor from the Past Decade. Progress has been made on some recommendations, while efforts on others have stalled.
New York City's Economic Performance
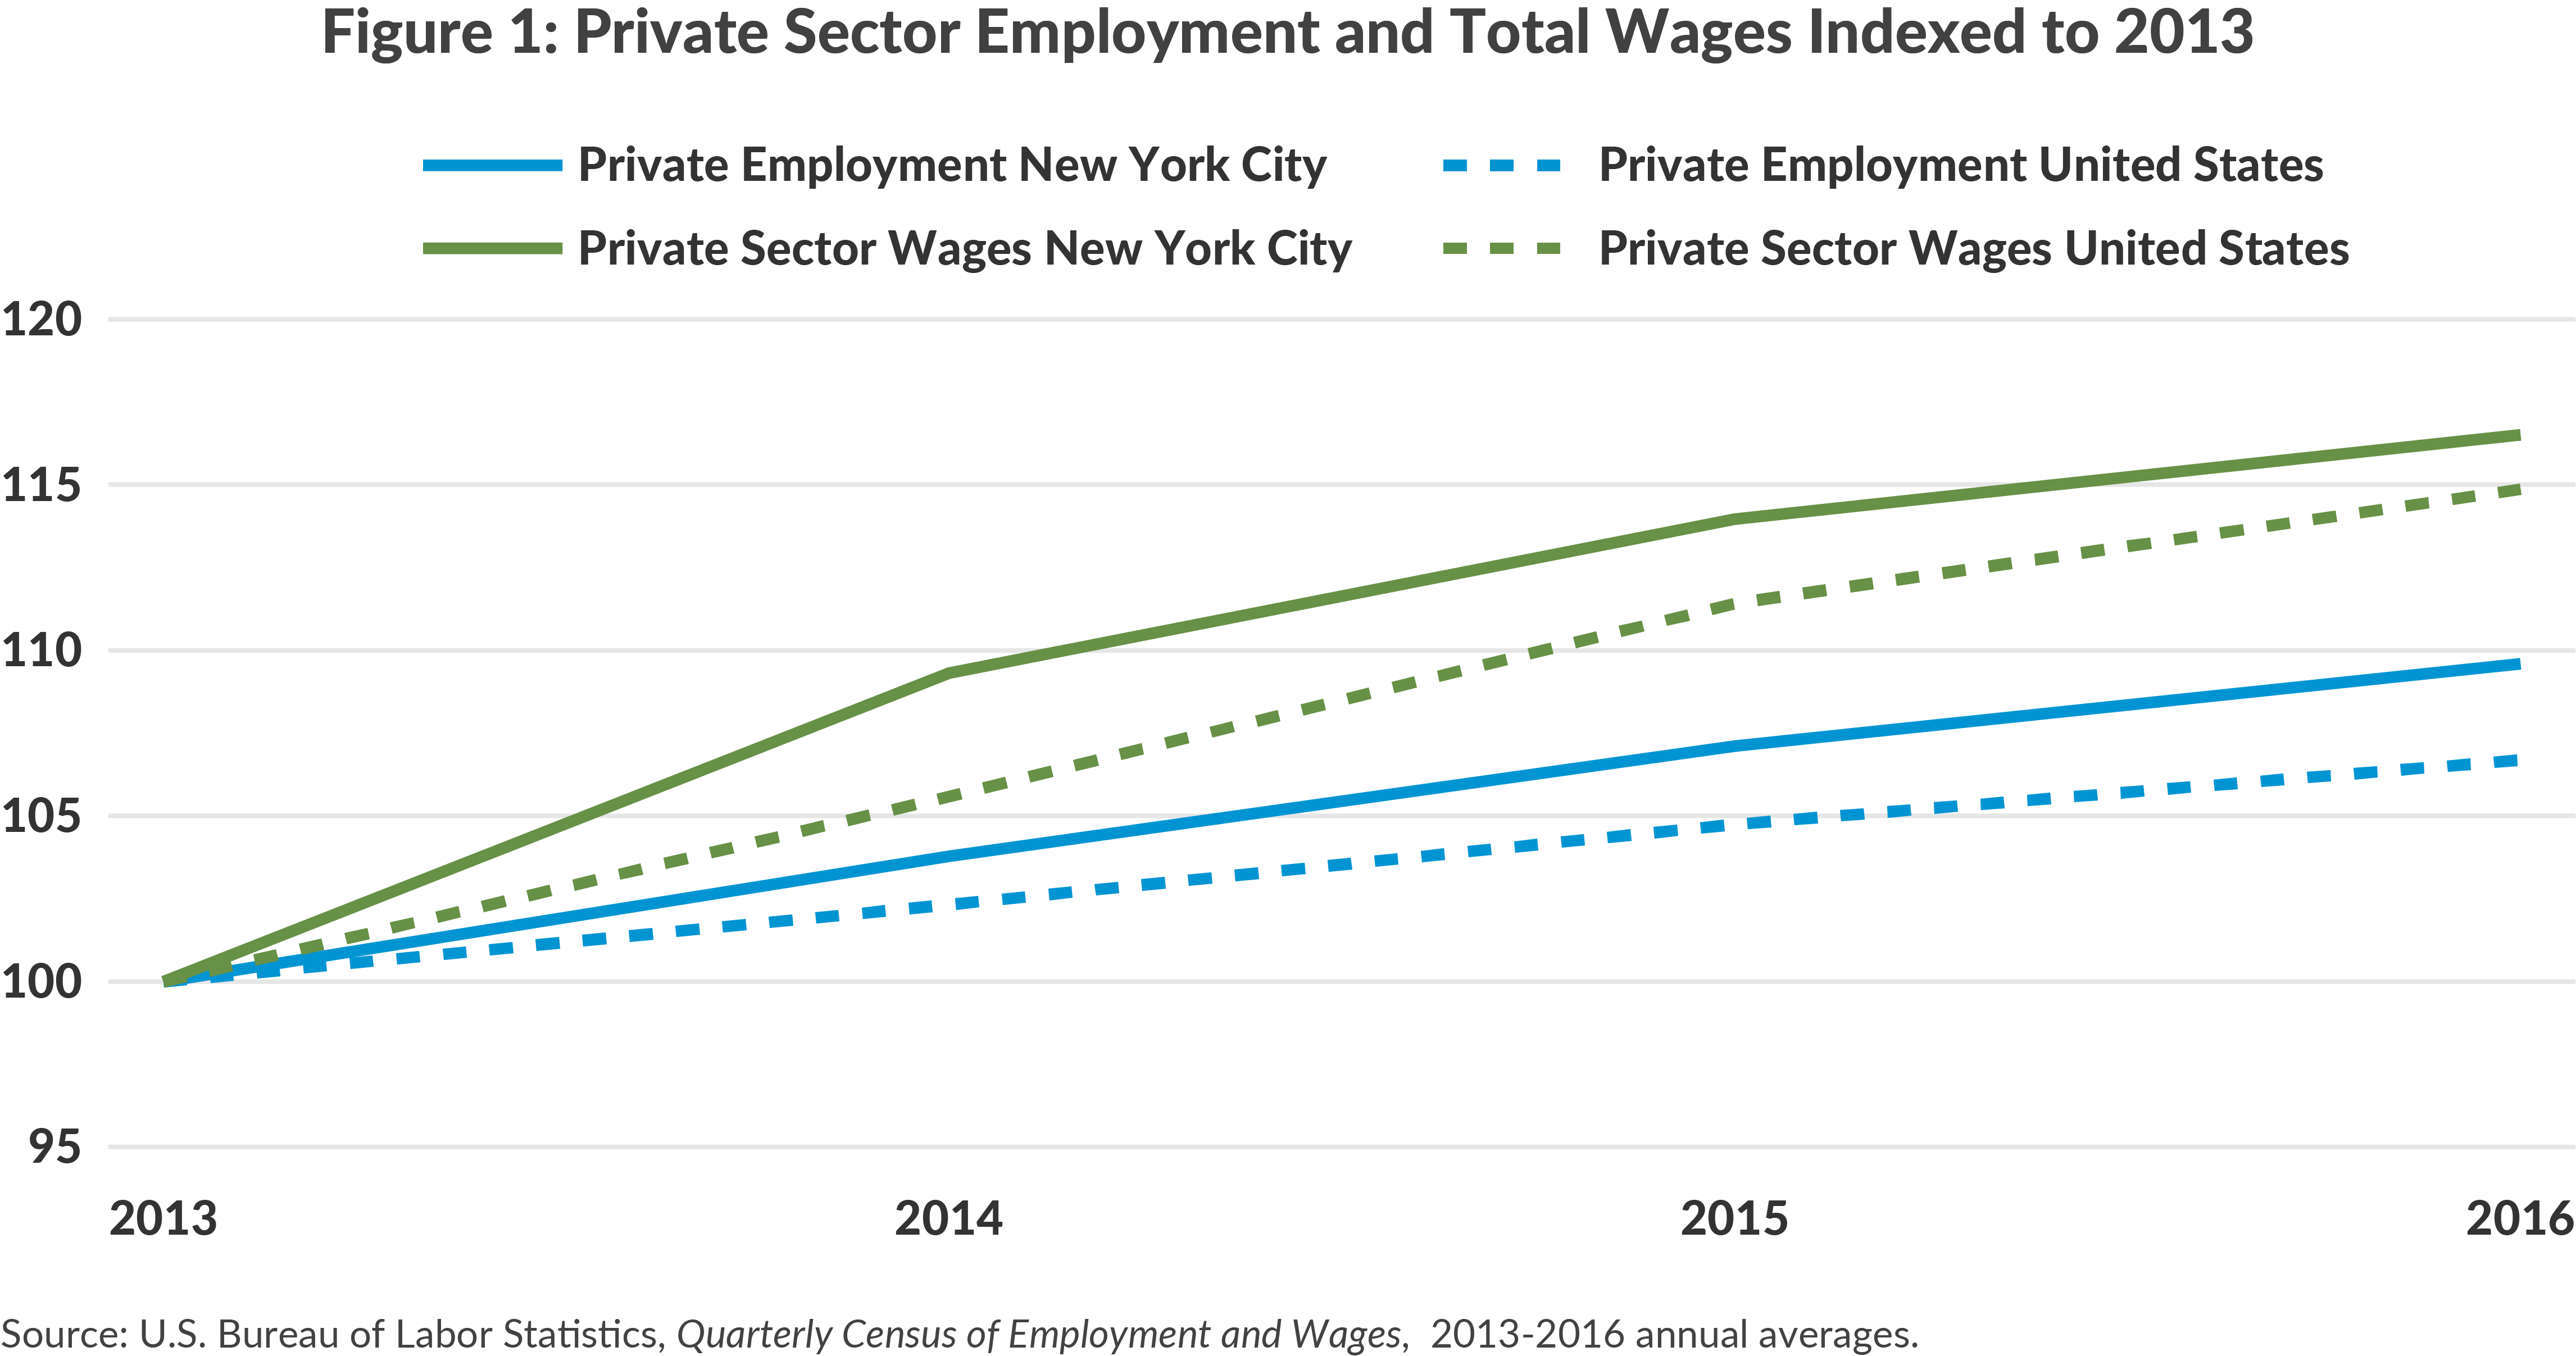
Between 2013 and 2016 private sector employment and wages grew 10 percent and 17 percent, respectively. (See Figure 1.) Average wages rose only 6 percent, slower than the national average, due to falling average wages in the financial sector and high job growth in low-wage health care occupations. The unemployment rate declined from 9.8 percent in 2013 to 6.8 percent in 2016 compared to a national unemployment rate that declined from 8.4 percent to 5.8 percent.
Mayor de Blasio’s Economic Development Goals
The One New York Plan emphasized three specific economic development goals:
- Decrease inequality and create jobs that pay middle-class wages;
- Expand “innovation industries” including technology; and
- Grow commercial hubs outside of Manhattan’s central business district.1
How has the city performed on each of these goals?
Decreasing Inequality and Creating Middle Class Jobs
New York City’s median household income grew 12.7 percent from 2013 to 2016, reaching $58,856 and surpassing the national median.2 The poverty rate in New York City fell from 20.9 percent in 2013 to 18.9 percent in 2016, but it remained above the national rate of 15.8 percent in 2013 and 14.0 percent in 2016.3 The share of households with the lowest incomes decreased from 2013 to 2016, and the fastest growth was among households with the highest incomes. (See Table 1.) The number of households earning above $150,000 increased by 22 percent from 2013 to 2016; those households comprised 16 percent of households in the city in 2016.

The de Blasio administration set a goal to create 100,000 “good-paying” jobs, defined as those paying $50,000 annually or more, over a 10-year period in a subsequent plan called New York Works released in 2017.4 In 2016 sectors with average wages above this level comprised 57 percent of jobs in the city.5 These sectors added an average of 59,000 jobs per year between 2013 and 2016.
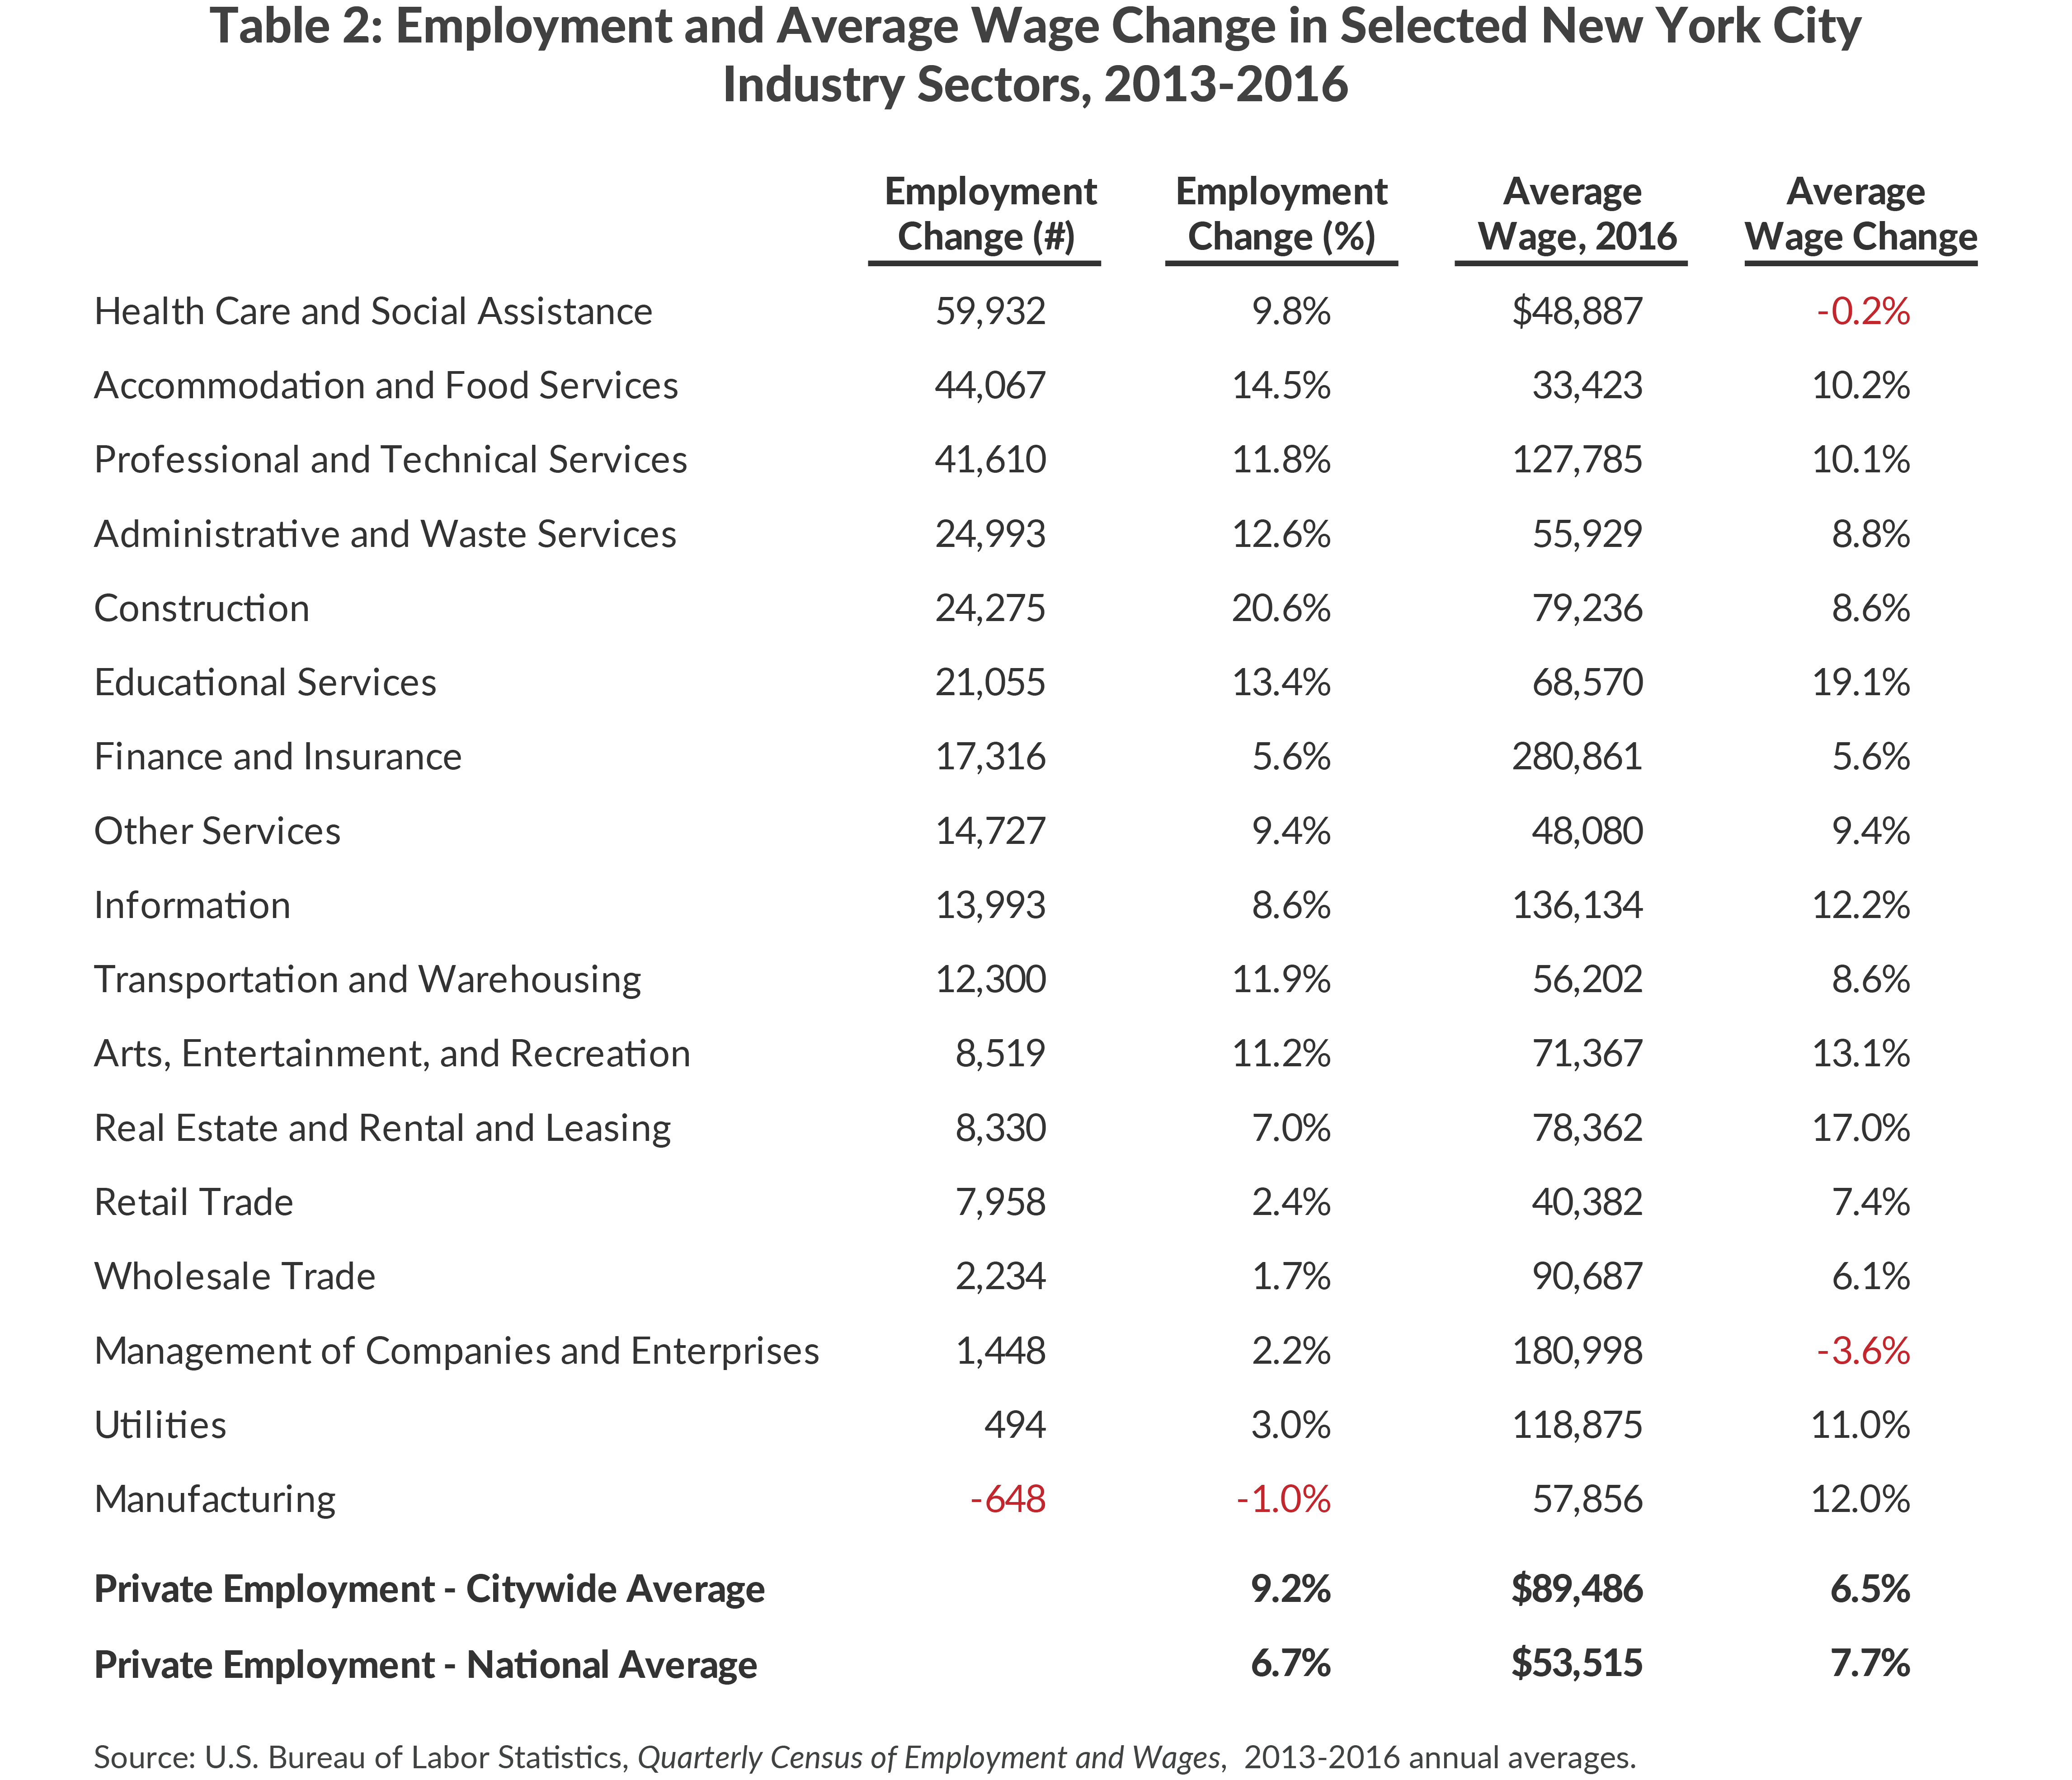
In Mayor de Blasio’s second term, income distribution will be impacted by minimum wage increases to $15 per hour by 2019 and will have the greatest impact on low-wage sectors, such as health care and food service. From 2013 to 2016 these two sectors produced one-third of the new jobs, and both have average annual wages below $50,000. (See Table 2.) Health care job growth has been dominated by low-wage occupations within the sector such as home health aides and nursing assistants. Health care, along with life sciences, industrial and manufacturing, and the creative and cultural sectors is an industry of focus in the Mayor’s New York Works plan. While the rest of these industries have strong job growth and average pay above the $50,000 benchmark, the proliferation of some low-wage health care jobs such as medical assistants and persistent job losses in manufacturing present challenges to accomplishing the mayor’s objectives.
Growing Innovation Industries
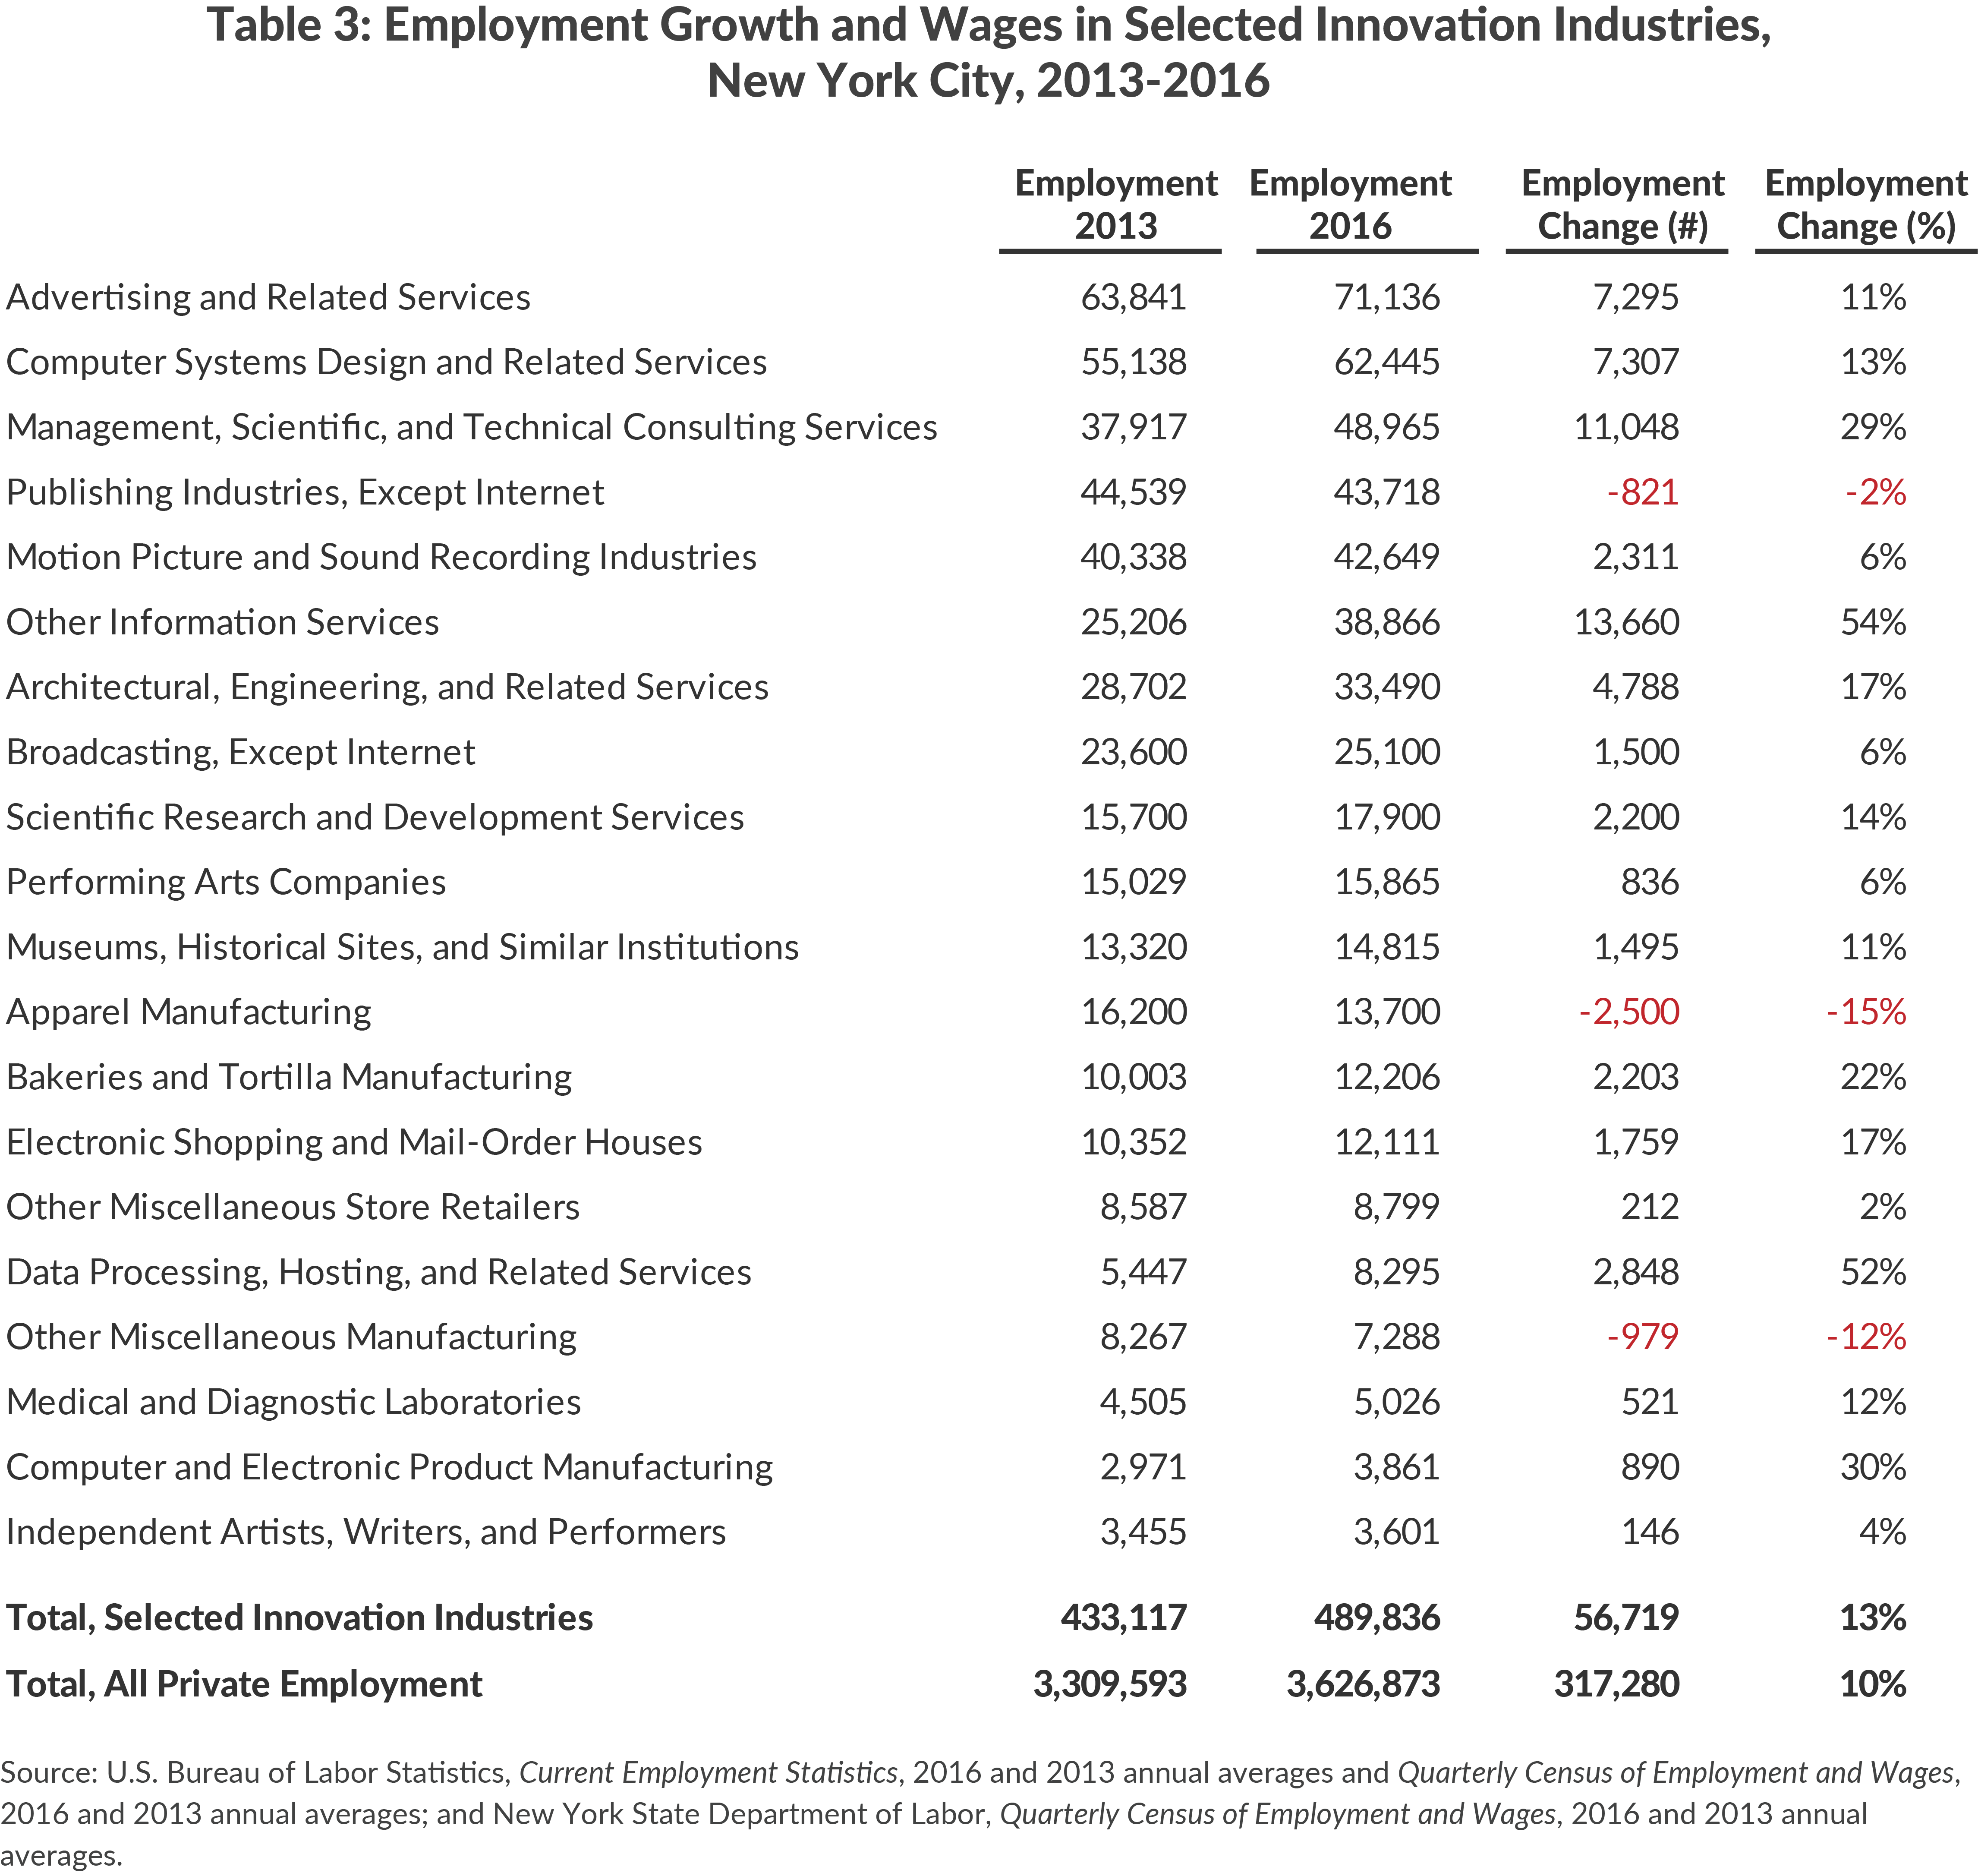
Perhaps the most ambitious economic development goal in the Mayor’s One New York plan is to increase the share of jobs in innovation industries to 20 percent of citywide employment by 2040, up from 14.7 percent in 2015. Innovation industries are defined to include advertising, publishing, and the arts, as well as technology, e-commerce, and life sciences. To achieve this goal and the overall job growth goals set by One New York, half of all new jobs created by 2040 must be in innovation industries.
Table 3 shows employment and job growth for 20 industries included in One New York’s definition of innovation industries.6 Average wages in all of the included industries are above the Mayor’s $50,000 benchmark with the exception of bakeries, which had average pay of only $27,000 in 2016. Nearly one-quarter of the added jobs in these industries came from "Other Information Services," which includes search engines and Internet publishing and/or broadcasting. Three industries in Table 3 lost jobs since 2013: publishing industries, apparel manufacturing, and other miscellaneous manufacturing.
Growing Commercial Hubs Outside of Manhattan
Mayor Bloomberg’s Five Borough Economic Plan contained plans for development in outerborough commercial centers including the South Bronx, Long Island City, Downtown Brooklyn, and St. George, as well as Hudson Yards and Harlem in Manhattan.7 Many of these projects have continued in the de Blasio administration, and new investments have been announced in Sunset Park, Jamaica, Hunts Point, and East New York. (See Table 10.) As part of this decentralization effort, the City plans to relocate Human Resources Administration offices to a new building in East New York to serve as an anchor tenant for new commercial development.8
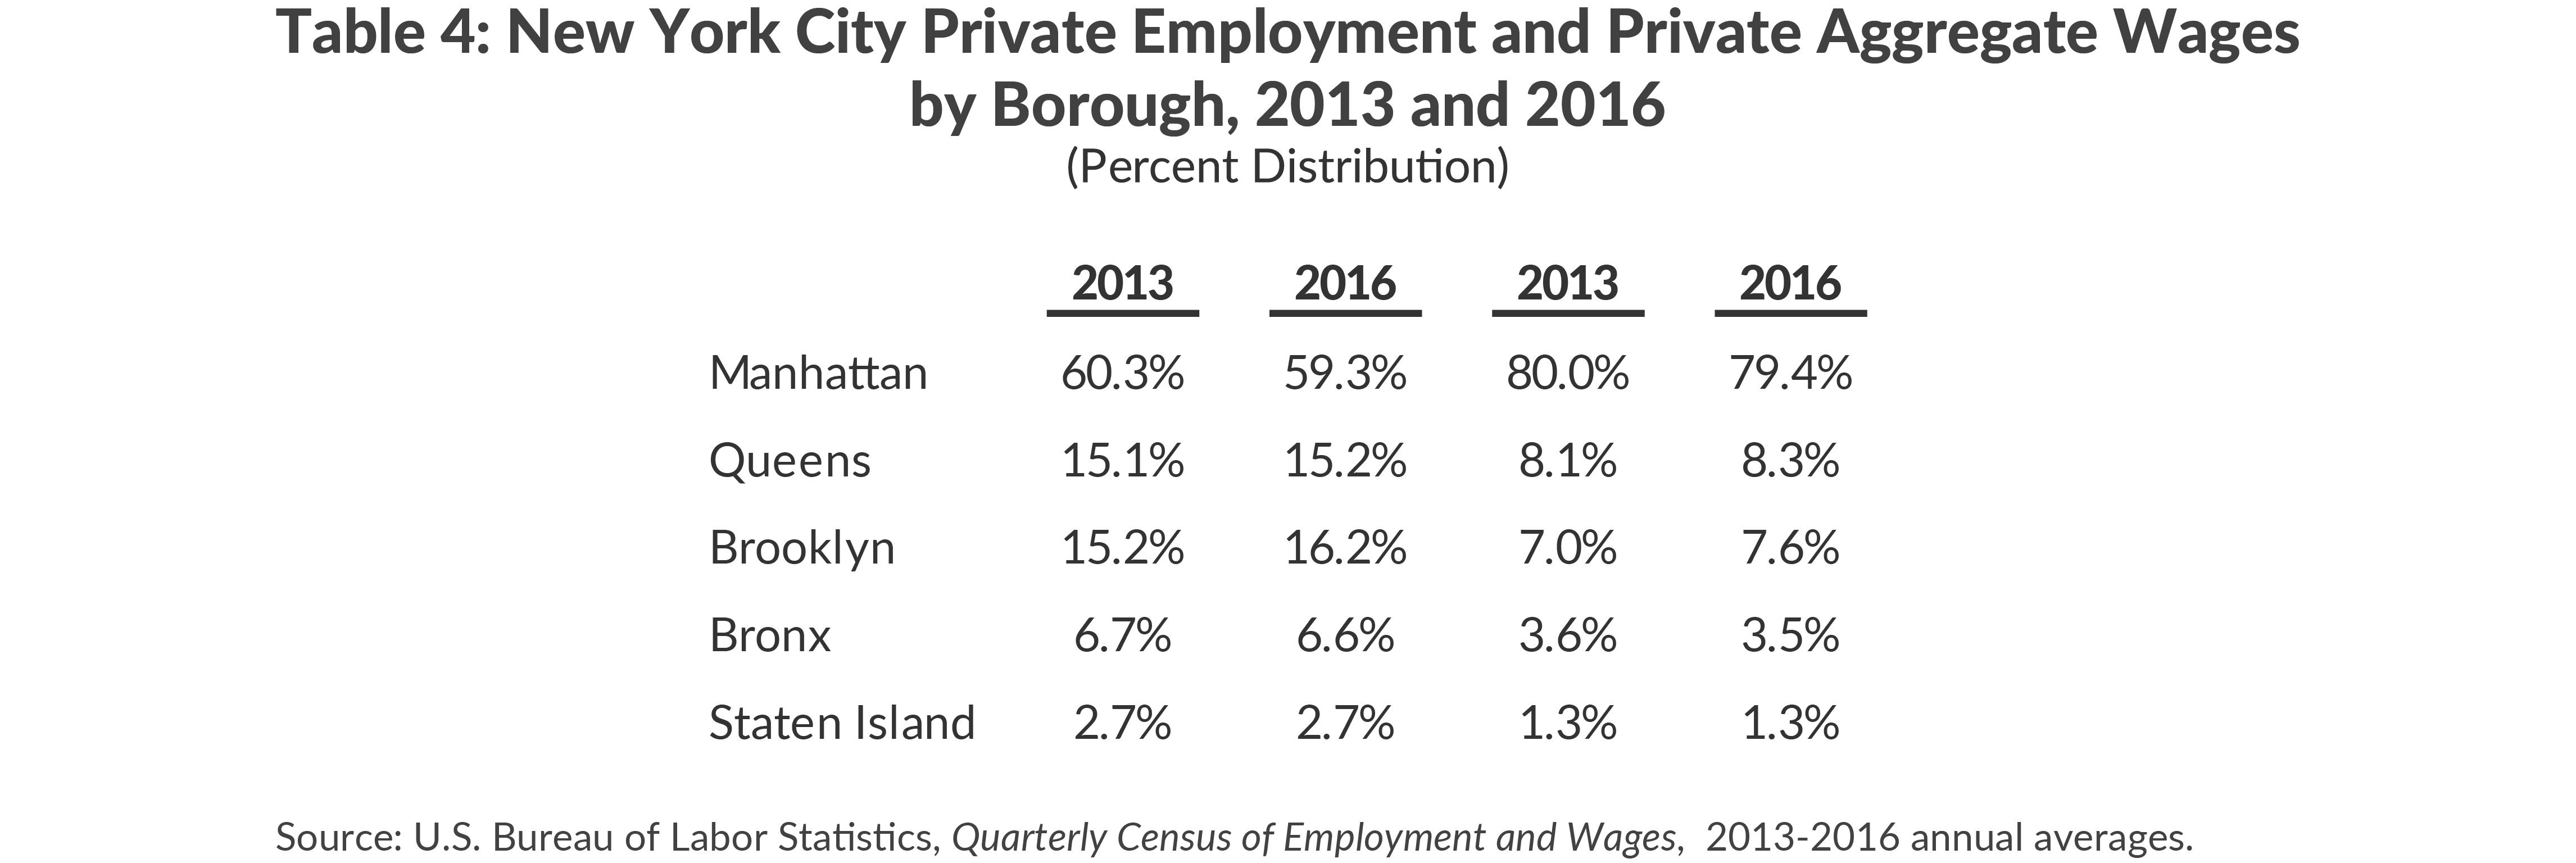
All five boroughs have experienced job growth since 2013, with the fastest growth in Brooklyn and Queens. The geographic distribution of employment in the City has shifted slightly over this period, with a small decrease in Manhattan’s share of the city’s employment and a corresponding increase in Brooklyn’s share. (See Table 4.) This shift continues a trend that began before de Blasio’s time in office; Brooklyn was home to 13.5 percent of employment in the city in 2001, and grew to 15.2 percent by 2013. In 2016 it had 16.2 percent of jobs in the city.
Economic Development Agencies and Tools in New York City
Agencies
The two main city economic development entities are the New York City Economic Development Corporation (EDC), a not-for-profit corporation subject to mayoral control, and the New York City Industrial Development Agency (IDA), a local authority.9 EDC receives funding and operates under a master contract with the City’s Department of Small Business Services (SBS) and receives municipal funds through project contracts with SBS. Through a contract between EDC and IDA, EDC administers all of the IDA’s programs, including conduit financing and payments in lieu of taxes. The city also has a number of local development corporations (LDCs) which, like EDC, are not-for-profit corporations. The LDCs include Build NYC Resource Corporation, which primarily issues conduit debt to nonprofits, and others that are focused on particular projects, such as the Hudson Yards Infrastructure Corporation.
Municipal agencies also contribute to economic development in the city, particularly SBS, which operates workforce development centers, oversees Business Improvement Districts, and provides support to small business owners. Other agencies that undertake efforts related to economic development or workforce training include the Department of Finance (DOF), which administers the City’s tax exemption programs.
Tools
New York City promotes the growth of its economy through the deployment of four main mechanisms:
- Tax expenditures;
- Operating programs;
- Capital spending; and
- Conduit financing.
The annual cost of the City’s economic development efforts in 2016 was $3.2 billion. Two billion dollars of this was tax expenditures, which are foregone tax revenue due to exemptions or other tax benefits given to specified recipients.10 (See Table 5.) Some tax expenditures are “as-of-right,” meaning any firm that meets the qualifications can receive the benefit. These tax expenditures are administered by the Department of Finance and include exemptions from the property tax, business income tax, and sales tax.
Other tax expenditures are discretionary, meaning EDC and/or IDA provide customized incentives on an individual project basis. The significant increase in discretionary property tax expenditures between 2013 and 2016 is in part due to the transfer of some properties from state ownership to EDC ownership. This includes properties in Times Square and Downtown Brooklyn/MetroTech redeveloped by Empire State Development in the 1990s and transferred to EDC ownership in recent years.11 These properties accounted for $130 million in discretionary real property tax expenditures in 2016, or nearly half the increase. Notable new development projects that received discretionary property tax incentives during this period were the Alexandria Center for Life Sciences and Cornell Tech.
Operating costs for SBS, EDC, and various LDCs totaled $534 million in 2016.

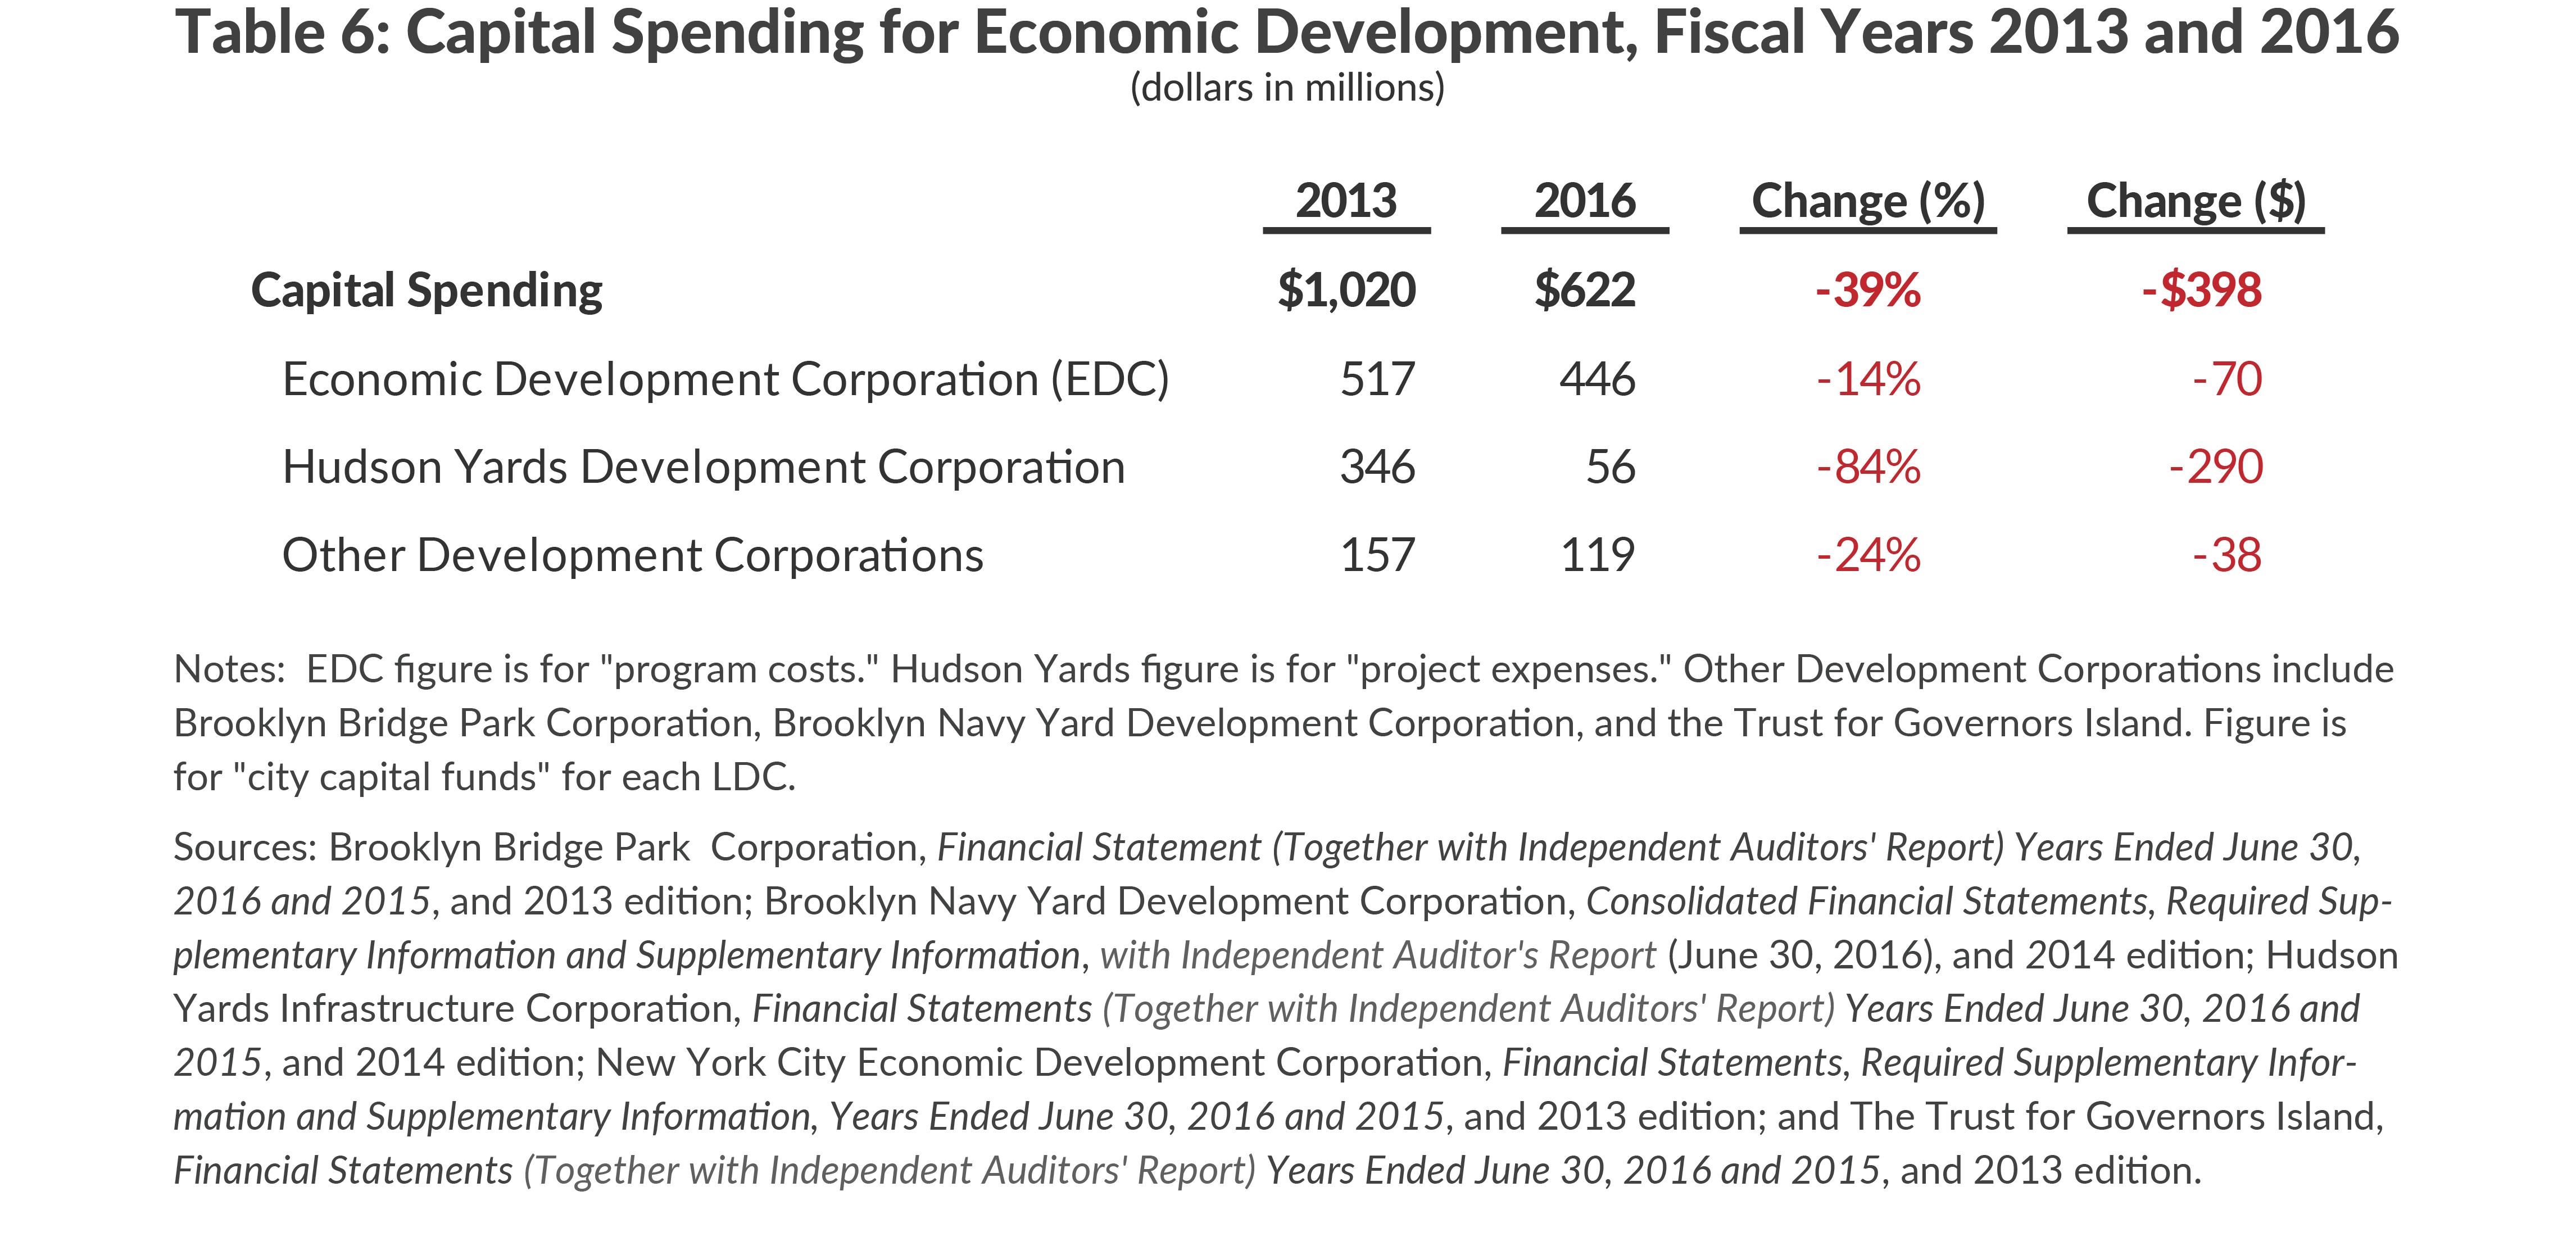
In addition to these costs, capital spending was $622 million in 2016. (See Table 6.) A majority of the capital spending was undertaken by EDC, with the rest spent by LDCs. A significant portion of EDC capital spending is for projects that EDC manages on behalf of other agencies, not all of which are related to economic development.
Conduit debt is issued by the City, but is the obligation of a business or a nonprofit. It carries little risk and minimal cost to the City, and serves as a lower cost source of capital for the recipient because the debt is tax-exempt. The three entities that issue conduit debt are the IDA, Build NYC Resource Corporation, and the Trust for Cultural Resources, with a collective $8.9 billion in debt outstanding in 2016.12
Progress on Recommendations
In 2013 CBC published a report evaluating the prior decade of economic development programs in New York City and made the following recommendations for the next mayor:
- Make as-of-right tax expenditures more cost-effective with continued reform;
- Create more detailed standards for awarding discretionary tax expenditures;
- Make capital investments in infrastructure to support job growth in underdeveloped neighborhoods;
- Manage EDC programs with a focus on job creation and improving transparency; and
- Use conduit financing to support growth in the arts, health, and educational sectors.
As Mayor de Blasio prepares to begin his second term, has his administration made progress on these recommendations?
As-of-Right Tax Expenditures
As-of-right tax expenditures are the main component of New York City’s economic development support. The largest is the Industrial and Commercial Incentive Program (ICIP), which totaled $653 million in 2017.13 (See Table 7.) ICIP ended in 2008 following a 2007 evaluation by EDC. The evaluation found that more than three-quarters of projects receiving ICIP were not induced by the exemption. Furthermore, tax expenditures were concentrated in Manhattan south of 59th Street, where inducement rates were lower than in the rest of the city.14 Projects that applied for ICIP and received a building permit before July 31, 2008 were eligible to receive benefits for construction work performed through the end of 2013. ICIP granted exemptions lasting up to 25 years and the program’s phaseout will take decades.
A reformed version of ICIP, the Industrial Commercial Abatement Program (ICAP), was enacted in 2008, and corrected some but not all of the shortcomings of ICIP. In 2013 CBC recommended further reforms, such as stricter limitations on a project’s geographic location, greater restrictions on benefits for retail space, and shorter benefit durations.15 Those changes have not been made and a bill extending ICAP’s sunset date from 2018 to 2022 was signed by Governor Cuomo in June 2017.16

ICAP has grown rapidly since it was established. The City Council’s Finance Division evaluated the ICAP program in July 2016 as part of a Task Force on economic development tax expenditures and found that inducement effects were very limited; only 3.6 percent of recipient projects relied on the abatement to reach a “hurdle rate” that made the investment worthwhile.17 The ICAP inducement rate is much lower than the one found in the 2007 study of ICIP, suggesting that significant reform is necessary. Any changes to ICAP would have to be passed at the state level.
The City Council Task Force made recommendations regarding oversight of economic development incentives, which culminated in a bill signed into law by Mayor de Blasio in February 2017 requiring the Independent Budget Office (IBO) to regularly evaluate economic development tax expenditures.18 This review of the costs and benefits of various tax expenditures may lead to programmatic reforms in the future.
In addition to as-of-right property tax expenditures, there are several as-of-right tax expenditures for non-property taxes. (See Table 8.) CBC’s 2013 report recommended evaluation of the two largest, which benefit insurance companies and airlines. The most recent available data shows that these exemptions grew prior to 2013 and that employment in both industries has continued to grow. Given the size and duration of these exemptions, IBO should evaluate these programs for cost-effectiveness.
The Commercial Revitalization Program (CRP), enacted in 1995, consists of a property tax abatement (included in the Commercial Expansion Program in Table 7), a commercial rent tax abatement, the energy cost savings program, and an additional property tax incentive for conversion of office buildings to residential use—all targeted at Lower Manhattan. In addition property used to furnish and equip commercial office space in Lower Manhattan is exempted from sales tax. The CRP is the subject of an upcoming evaluation by the IBO, the first under the new law requiring such evaluations.

Discretionary Tax Expenditures
CBC’s 2013 analysis concluded there was too much variation in the size of discretionary benefits awarded to projects and recommended that additional standards be established, including a cap on the level of per-job subsidy to account for the wage level of the project’s industry and the amount of private investment leveraged by the project.
Although Mayor de Blasio has expressed dislike for discretionary tax incentives, such benefits continue to be awarded by the city, including a $9.6 million incentive package from EDC for the relocation of Aetna’s corporate headquarters, which was later cancelled when Aetna chose not to relocate.19
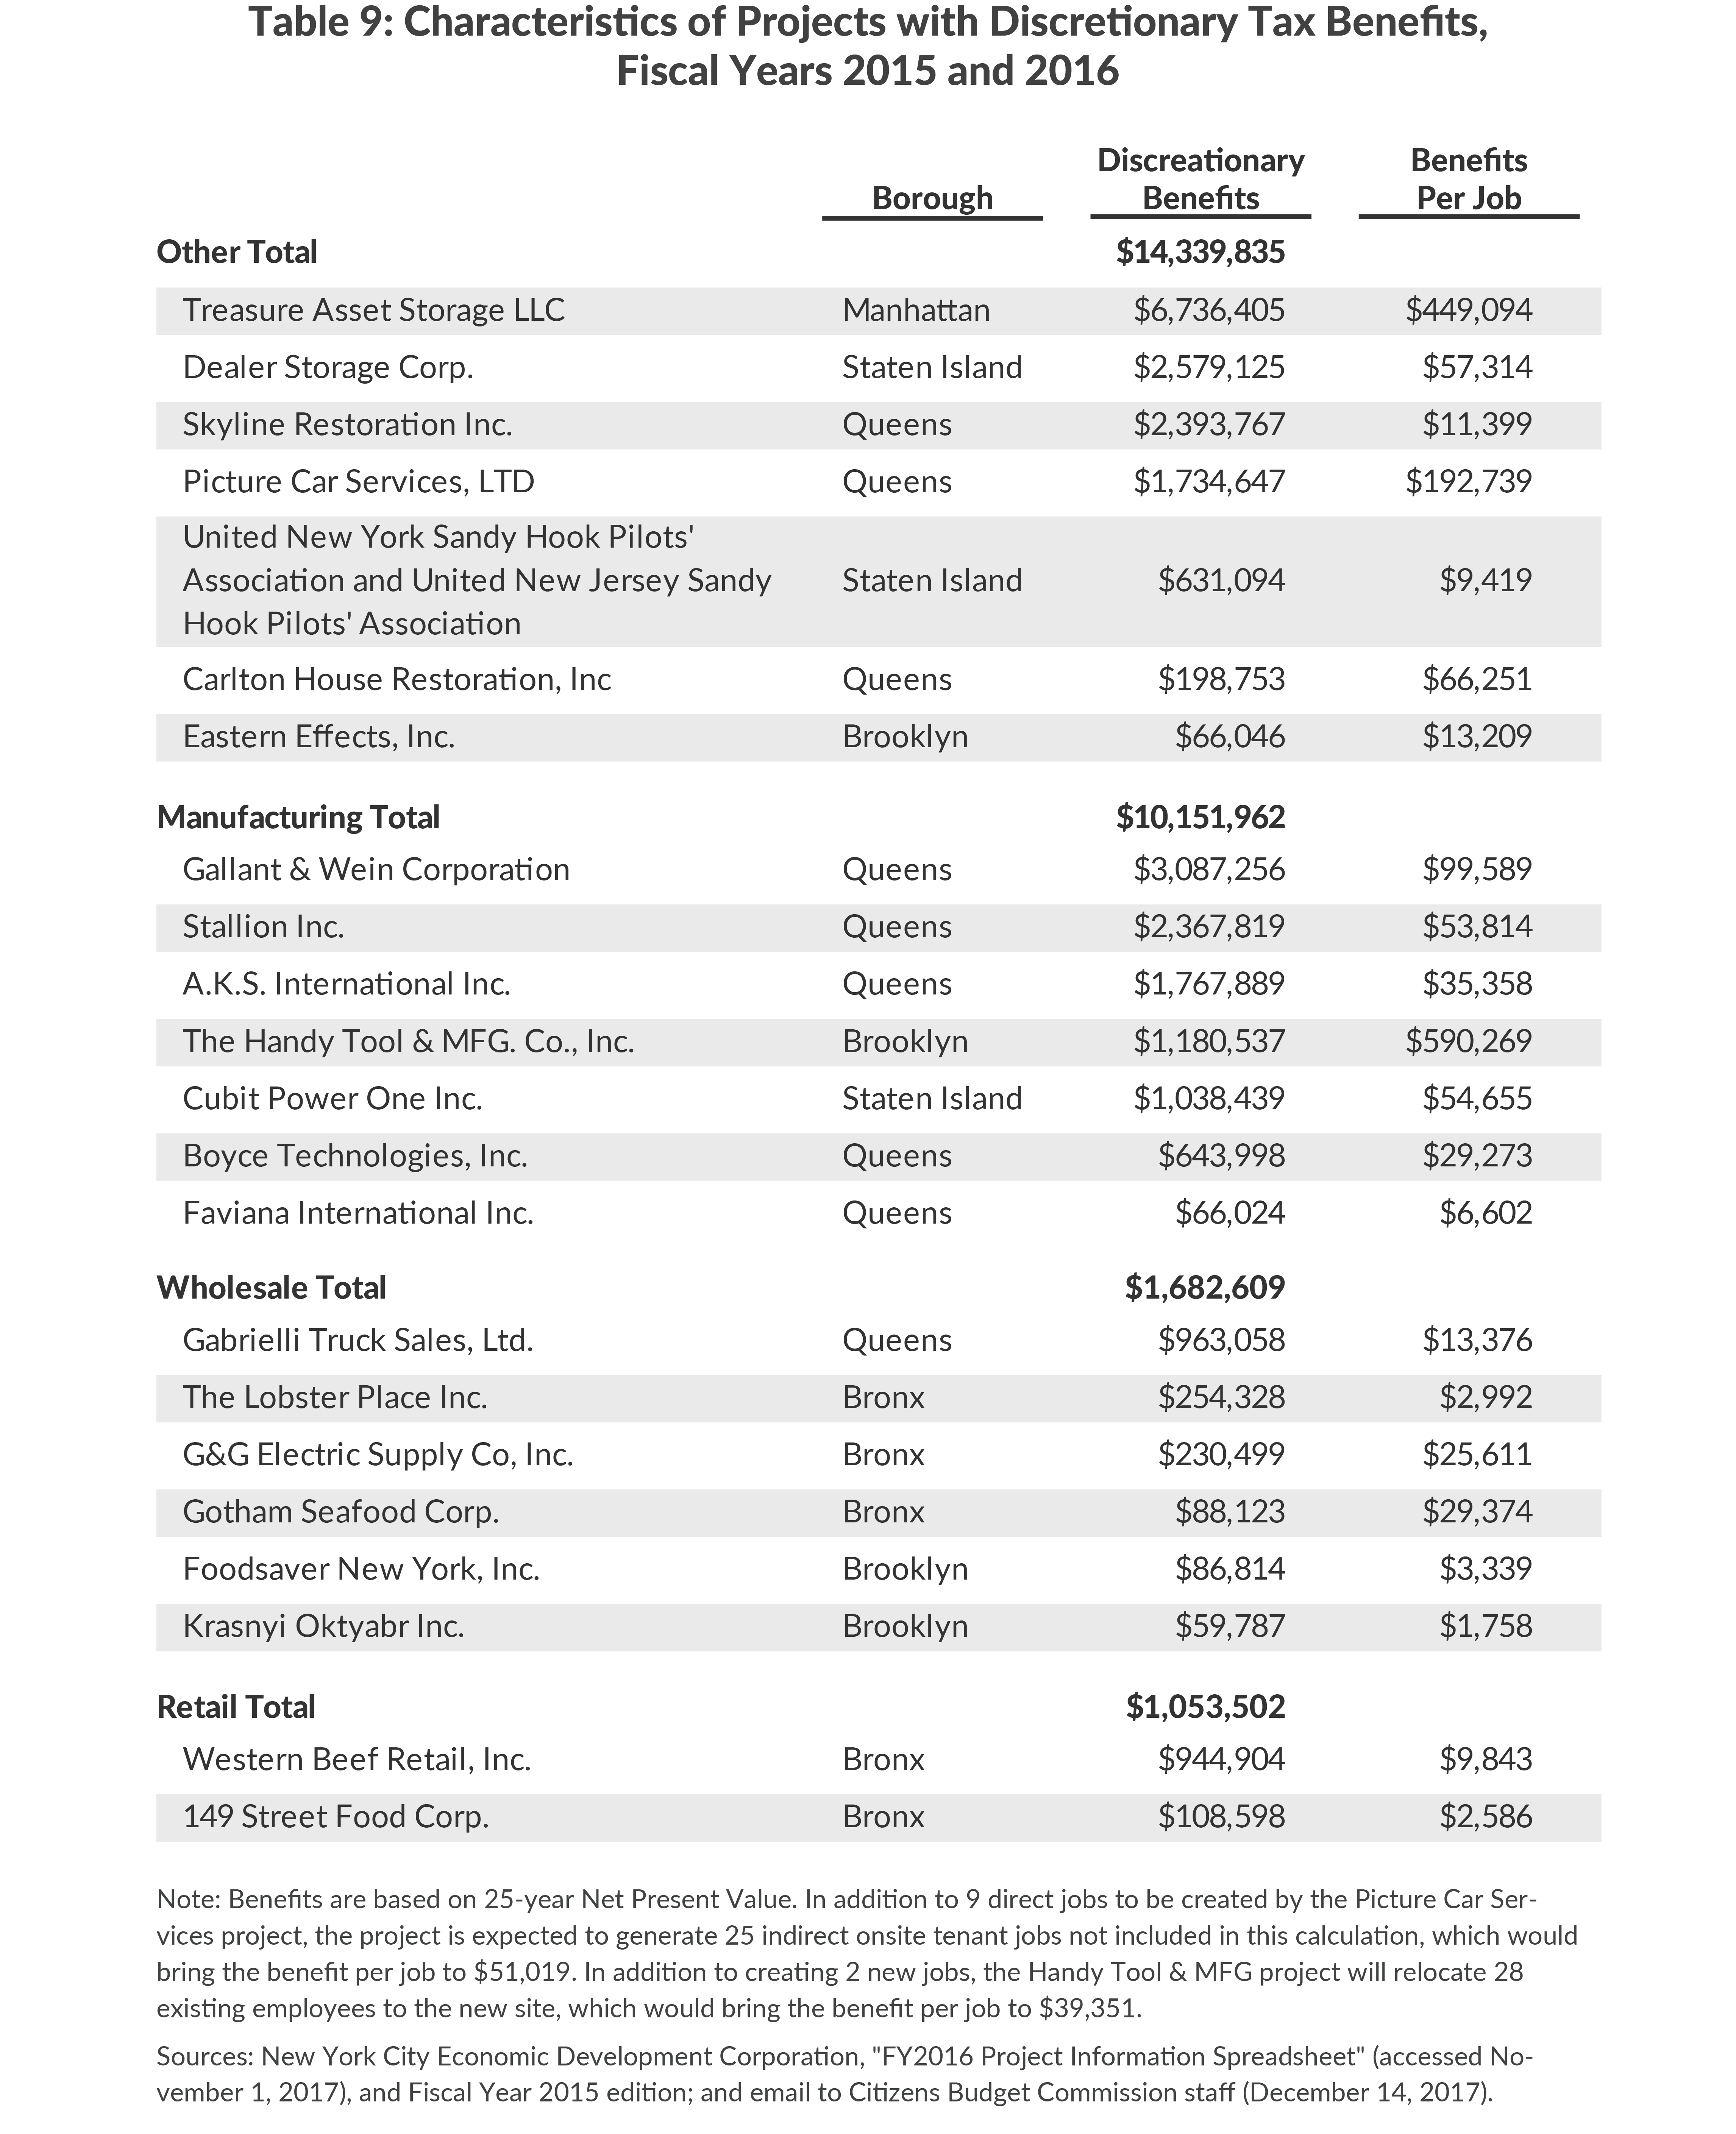
The per-job subsidy for projects granted discretionary benefits continues to vary widely, from $1,758 per job to $590,269 per job for projects initiated in fiscal years 2015 and 2016, with most receiving benefits below $30,000 per job.20 Three projects in Table 9 receive total assistance of more than $100,000 per job, yet EDC’s cost-benefit calculations for these projects showed benefits outweighing costs. Calculations include estimates of indirect benefits from the business activity of the recipient’s suppliers and induced benefits from the household spending of those employed by the recipient or its suppliers. In calculating indirect and induced benefits, EDC assumes that a business receiving its assistance would leave New York City if not for that assistance, an assumption that may lead to overstatement of these benefits.21 CBC’s previous call for a cap on per-job subsidy is still appropriate.
Capital Investment
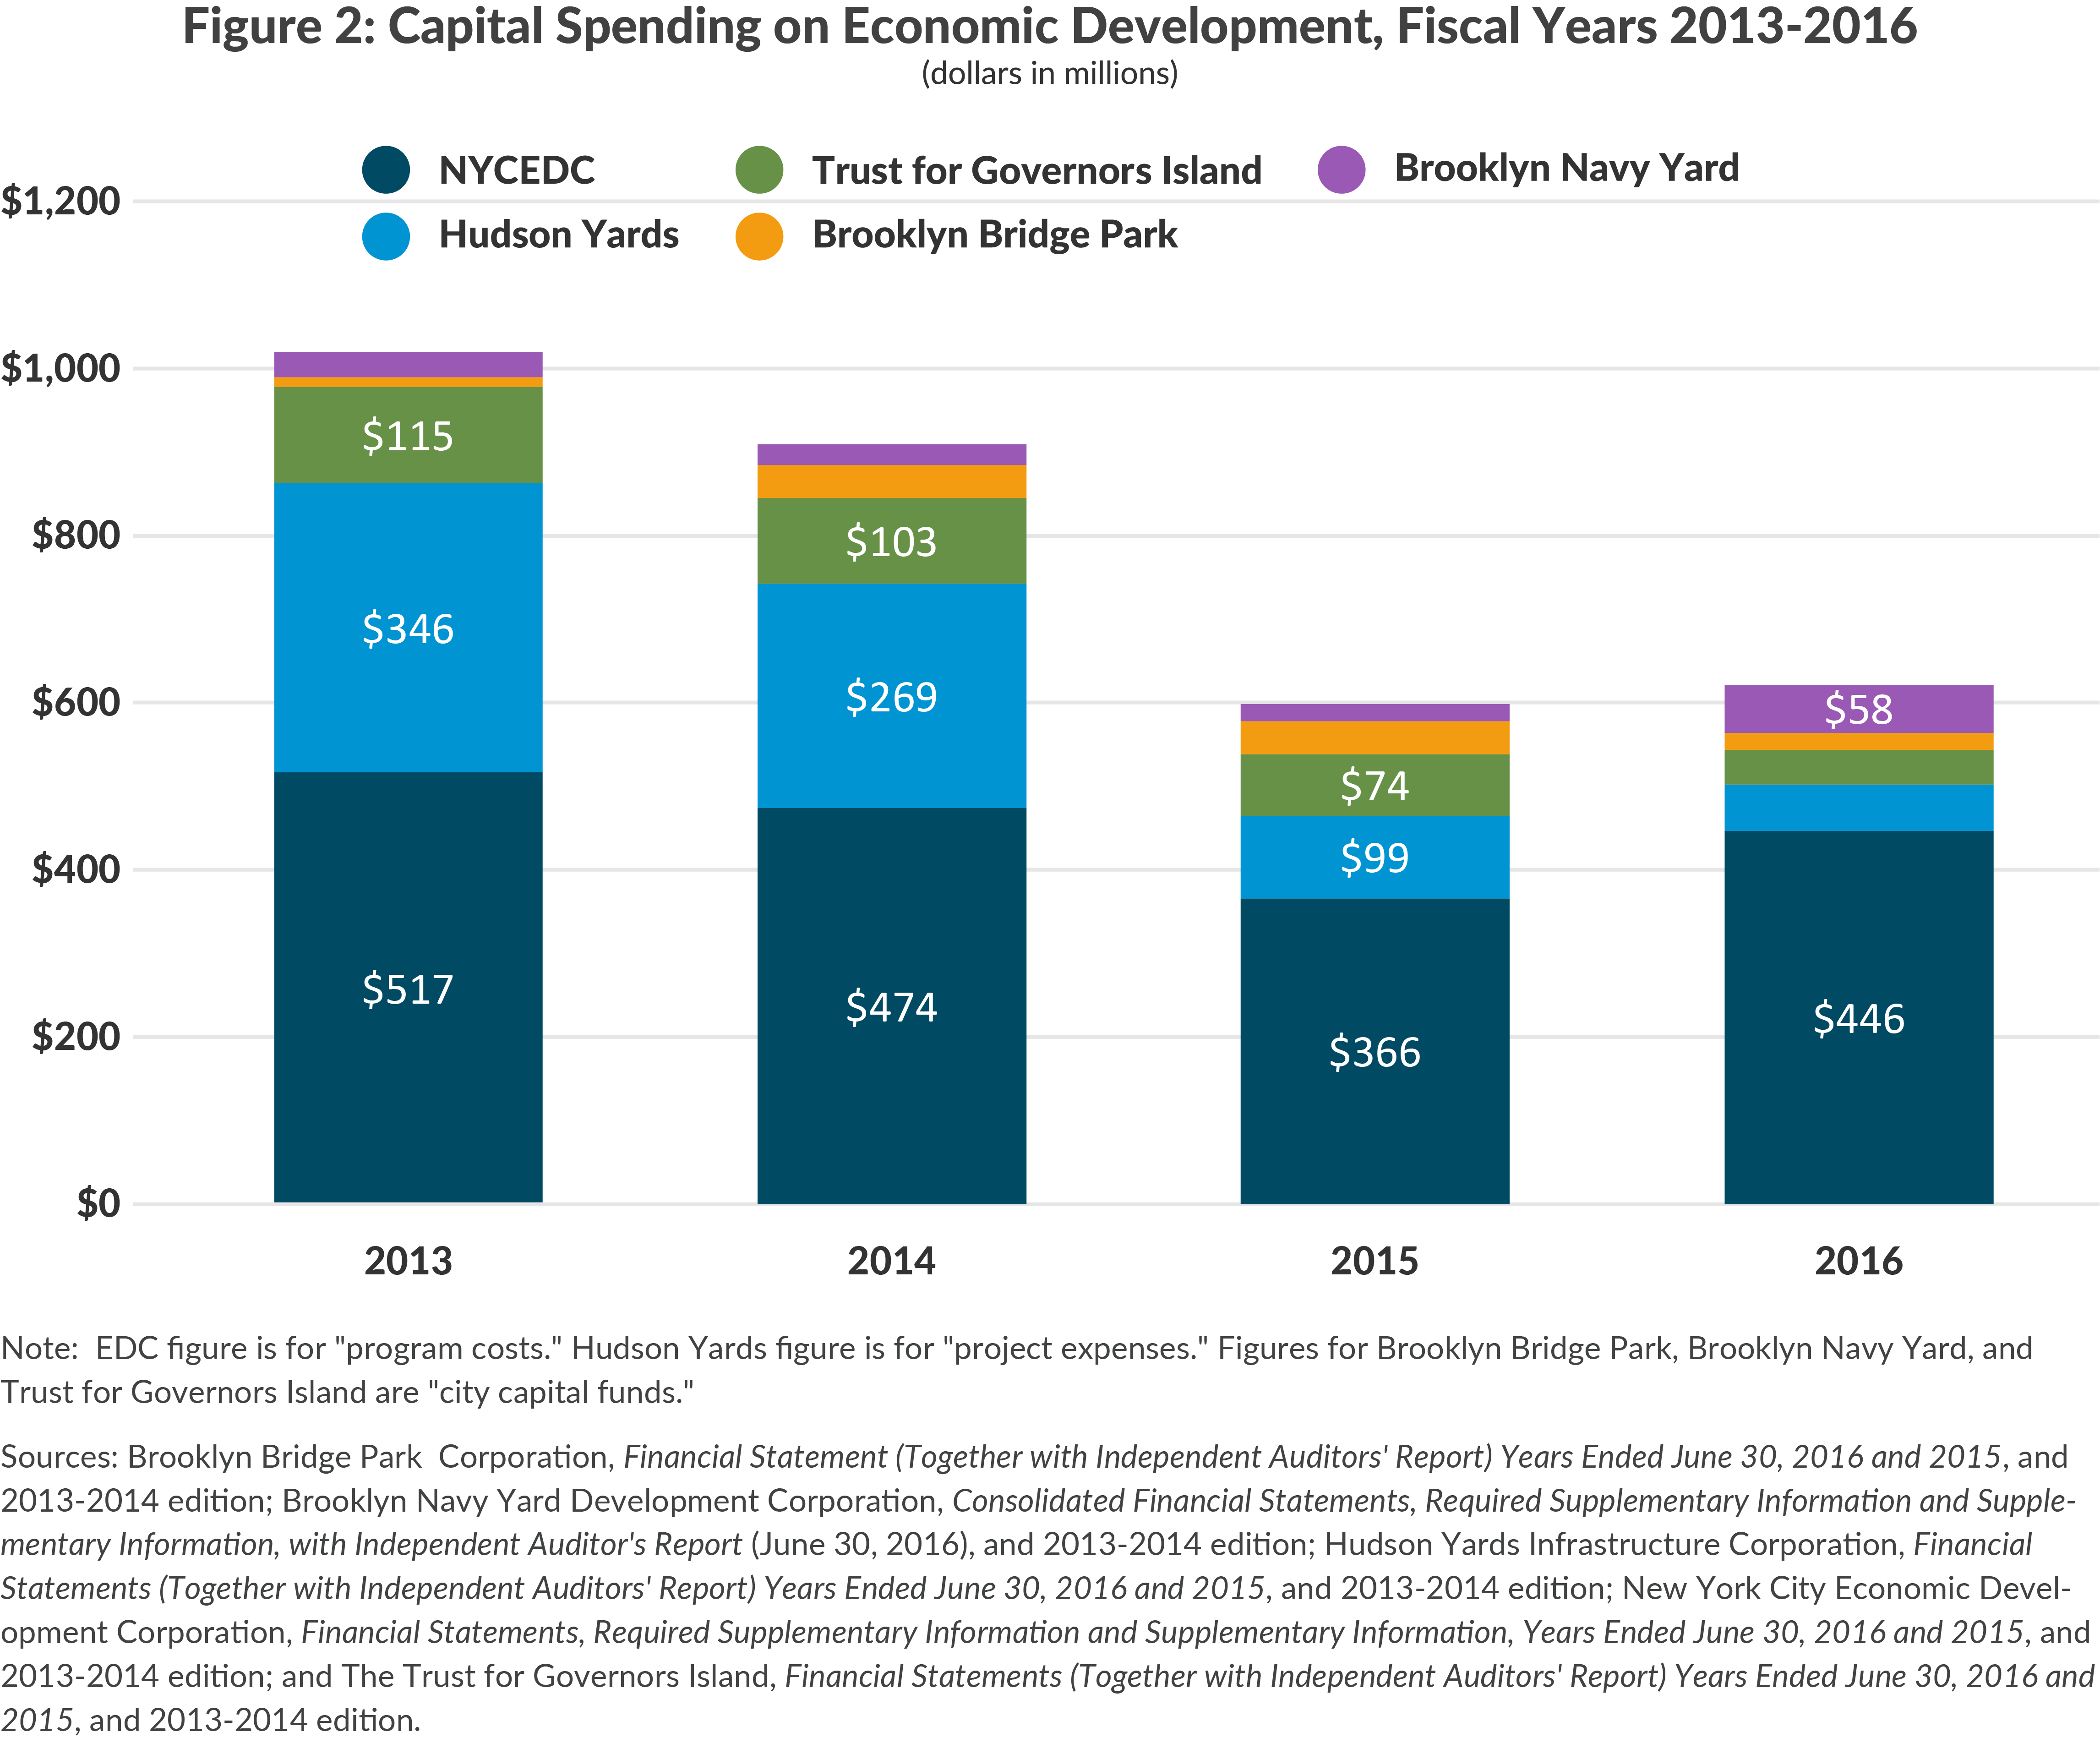
Since 2013 capital spending on economic development has declined from $1.0 billion to $622 million. The decrease is due to the conclusion of major projects funded by LDCs such as the Hudson Yards subway extension and the development of Governors Island. While these major projects have wound down, spending has increased modestly on the Brooklyn Navy Yard and Brooklyn Bridge Park since 2013. (See Figure 2.)
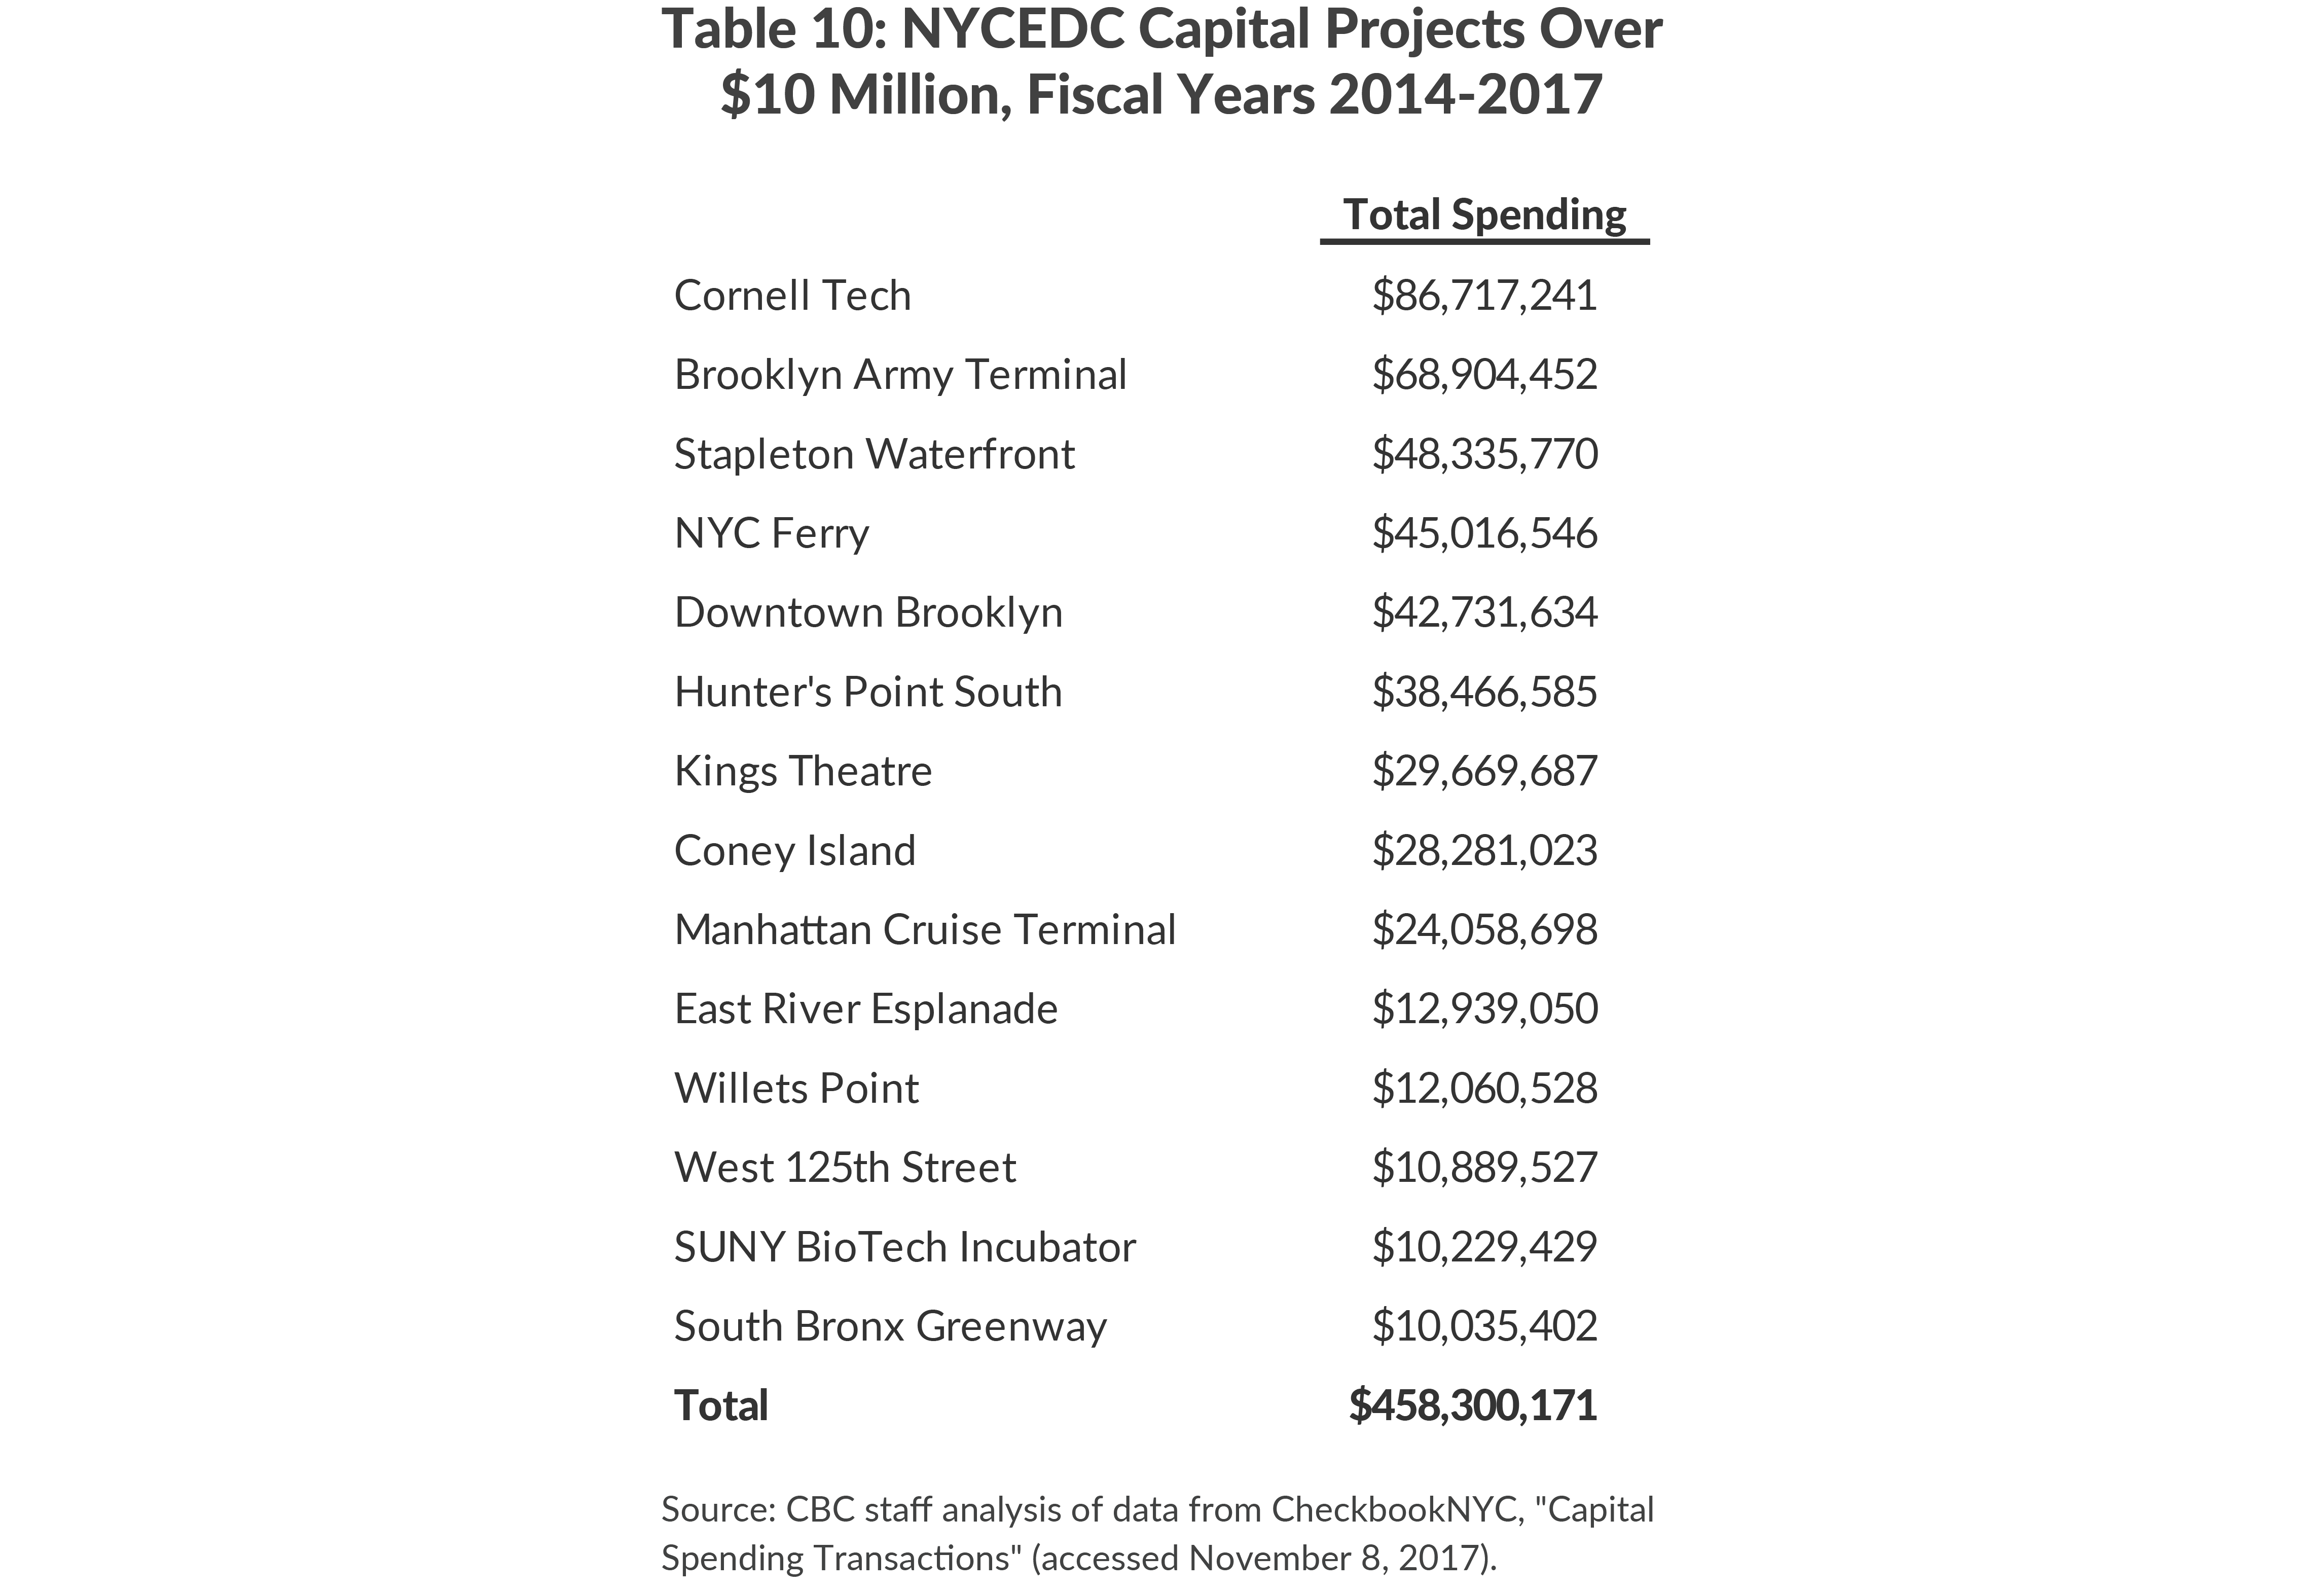
The largest EDC capital projects funded through SBS have been Cornell Tech, the Brooklyn Army Terminal, the Staten Island waterfront, and the NYC Ferry. (See Table 10.) Investment in some projects that commenced during the previous administration, such as Downtown Brooklyn, has slowed. Other projects have seen spending increase considerably including the Hunter’s Point South project in Long Island City and development along West 125th Street in Manhattan.
While the de Blasio administration has continued and expanded upon existing projects, only one, NYC Ferry, was first conceived during the mayor’s first term. Potential development at Sunnyside Yards, which would focus mainly on affordable housing, is still in the planning phase following a feasibility study. The Brooklyn-Queens Connector (BQX), a proposed streetcar along the Brooklyn and Queens waterfront, is also in the study and planning phase.22
Managing EDC
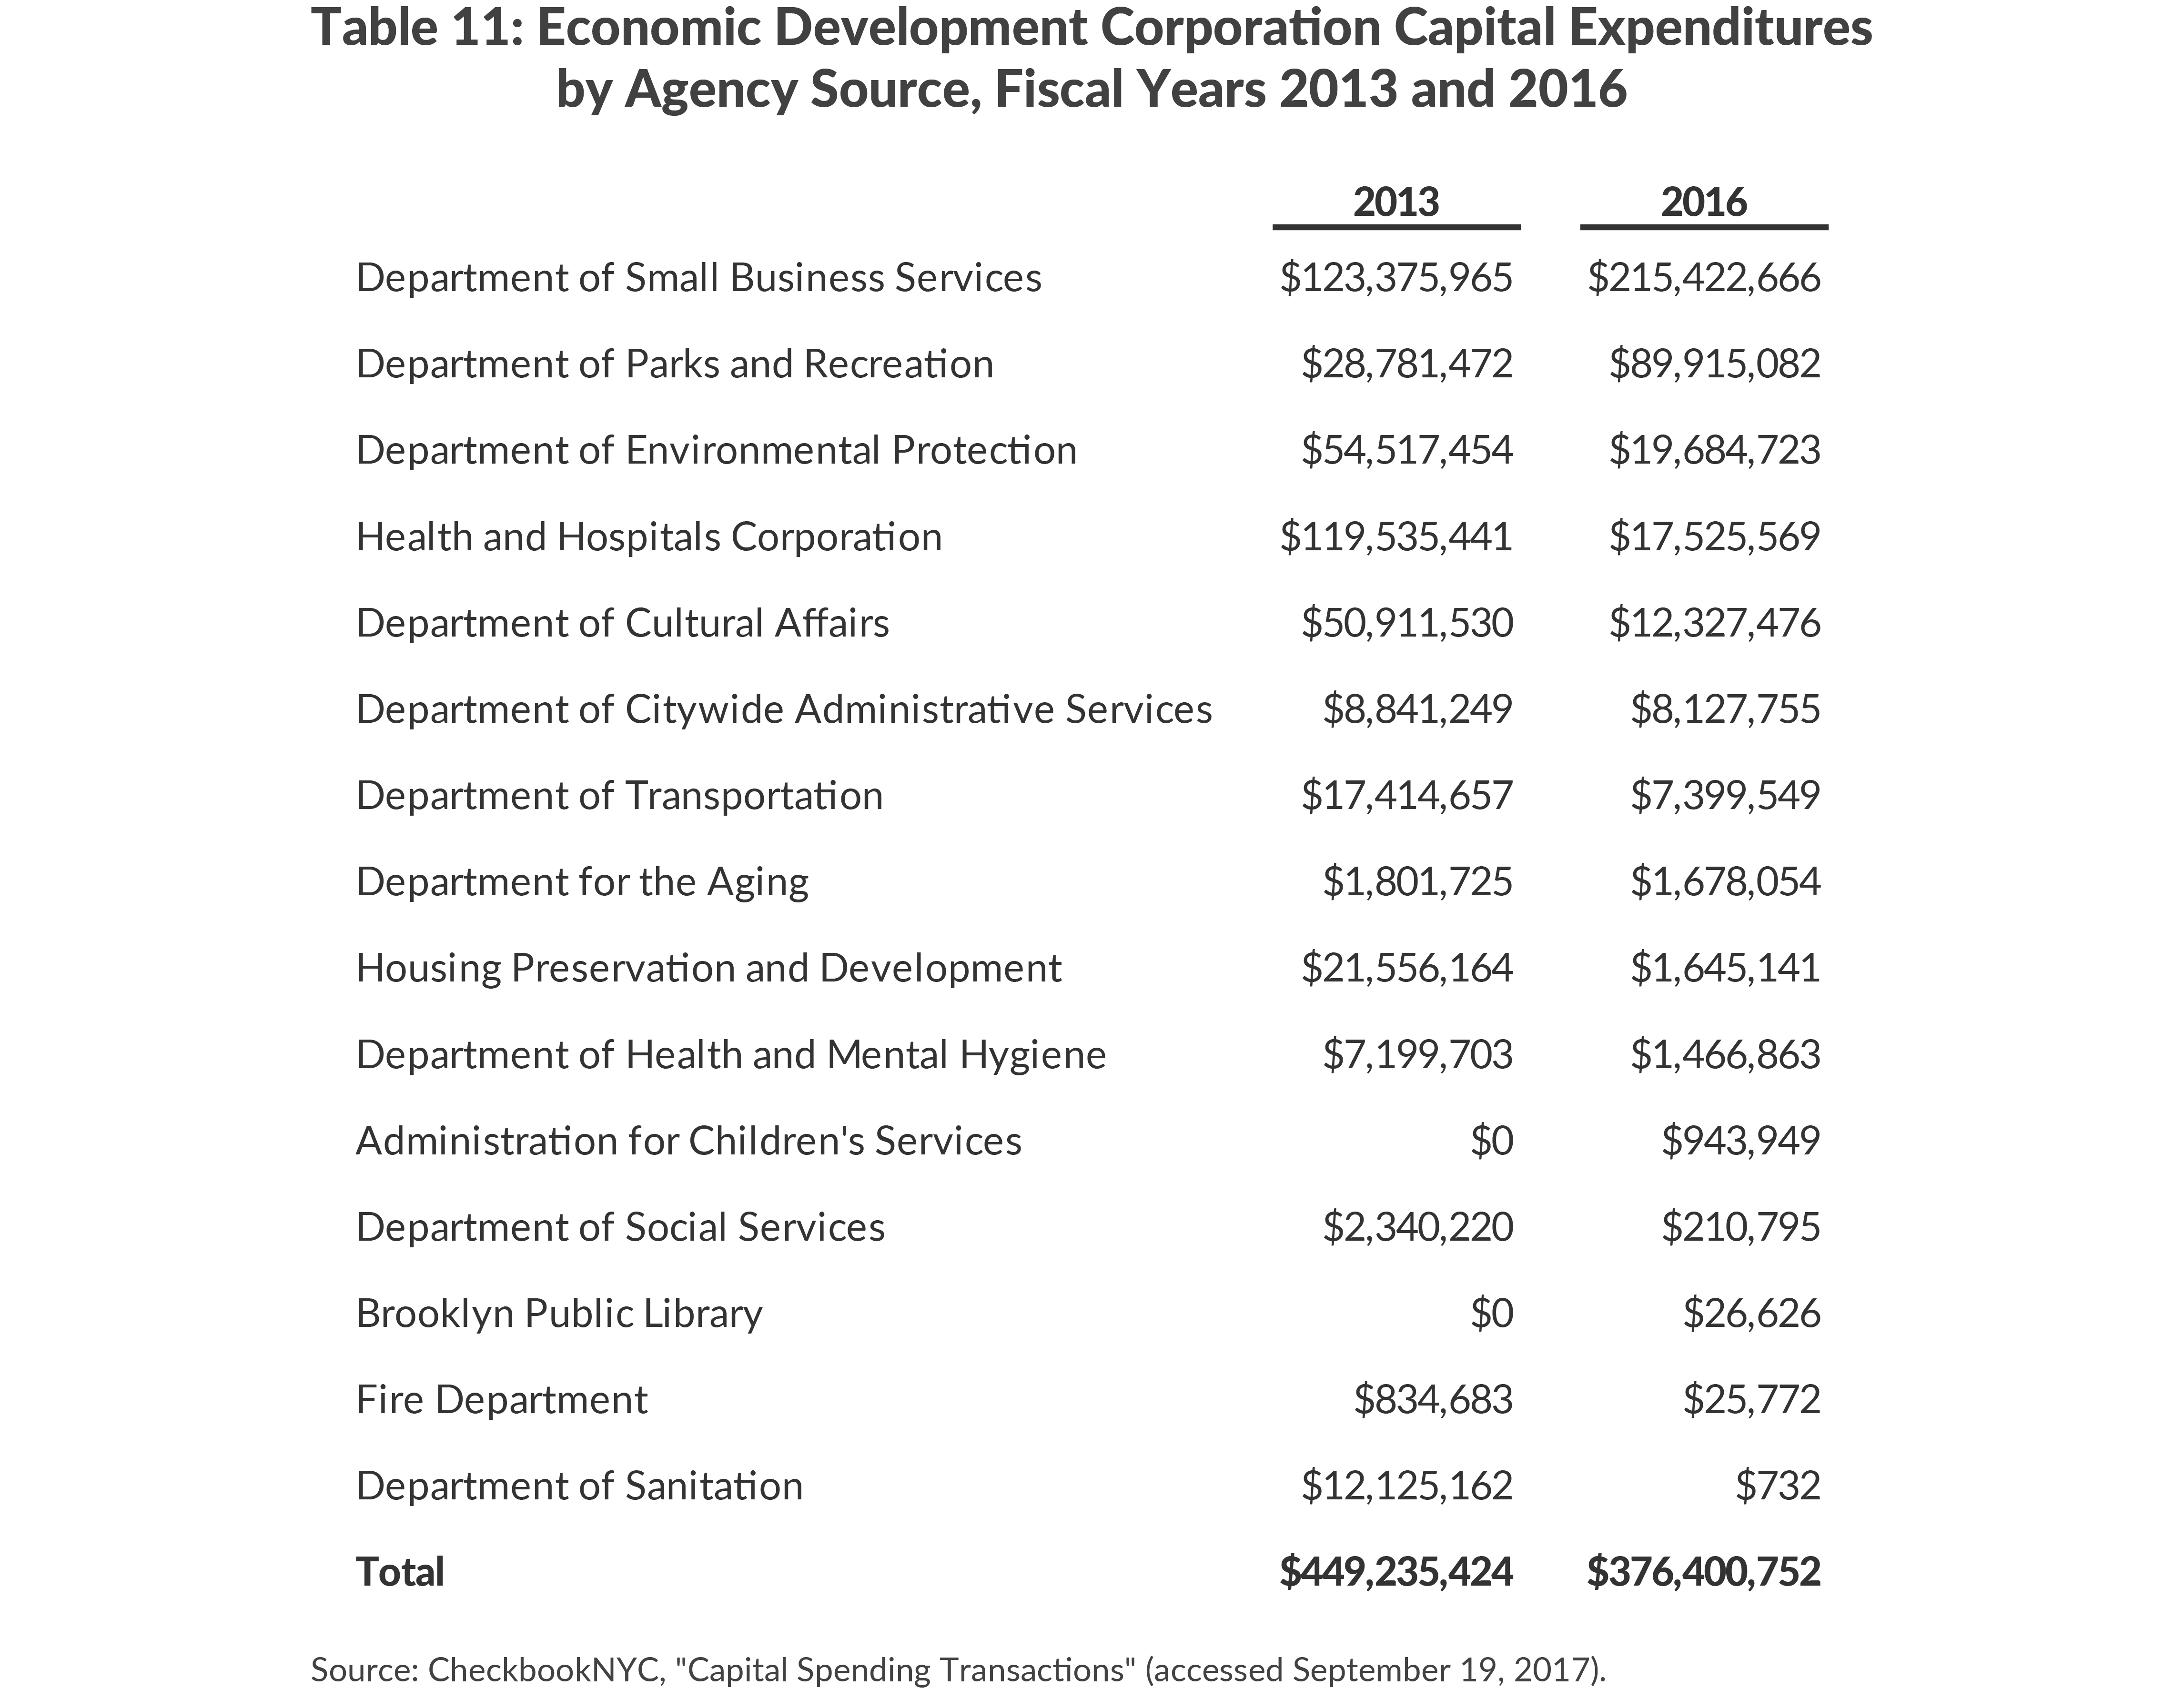
One concern identified in CBC’s 2013 report was that EDC had assumed the role of capital project manager for other agencies’ projects, including many with little relation to economic development. These projects are undertaken by EDC because of its success at managing capital projects and its greater freedom in the procurement process when compared to municipal agencies.23 This pulls EDC’s focus away from its core mission of job creation and discourages other agencies from seeking procurement reforms and improving their capacity to manage their own capital projects. Analysis of the source of capital expenditures made by EDC in 2013 and 2016 shows that SBS projects now make up a higher share, but projects for other agencies still total more than 40 percent of EDC capital spending.24 (See Table 11.)
At the same time, the scope of projects undertaken by EDC has broadened, with the expanded NYC Ferry system and proposed BQX streetcar under its purview. These are transportation projects in substance, which distract from EDC’s focus on job creation.
CBC also recommended that EDC increase the transparency of its reporting. It produces an annual report, as required by local law, with data on projects receiving discretionary tax benefits. However, it does not provide enough information to evaluate the full package of benefits provided to recipients, or the results of its other programs, including start-up incubators.25 Two bills recently passed by the City Council require additional reporting, including fiscal impact statements and analysis on recouping of benefits when project agreements are not met.26 These bills will improve transparency and should be signed by Mayor de Blasio, but they do not negate the need for reporting that covers the full scope of project benefits.
Conduit Financing
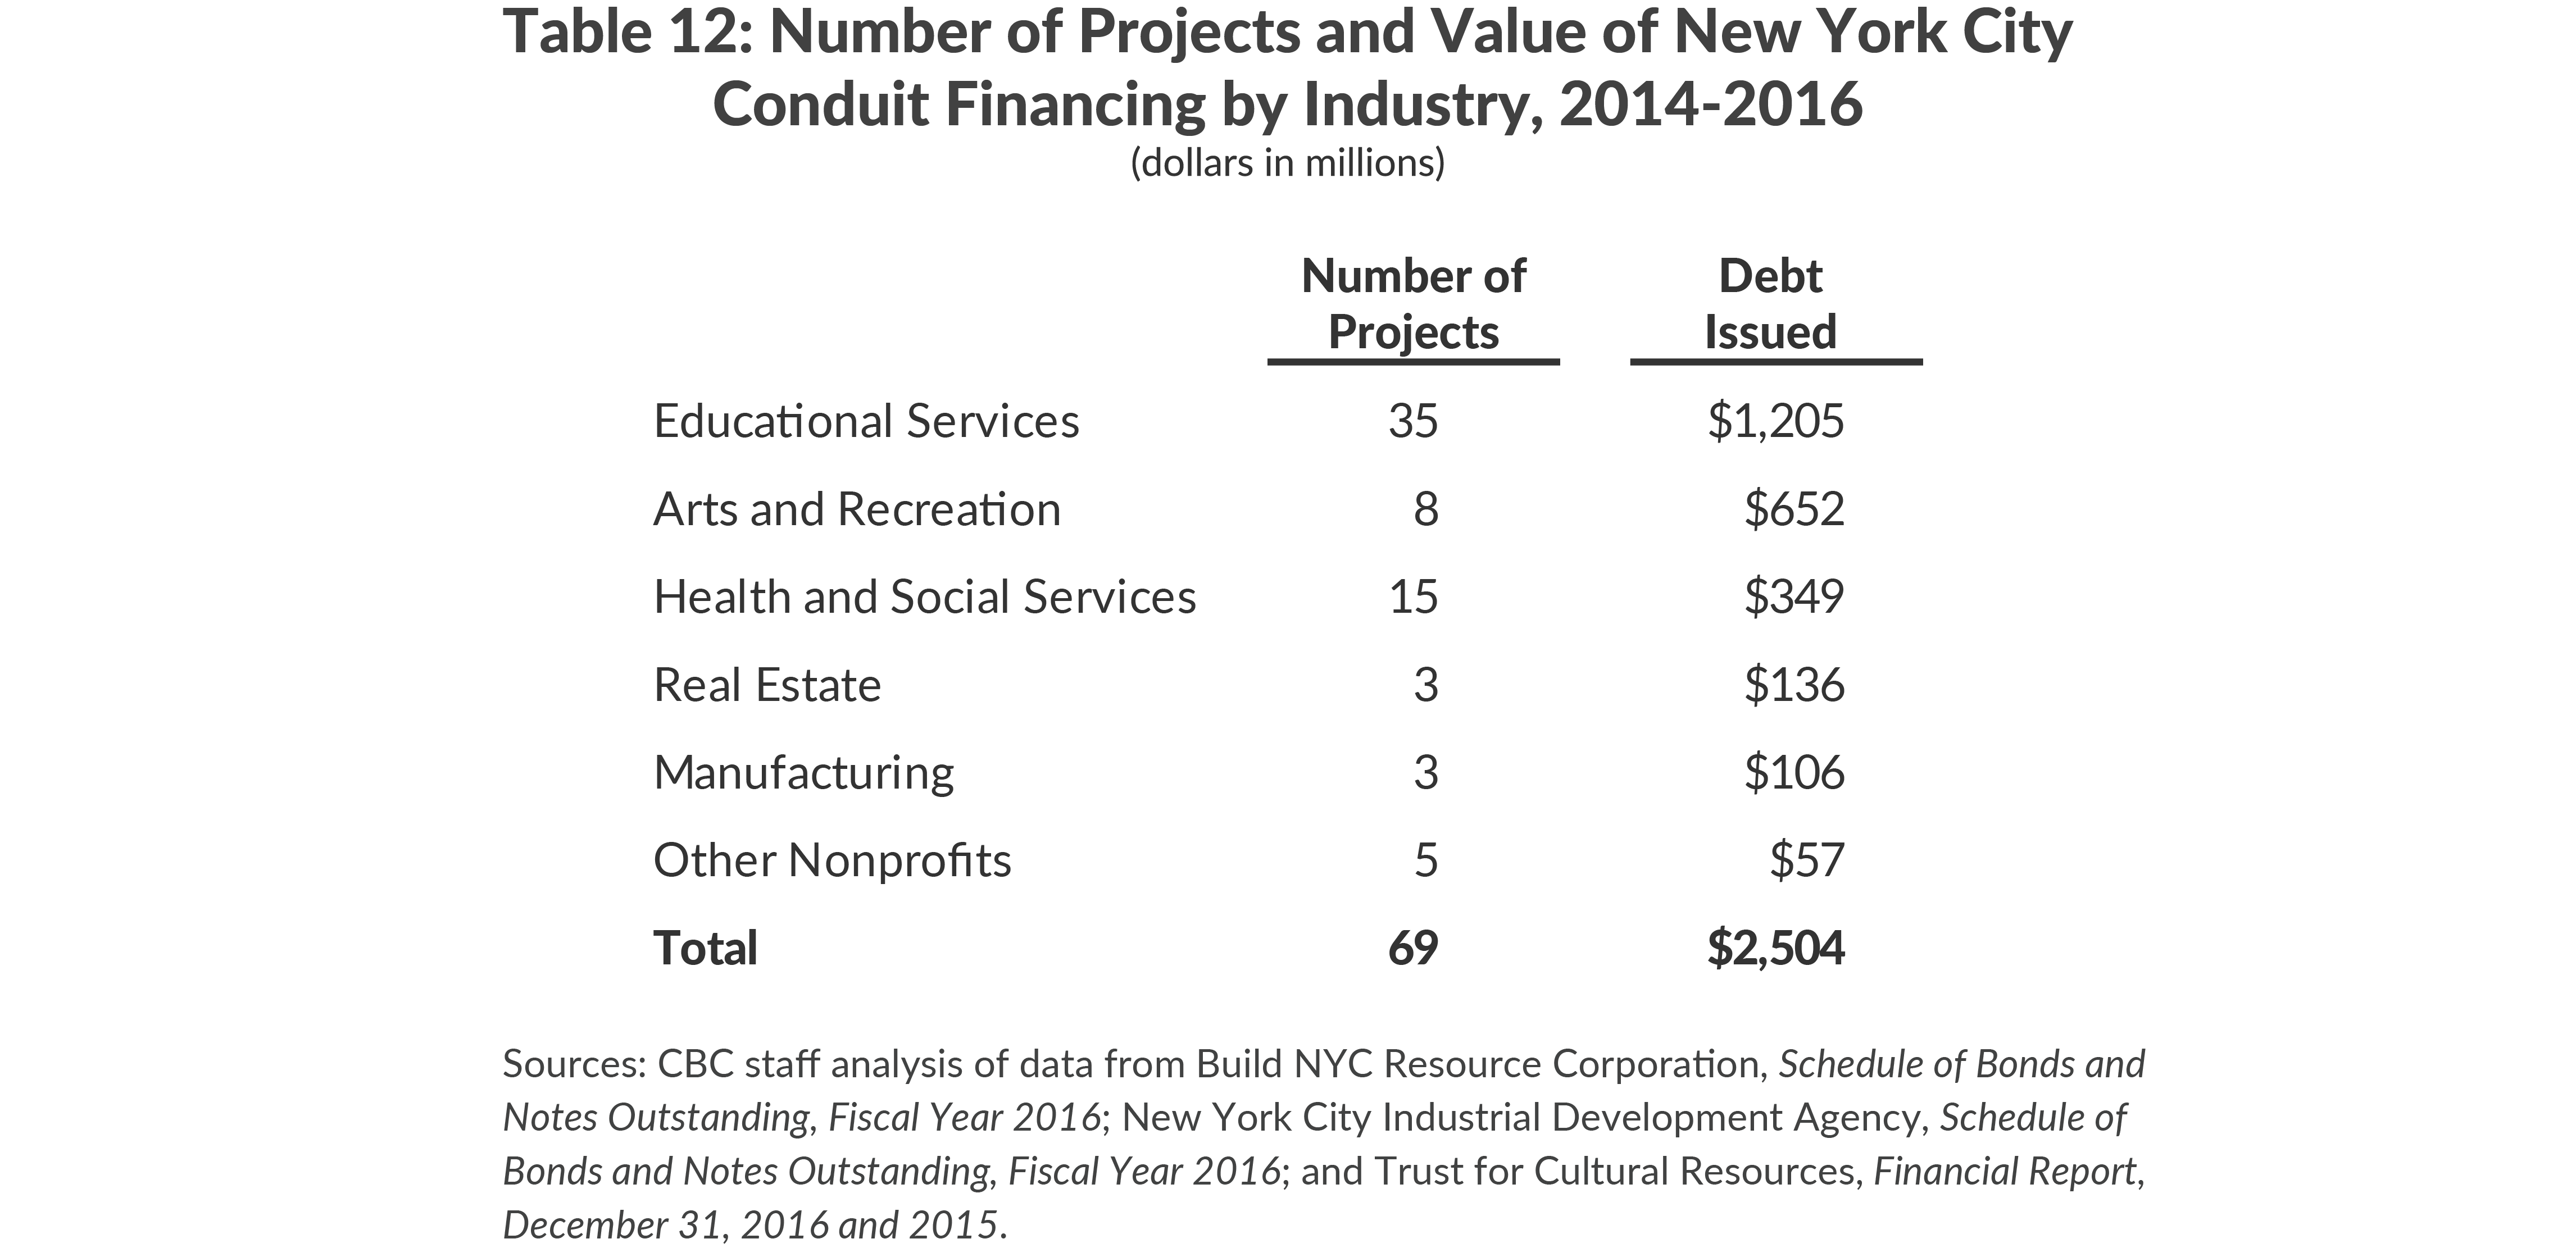
Because conduit financing is a low-risk way for the City to provide access to capital, CBC’s 2013 report recommended conduit financing to support nonprofit institutions in the cultural, educational, and health sectors. Together, these sectors were 26 percent of total employment in New York City in 2016, and job growth has been above the citywide average in each of these industries, though average wages are below the citywide average.27 From 2002 to 2012, 71 percent of projects were in these industries, representing 61 percent of debt issued.28 However, the majority of conduit debt issued to educational organizations has gone to private primary or secondary schools, many of which could afford higher-cost financing and do little to stimulate economic growth.
Since the beginning of Mayor de Blasio’s term, conduit financing has been further concentrated in these industries, constituting 87 percent of projects and 90 percent of debt issued since 2014.29 (See Table 12.)
A new source of financing for community development has been federal New Markets Tax Credits (NMTC). In 2016, the New York City Neighborhood Capital Corporation (NYCNCC) received its first NMTC allocation of $55 million. The tax credits are provided to investors in exchange for equity investment in NYCNCC, which in turn makes below-market loans to development projects in low-income neighborhoods. The four projects receiving NMTC financing so far include a medical center and youth center, suggesting that NMTC can be another means of support for nonprofit institutions in these industries.30
Conclusion
New York City’s economy has been undeniably strong since 2013; however, the sectors creating the most jobs have relatively low wages, and the poverty rate remains high. The City invests billions annually in programs and incentives for economic development, and the high cost of these efforts requires that they be managed carefully with a focus on cost-effectiveness.
Mayor de Blasio’s administration has made progress on some of the recommendations made by CBC in 2013. Conduit financing is more targeted, tax expenditures are being evaluated, and EDC is managing less capital spending for other agencies. Reforms are still needed on other recommendations: changes to the ICAP program should be considered, standards for discretionary tax benefits should be strengthened, and reporting should be made more comprehensive. Mayor de Blasio should move forward with these reforms in his second term to ensure New York City’s investments in its own economy are sound.
Footnotes
- City of New York, Office of the Mayor, One New York: The Plan for a Strong a Just City (April 22, 2015), www.nyc.gov/html/onenyc/downloads/pdf/publications/OneNYC.pdf.
- U.S. Census Bureau, American Community Survey 2016 1-Year Estimates, and 2013-2015 editions, www.census.gov/acs/www/data/data-tables-and-tools/.
- U.S. Census Bureau, American Community Survey 2016 1-Year Estimates, and 2013-2015 editions, www.census.gov/acs/www/data/data-tables-and-tools/.
- City of New York, Office of the Mayor, New York Works: Creating Good Jobs (June 15, 2017), https://newyorkworks.cityofnewyork.us/.
- This calculation looks at average wages in entire sectors, while the methodology of the New York Works plan focused on roles within various sectors that showed potential for growth and average annual wages above $50,000. New York City Economic Development Corporation, email to Citizens Budget commission staff (December 14, 2017).
- Industries included in the “innovation industries” definition are given by NAICS codes 2111, 3112, 3113, 3114, 3115, 3118, 3119, 315, 324, 3254, 3259, 3271, 3279, 3311, 3313, 3315, 3332, 3333, 3339, 334, 3351, 3353, 3363, 3364, 3366, 3391, 3399, 4539, 4541, 511, 512, 515, 5171, 5172, 5174, 5179, 518, 519, 5413, 5414, 5415, 5416, 5417, 5418, 6215, 7111, 7115, and 712. Not all are included in Table 3.
- New York City Office of the Mayor, The Five Borough Economic Opportunity Plan (2009), www.nyc.gov/html/econplan/downloads/pdf/ceop_final.pdf.
- New York City Economic Development Corporation, “NYCEDC Announces New Office Anchor Strategy to Create Space for Jobs Outside Central Business District” (press release, May 31, 2017), www.nycedc.com/press-release/nycedc-announces-new-office-anchor-strategy-create-space-jobs-outside-central-business.
- Some state agencies, such as Empire State Development (ESD) include New York City in statewide programs, and ESD operates several subsidiaries specific to the city, including the Atlantic Yards Community Development Corporation and the Queens West Development Corporation. In addition the activities of some state authorities, such as the Port Authority of New York and New Jersey and the New York Power Authority, include economic development efforts in New York City. State agencies, authorities, and their subsidiary organizations are not included in this analysis.
- The Department of Finance includes several other tax expenditures in their definition of economic development tax expenditures, which totals $3.2 billion in 2017. See City of New York, Department of Finance, Annual Report on Tax Expenditures for Fiscal Year 2017 (February 2017), p. 159, www1.nyc.gov/assets/finance/downloads/pdf/reports/reports-tax-expenditure/ter_2017_final.pdf.
- The 42nd Street Development Project was initiated in the 1990s as a partnership between EDC and Empire State Development (ESD). At that time, an agreement was made that ESD would lead the project and have ownership interest of the properties, until 2012, when the state would transfer ownership to EDC. These properties, as well as properties in Downtown Brooklyn/MetroTech, had previously received tax benefits via ESD. New York City Economic Development Corporation, email to Citizens Budget commission staff (November 30, 2017).
- CBC staff analysis of data from Build NYC Resource Corporation, Schedule of Bonds and Notes Outstanding, Fiscal Year 2016; New York City Industrial Development Agency, Schedule of Bonds and Notes Outstanding, Fiscal Year 2016; and Trust for Cultural Resources, Financial Report, December 31, 2016 and 2015.
- City of New York, Department of Finance, Annual Report on Tax Expenditures for Fiscal Year 2017 (February 2017), p. 11, www1.nyc.gov/assets/finance/downloads/pdf/reports/reports-tax-expenditure/ter_2017_final.pdf.
- Francesco Brindisi and David Ehrenberg, The New York City Real Property Tax Industrial and Commercial Incentive Program (ICIP): Description and Analysis (2008), www.taxadmin.org/assets/docs/Meetings/08rev_est/brindisi2.pdf.
- Rahul Jain, Managing Economic Development Programs in New York City: Lessons for the Next Mayor From the Past Decade (Citizens Budget Commission, December 2013), https://cbcny.org/research/managing-economic-development-programs-nyc-lessons-next-mayor-past-decade.
- New York State Legislature, A40001, Part E (signed July 29, 2017).
- Task Force on Economic Development Tax Expenditures, “Lessons from Evaluating the Industrial and Commercial Abatement Program,” New York City Council Working Paper (July 11, 2016).
- Local Laws of the City of New York for the Year 2017, No. 18 (February 15, 2017).
- Bill de Blasio, Mayor of the City of New York, “Transcript: Mayor de Blasio Announces 11 Sites Added to Community Parks Initiative” (press conference, question and answer portion, September 25, 2017), http://www1.nyc.gov/office-of-the-mayor/news/618-17/transcript-mayor-de-blasio-11-sites-added-community-parks-initiative; City of New York, Office of the Mayor, State of the City Remarks by Mayor de Blasio, as Prepared for Delivery (February 10, 2014), http://www1.nyc.gov/office-of-the-mayor/news/045-14/state-the-city-remarks-mayor-de-blasio-prepared-delivery#/0; and New York City Economic Development Corporation, “Mayor de Blasio Announces Aetna to Locate Corporate Headquarters, 250 Good-Paying Jobs in New York City” (press release, June 29, 2017), www.nycedc.com/press-release/mayor-de-blasio-announces-aetna-locate-corporate-headquarters-250-good-paying-jobs-new.
- New York City Economic Development Corporation, "FY2016 Project Information Spreadsheet" (accessed November 1, 2017), www.nycedc.com/about-nycedc/financial-public-documents; and Fiscal Year 2015 edition, www.nycedc.com/about-nycedc/financial-public-documents.
- New York City Economic Development Corporation, Annual Investment Projects Report Pursuant to City Charter §1301(1)(b) FY 2016, Volume I (January 30, 2017), pp. 10-11, 49-56, www.nycedc.com/sites/default/files/filemanager/CityCharter_2016_Vol_I.pdf.
- Construction of the BQX is meant to be paid for by capturing the increase in property values and new development along the route, not through City or EDC capital spending.
- EDC can do single-source contracting and has task order contracts with management consulting, engineering, and construction management firms. EDC also can do construction management at risk contracting, in which the construction manager holds all construction contracts. See: New York City Economic Development Corporation, Contracts Procurement Manual, www.nyc.gov/html/recovery/downloads/pdf/NYCEDC_Procurement_manual.pdf.
- CheckbookNYC, “Capital Spending Transactions” (accessed November 8, 2017), www.checkbooknyc.com/spending_landing/category/3/yeartype/B/year/119?expandBottomContURL=/panel_html/spending_transactions/spending/transactions/category/3/yeartype/B/year/119/dtsmnid/502.
- Rahul Jain, “Economic Development Reporting in New York City: What’s Missing?” Citizens Budget Commission Blog (April 11, 2012), https://cbcny.org/research/economic-development-reporting-new-york-city-whats-missing.
- New York City Council, Int 1316-2016 and Int 1322-2016.