Mapping School Aid by District
School Year 2023-24
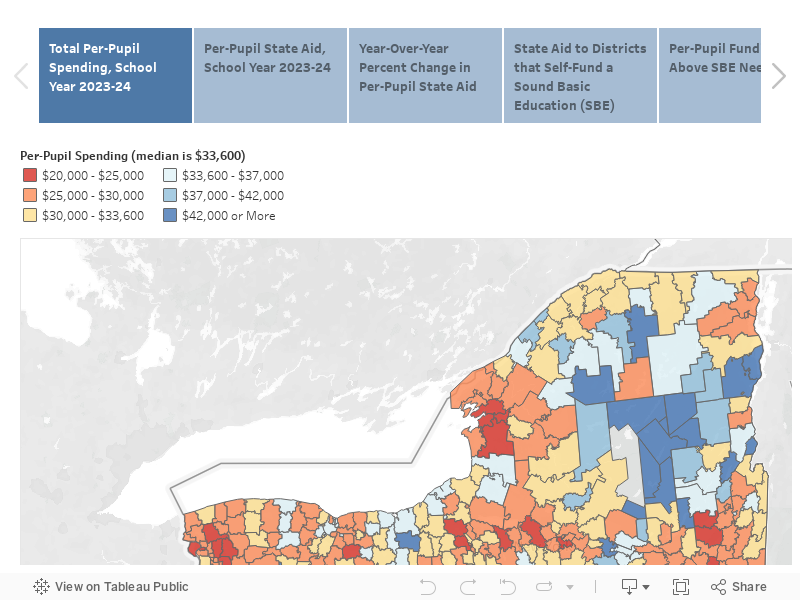
The series of maps below provide district-level data on the distribution of school spending, State school aid, enrollment change, and other data for school year 2023-24. Detailed data for specific districts can be viewed by hovering over the districts. For more on our analysis of school aid in the 2023-24 Enacted Budget see our report The Learning Ledger.
Some of the key findings from the report and data are:
- State school aid increases 8.8 percent from $34.4 billion to $37.4 billion from year to year;
- Per-pupil State aid rises 10.2 percent;
- $2.8 billion is directed to 152 districts that fully support a Sound Basic Education (SBE) with local and regular federal funding; and
- An additional $8.6 billion in State aid goes to other districts in excess of the SBE level.
See the technical appendix below for more information on the data sources and calculations.
Technical Appendix
District Omissions: Ten districts are excluded from the map view. Eight of these districts are ineligible for most State aid because they employ fewer than eight teachers. Four of these districts (South Mountain, Piseco Common, Raquette Lake, and Inlet Common) contract with neighboring districts for educational services, while the other four districts (North Greenbush Common, Wainscott Common, Sagaponack Common, and New Suffolk Common) operate only elementary schools with low enrollment, while contracting with neighboring districts for students in higher grades. Two additional districts (Laurens and Montauk) are excluded because data were not included in the Enacted Budget school aid runs for the upcoming school year due to possible inconsistencies.
Spending Calculations and Estimates: Spending figures contain estimated funding for the 2023-24 school year by district calculated as follows:
Federal: Regular federal aid is equal to actual federal aid from the 2020-21 Masterfiles. Extraordinary federal aid from COVID relief bills is not included in this analysis.
State: Includes all aid included in the 2023-24 school aid runs plus estimated School Tax Relief (STAR) gross program costs within the district (based on total planned STAR costs for school year 2023-24 proportional to actual STAR costs in 2020-21).
Local: Local funding is estimated based on actual local revenue from the 2020-21 Masterfiles increased by the allowable tax levy growth factor in each subsequent year, and reduced by the personal income tax credit portion of STAR. This approach varies from prior CBC school aid analyses that did not net out the personal income tax credit portion of STAR.
Sound Basic Education (SBE): Each district’s SBE amount is calculated by CBC by adding the “foundation amount” reported in school aid runs plus other expense-based aid for transportation, construction, and other costs for school year 2020-21 from Masterfiles inflated by CPI factors reported by the Office of the New York State Comptroller.
Wealth Decile Calculations: Wealth deciles are based on the average of a district’s free and reduced-price lunch share and census poverty share, divided by the district’s combined wealth ratio as determined by New York State Education Department (NYSED). The resulting figure is then indexed to the state average to determine a needs index.
Districts with Resources in Excess of SBE: The “State Aid to Districts That Self-Fund a Sound Basic Education (SBE)” map contains data only for the 152 districts where local resources and regular federal aid exceeds the calculated SBE amount. The total amount of State aid directed to these 152 districts is $2.8 billion. The “Per-Pupil State Funding in Excess of SBE Needs” map reflects the difference between each district’s SBE per student and its total spending per student, (up to the district’s State aid subtotal). For five districts, this value is negative, reflecting an SBE shortfall totaling $9.6 million. The total for all other districts’ State aid in excess of an SBE is $11.4 billion (this figure includes the $2.8 billion in State aid allocated to districts that self-fund an SBE.)
Enrollment: Enrollment estimates are based on school year 2023-24 enacted budget school aid runs.
Sources
New York State Education Department, Fiscal Analysis & Research Unit, “Masterfile for 2020-21” (last updated January 31, 2023), https://oms32.nysed.gov/faru/Profiles/2020-21_FiscalProfiles.html, “FY 2024 Enacted Budget School Aid Files” (received via email on May 3, 2023); New York State Division of the Budget, FY 2024 Enacted Budget Financial Plan (June 2023), www.budget.ny.gov/pubs/archive/fy24/en/fy24en-fp.pdf; Office of the New York State Comptroller, Inflation and Allowable Levy Growth Factors (July 2023), www.osc.state.ny.us/files/local-government/property-tax-cap/pdf/inflation-and-allowable-levy-growth-factors.pdf; and City of New York, Office of Management and Budget, Fiscal Year 2024 Adopted Budget: Expense, Revenue, and Contract Budget (July 3, 2023), https://www.nyc.gov/assets/omb/downloads/pdf/erc6-23.pdf.