More Money, Little Accountability
New York Continues to Increase State School Aid
This school year, New York State school aid will total $34.4 billion, a 6.7 percent increase from last school year. With enrollment declining, per-pupil State aid increases by 9.4 percent this year. New York State’s schools spend nearly twice the national average per student, without delivering above-average results in achievement. Furthermore, New York State continues to increase support to wealthy districts, now providing $3.1 billion to districts that already generate and spend sufficient local resources to provide the State’s constitutionally guaranteed Sound Basic Education (SBE).1 While the State continues its significant, multi-year increase in education aid, and federal COVID aid is providing an additional $11 billion for local districts over four years, the State still lacks an adequate process to monitor performance, identify and spread best practices, and hold school districts accountable for accelerating student achievement, reversing pandemic-related learning loss, and narrowing disparities.
Specifically, CBC's analysis found that:
- State school aid increases 6.7 percent this year, to $34.4 billion;
- Per-pupil State aid increases 9.4 percent to $13,868 this year as enrollment declines;
- Per-pupil spending from local, State, and federal funds, excluding federal COVID-related aid, increases 7.4 percent to $32,757;
- COVID-related federal education aid of $3.8 billion for 2022-23 increases the average per-student spending to $34,272;
- New York State directs $3.1 billion (9 percent of State aid) to 176 districts that already fund an SBE with local and regular federal resources;2
- Another $10.5 billion (31 percent of State aid) is provided to districts in amounts exceeding what is needed to fund an SBE;
- Only four districts’ funding remains below the level needed to provide an SBE, with a $14.7 million shortfall; and
- The State does not have adequate systems to drive and measure performance and hold school districts accountable for accelerating achievement, reversing learning loss, and narrowing disparities.
Given its current fiscal stress and high taxes, the State should stop increasing aid to wealthy districts that fund an SBE through local revenue and regular federal aid; consider freezing aid to better-off districts which already receive State aid in excess of the amount needed for an SBE; and reform both Foundation Aid and many of the expense-based aids to direct more of the funds to high-need districts. To promote fiscal stability, the State should reduce over time the aid it provides to the highest-wealth districts that already receive enough local and federal funding for an SBE. The State should identify and spread best practices and implement a robust performance management system to track outcomes, quality, and efficiency of services across districts and require under-performing districts to implement action plans to improve their performance.
Mapping School Aid by District
For district-level data on total spending, State aid, enrollment, and Sound Basic Education (SBE) funding comparisons see “Mapping School Aid by District,” which shows statewide maps of district-level data. These maps illustrate differences in district spending levels and the distribution of State aid in excess of SBE levels.
State School Aid Increases 6.7 Percent in Total and 9.4 Percent per Pupil This School Year
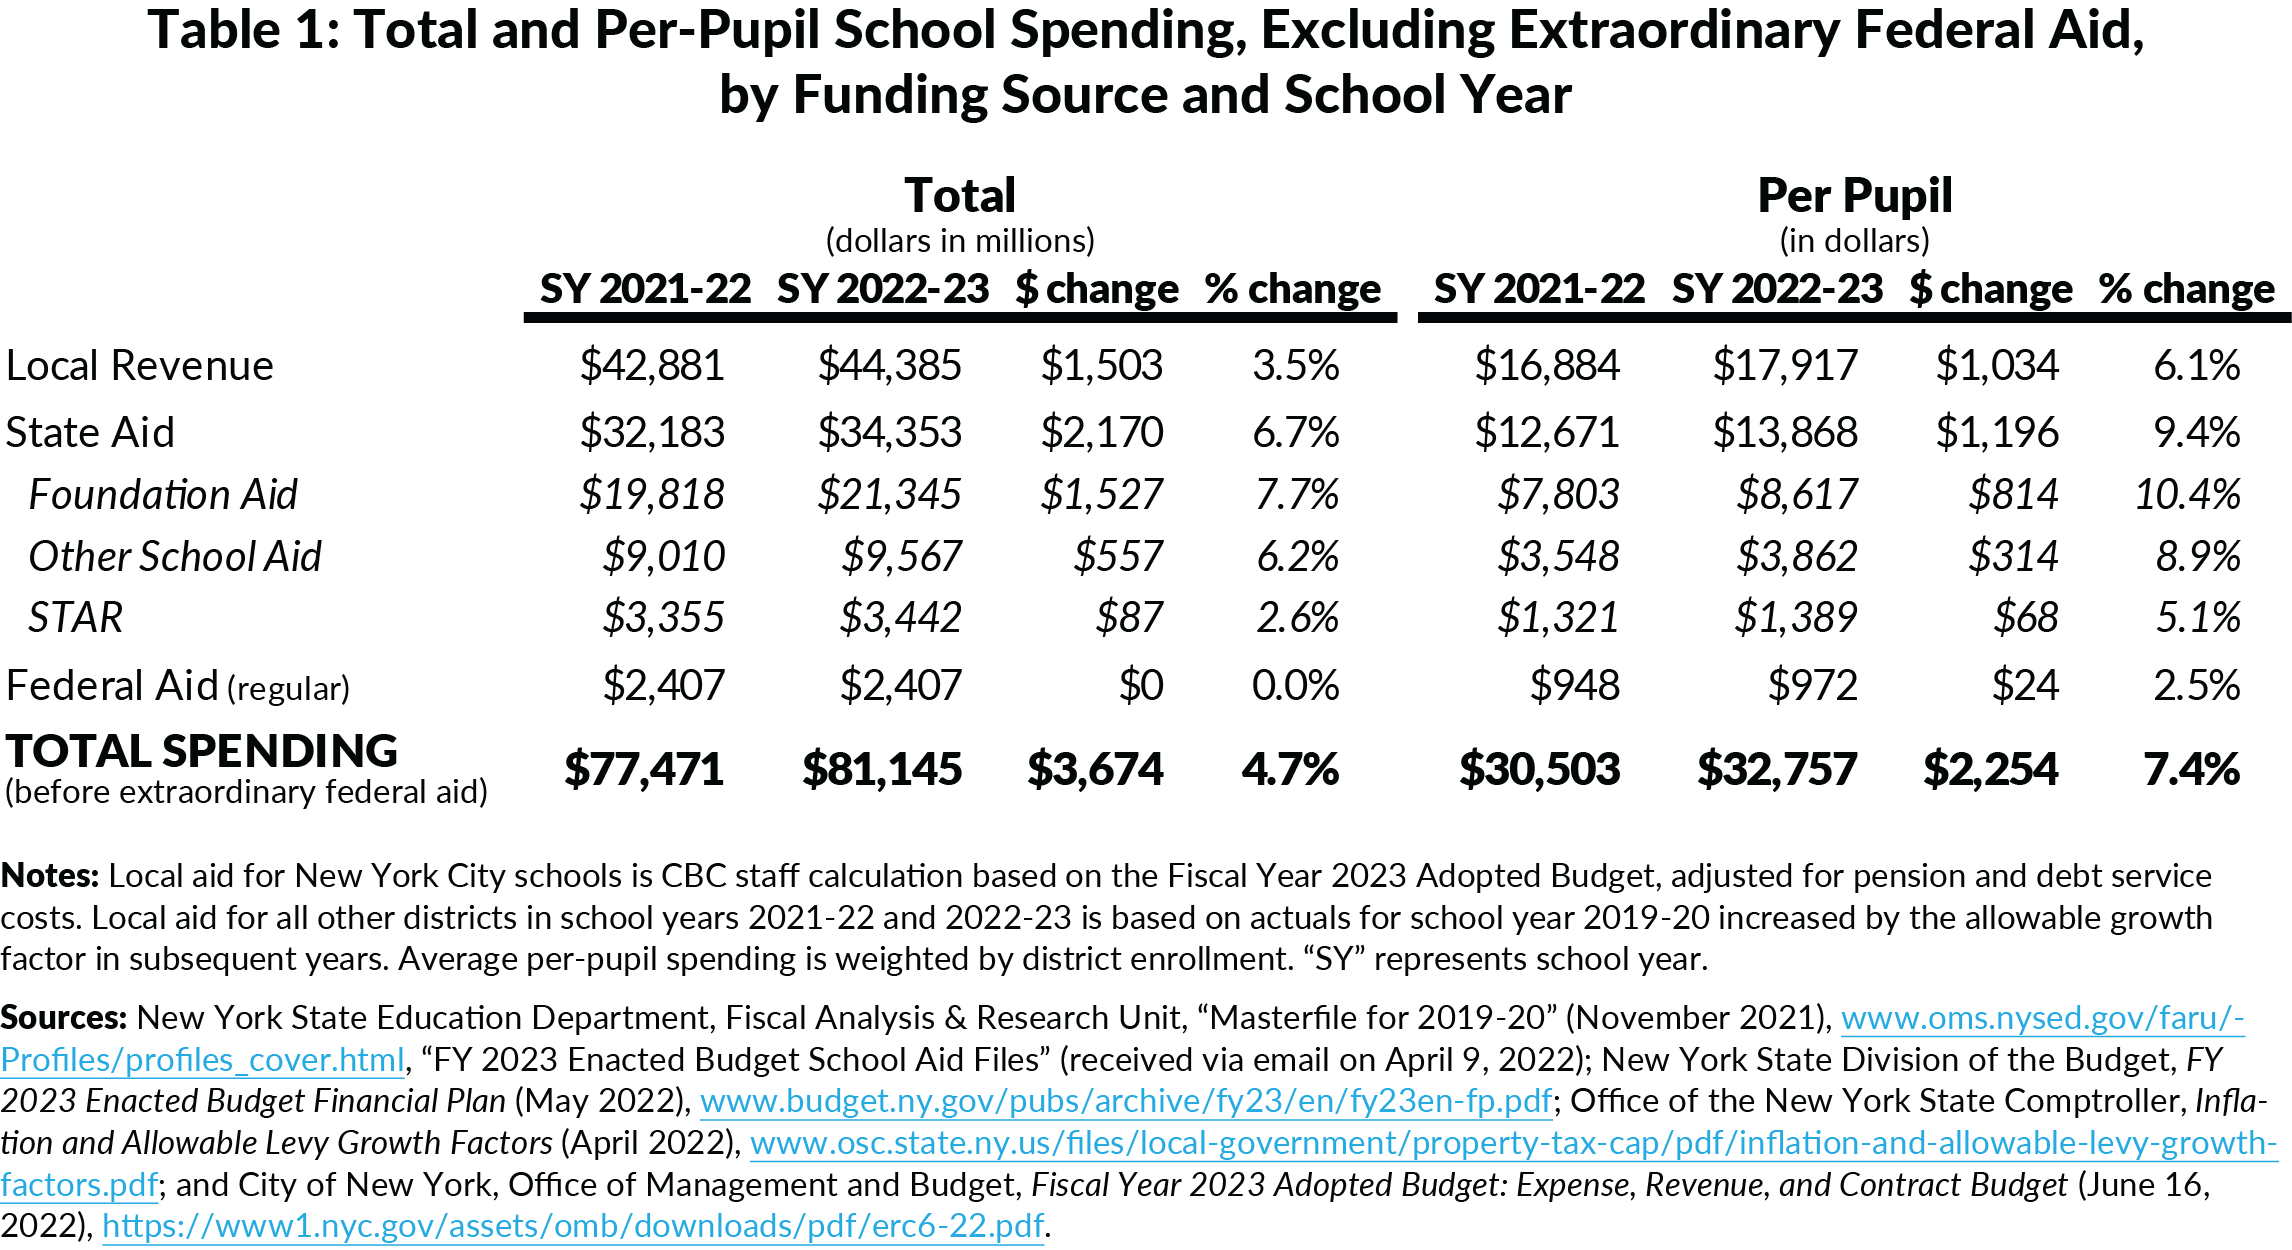
New York continues to dramatically increase State school aid. State aid to schools increases $2.2 billion (6.7 percent) to $34.4 billion in school year 2022-23, with two-thirds of the growth due to the multi-year increase in Foundation Aid included in the Fiscal Year 2022 Enacted State Budget. (See Table 1.) Combined with regular federal aid and local revenue, school districts in New York are spending $81.1 billion this year, an increase of 4.7 percent from school year 2021-22.
However, due to a decline in Statewide enrollment, State aid per pupil is growing more quickly than the total. State aid per pupil is increasing 9.4 percent to $13,868, with Foundation Aid increasing 10.4 percent. Combined with local resources and regular federal aid, spending in school year 2022-23 averages $32,757 per pupil, a 7.4 percent ($2,254) increase from school year 2021-22.
Extraordinary COVID-Related Federal Education Aid Boosts Spending an Estimated $3.8 Billion this Year, About $1,500 per Pupil
The State last year allocated $11.4 billion in additional federal Elementary and Secondary School Emergency Relief (ESSER) funding from two COVID relief packages: the Coronavirus Response and Relief Supplemental Appropriations Act (CRRSA) and the American Rescue Plan Act (ARP).3 School districts must obligate the funds from the two relief packages by September 30, 2023 or September 20, 2024, respectively.4 These funds were allocated based on each school district’s share of federal Title I funds, per federal requirements.5
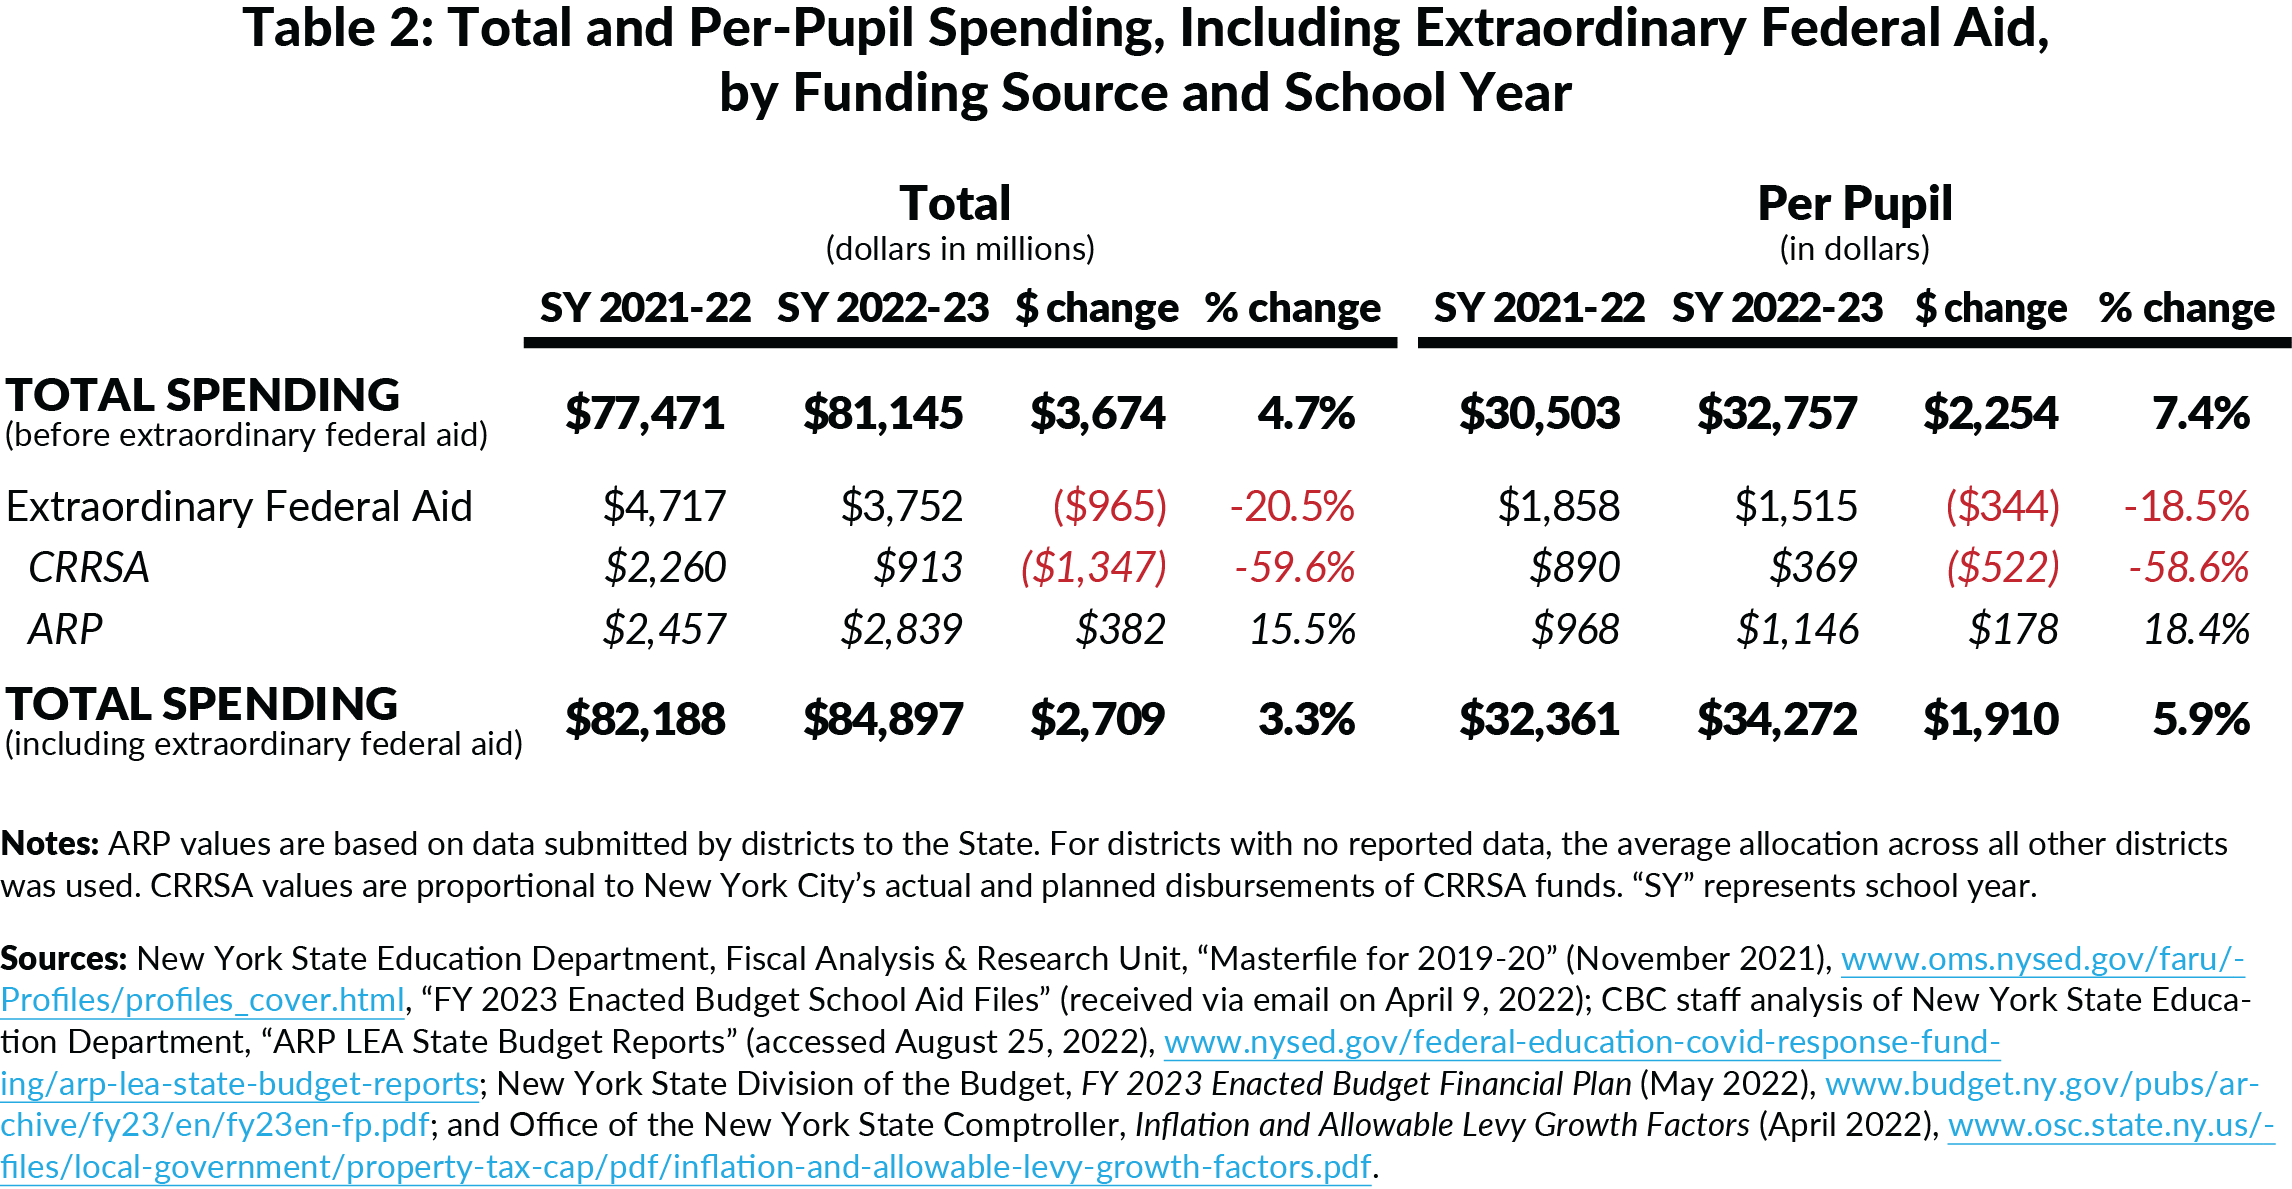
Although the State does not report how districts are allocating CRRSA funds across years, school districts are required to submit a plan to the State Education Department (SED) that shows the allocation of ARP funds. As of August 25, 2022, 655 of the 673 districts had submitted plans. New York City has also reported its actual and planned spending of CRRSA funds.6 Using that data, CBC estimates that districts will spend an estimated $3.8 billion this school year, down from $4.7 billion last year. (See Figure 1.) On a per-pupil basis, federal COVID-related aid is increasing to an average of $1,515 this school year, down 23 percent from $1,858 last year

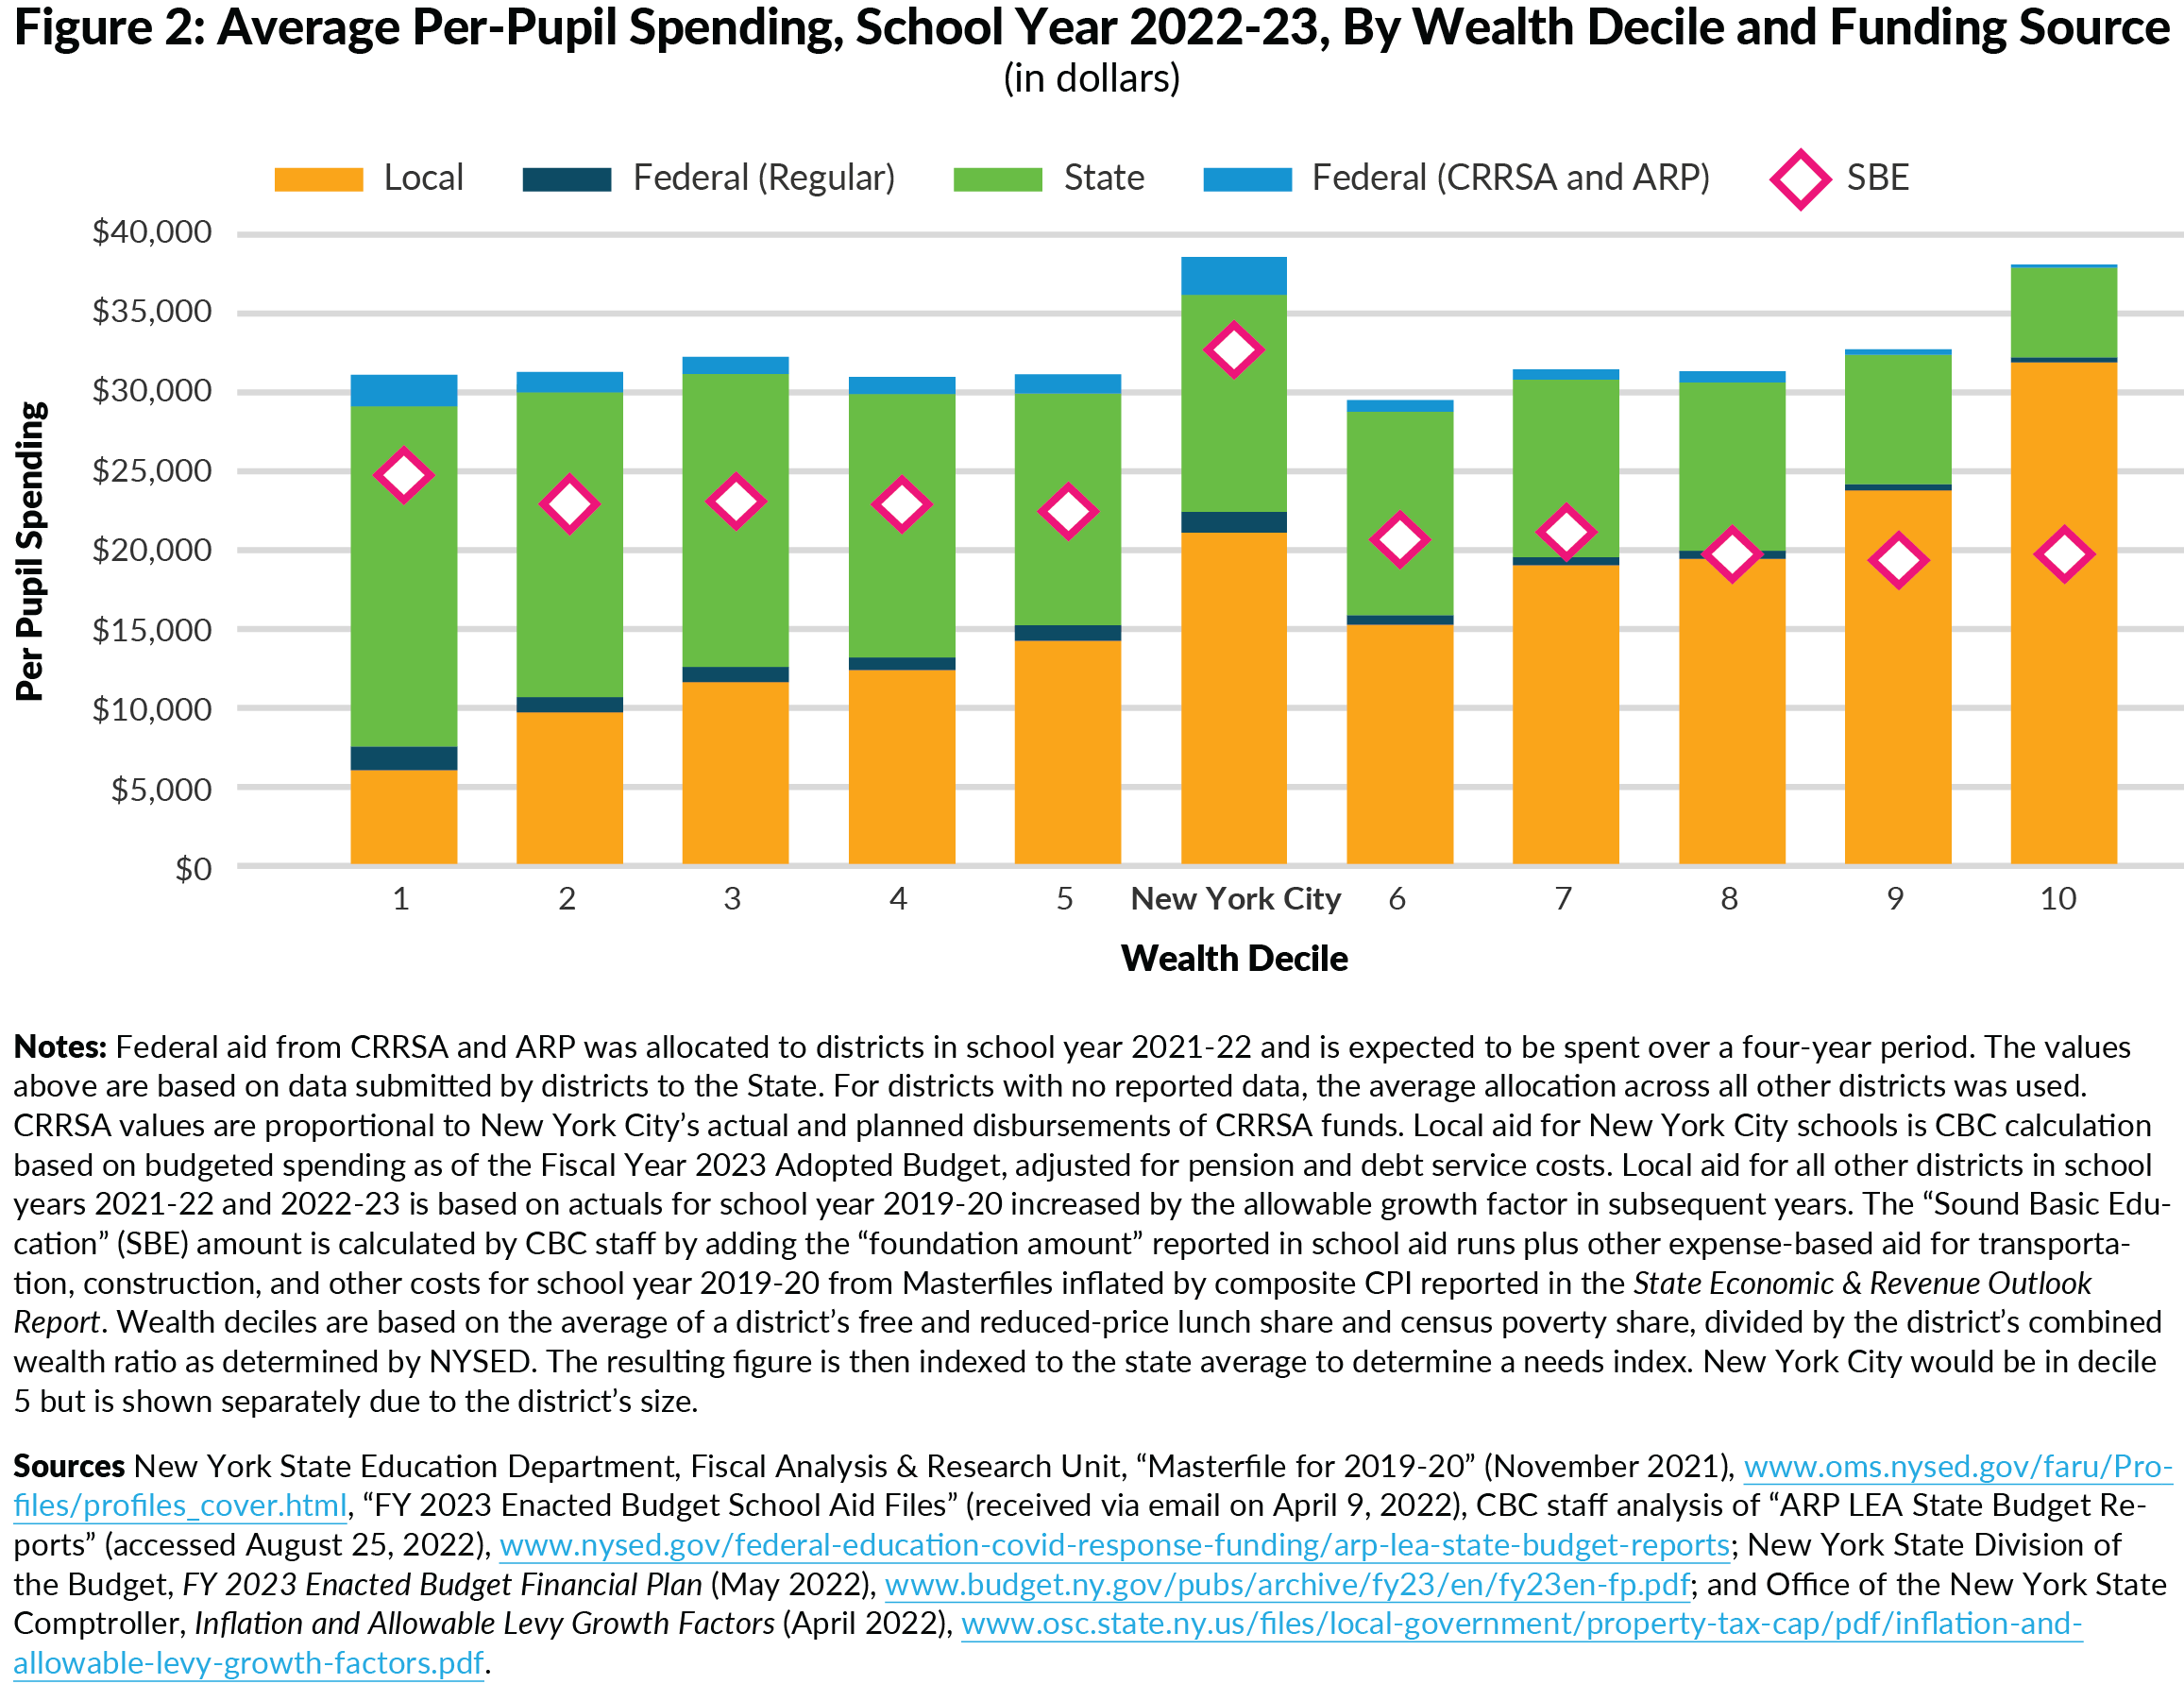
Because the allocation was based on Title I funds, lower-wealth districts generally received more ESSER funds per pupil than higher-wealth districts. New York City, which is in the fifth wealth decile, is spending the most per pupil, at $2,382, about $400 more than the lowest-wealth decile, which is spending $1,979 per pupil. Conversely, districts in the wealthiest decile are spending an average of $191 per pupil in ESSER funds this school year. (See Figure 2.)
Total School Spending, Including Federal Aid, Reaches $85 Billion This Year
Including federal ESSER funds, total school spending this year is $84.9 billion, an average of $34,272 per pupil. (See Table 2.) However, federal ESSER funds are temporary. Statewide, $2.5 billion is planned to be spent during school year 2023-24, a decrease of 34 percent ($1.3 billion) from this year. School districts—especially New York City, which received the lion’s share of ESSER funds—should be using these non-recurring resources to address pandemic impacts and learning loss, rather than supporting recurring programs.
In 2020, New York Already Spent Nearly Twice the National Average Per Pupil
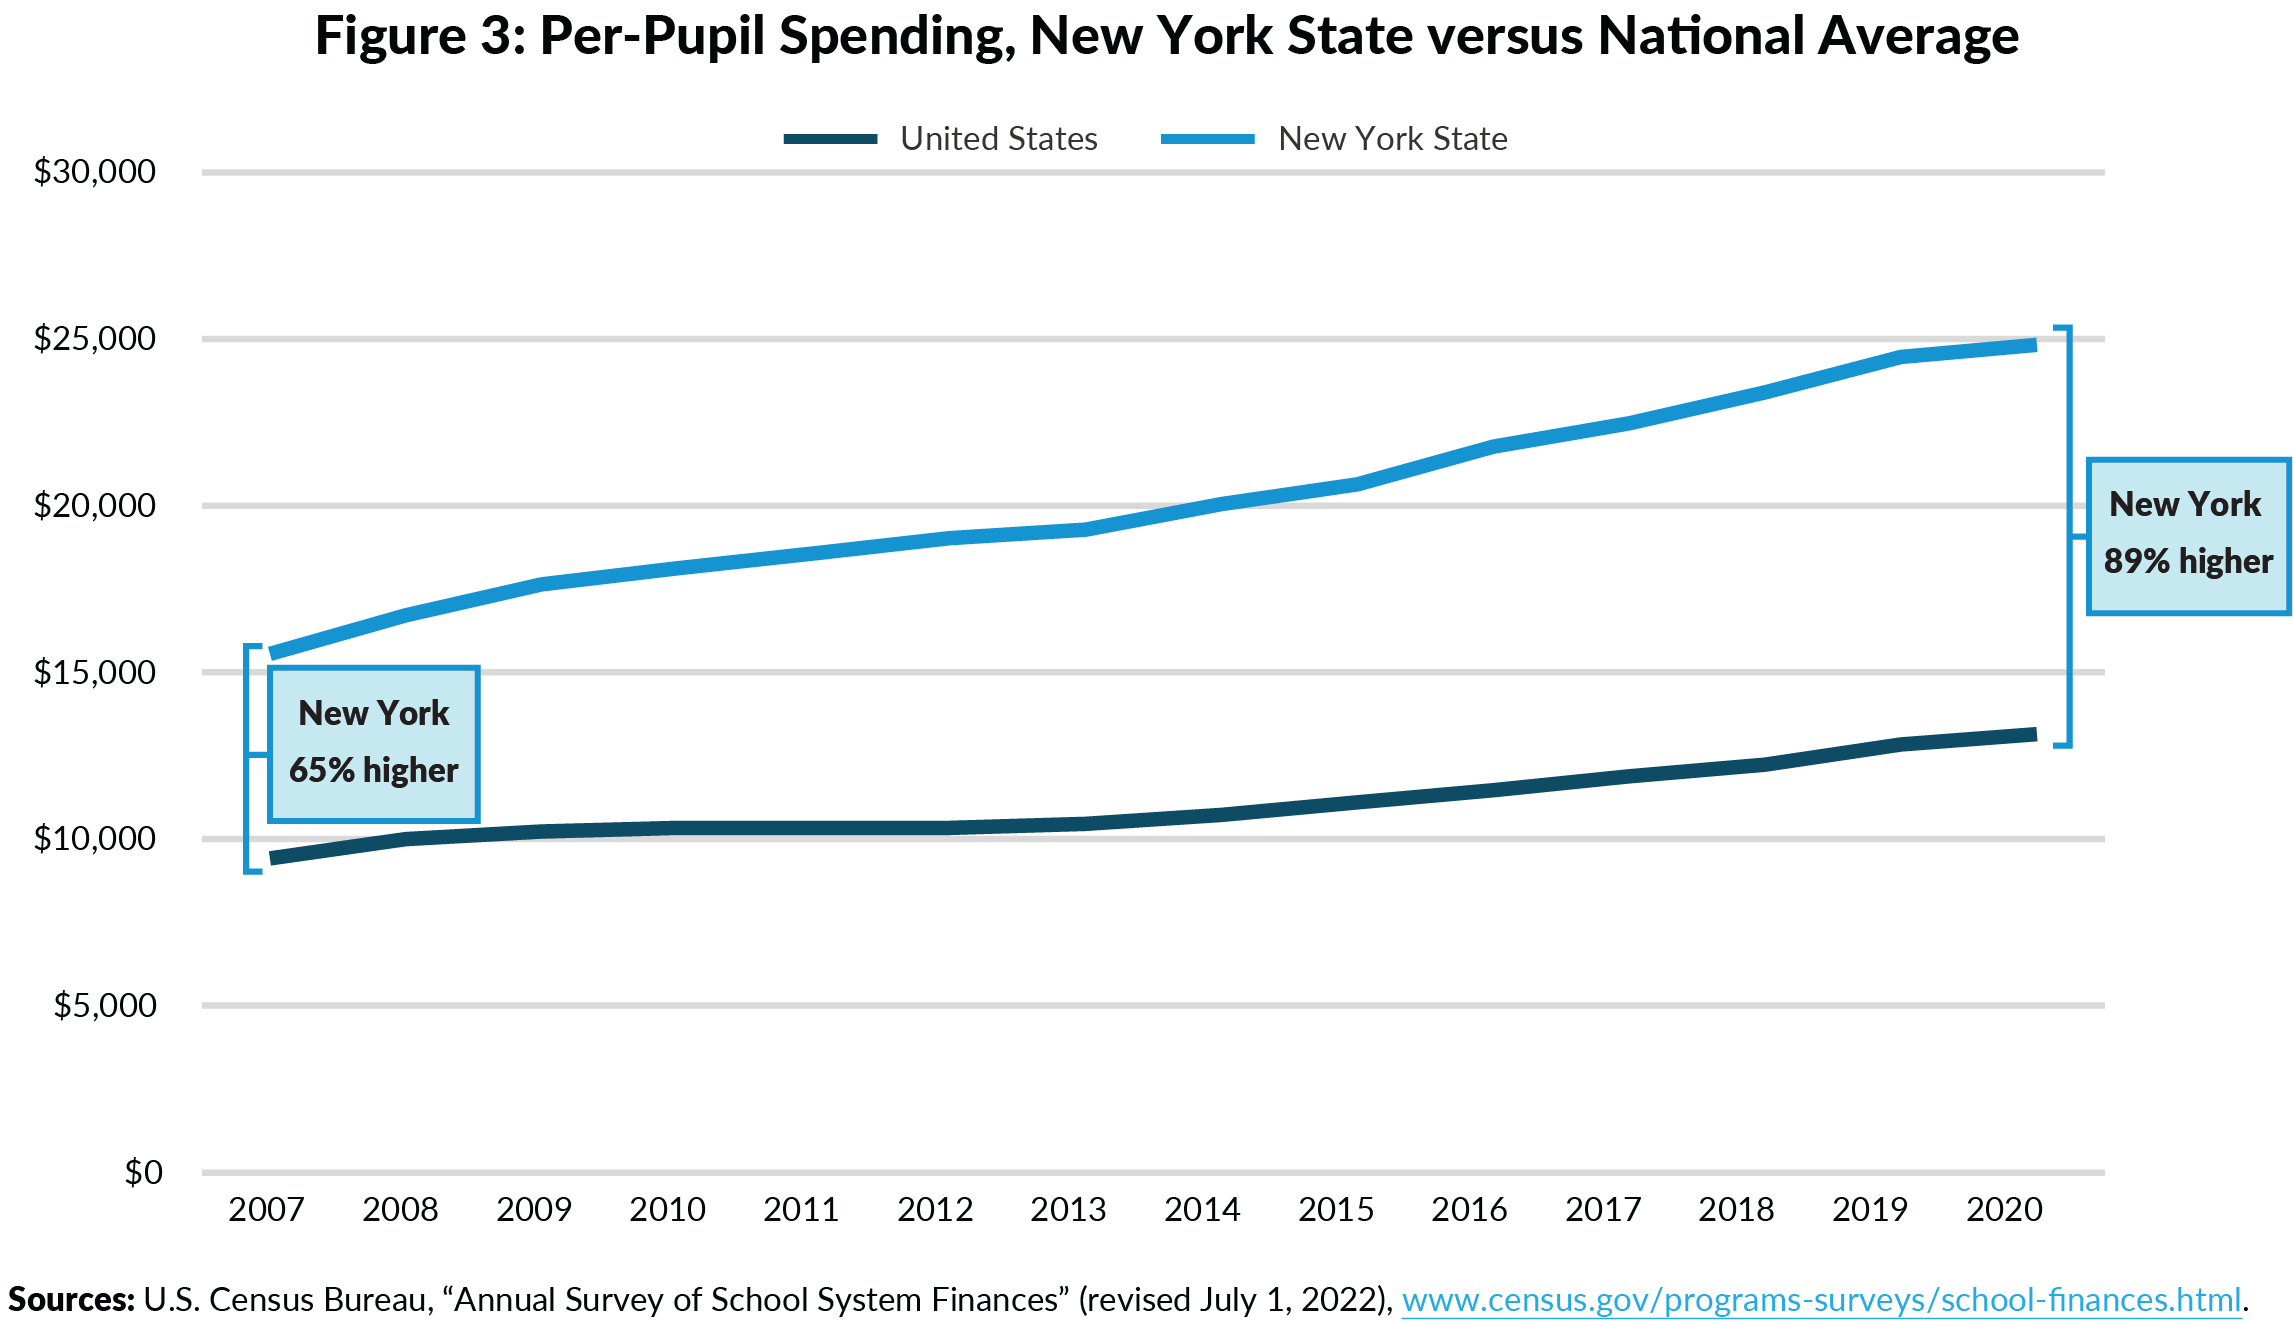
New York’s recent growth builds on its record per-pupil spending—which at $25,519 per pupil was already 89 percent higher than the national average of $13,494 in school year 2019-20. This differential has grown over time, having been 65 percent in the 2006-07 school year. (See Figure 3.)
While more recent national data are not yet available, spending growth in New York State has accelerated in the last three years. From school year 2019-20 to school year 2022-23, per-student spending increased at a rate of 5.3 percent annually in New York (excluding federal ESSER funds), compared to 3.7 percent per year between school years 2006-07 and 2019-20. This acceleration may mean New York has pulled even further from the national average since 2020.
New York State Provides $3.1 Billion to Districts that Fund a Sound Basic Education with Local and Regular Federal Resources, Continuing and Increasing the Trend
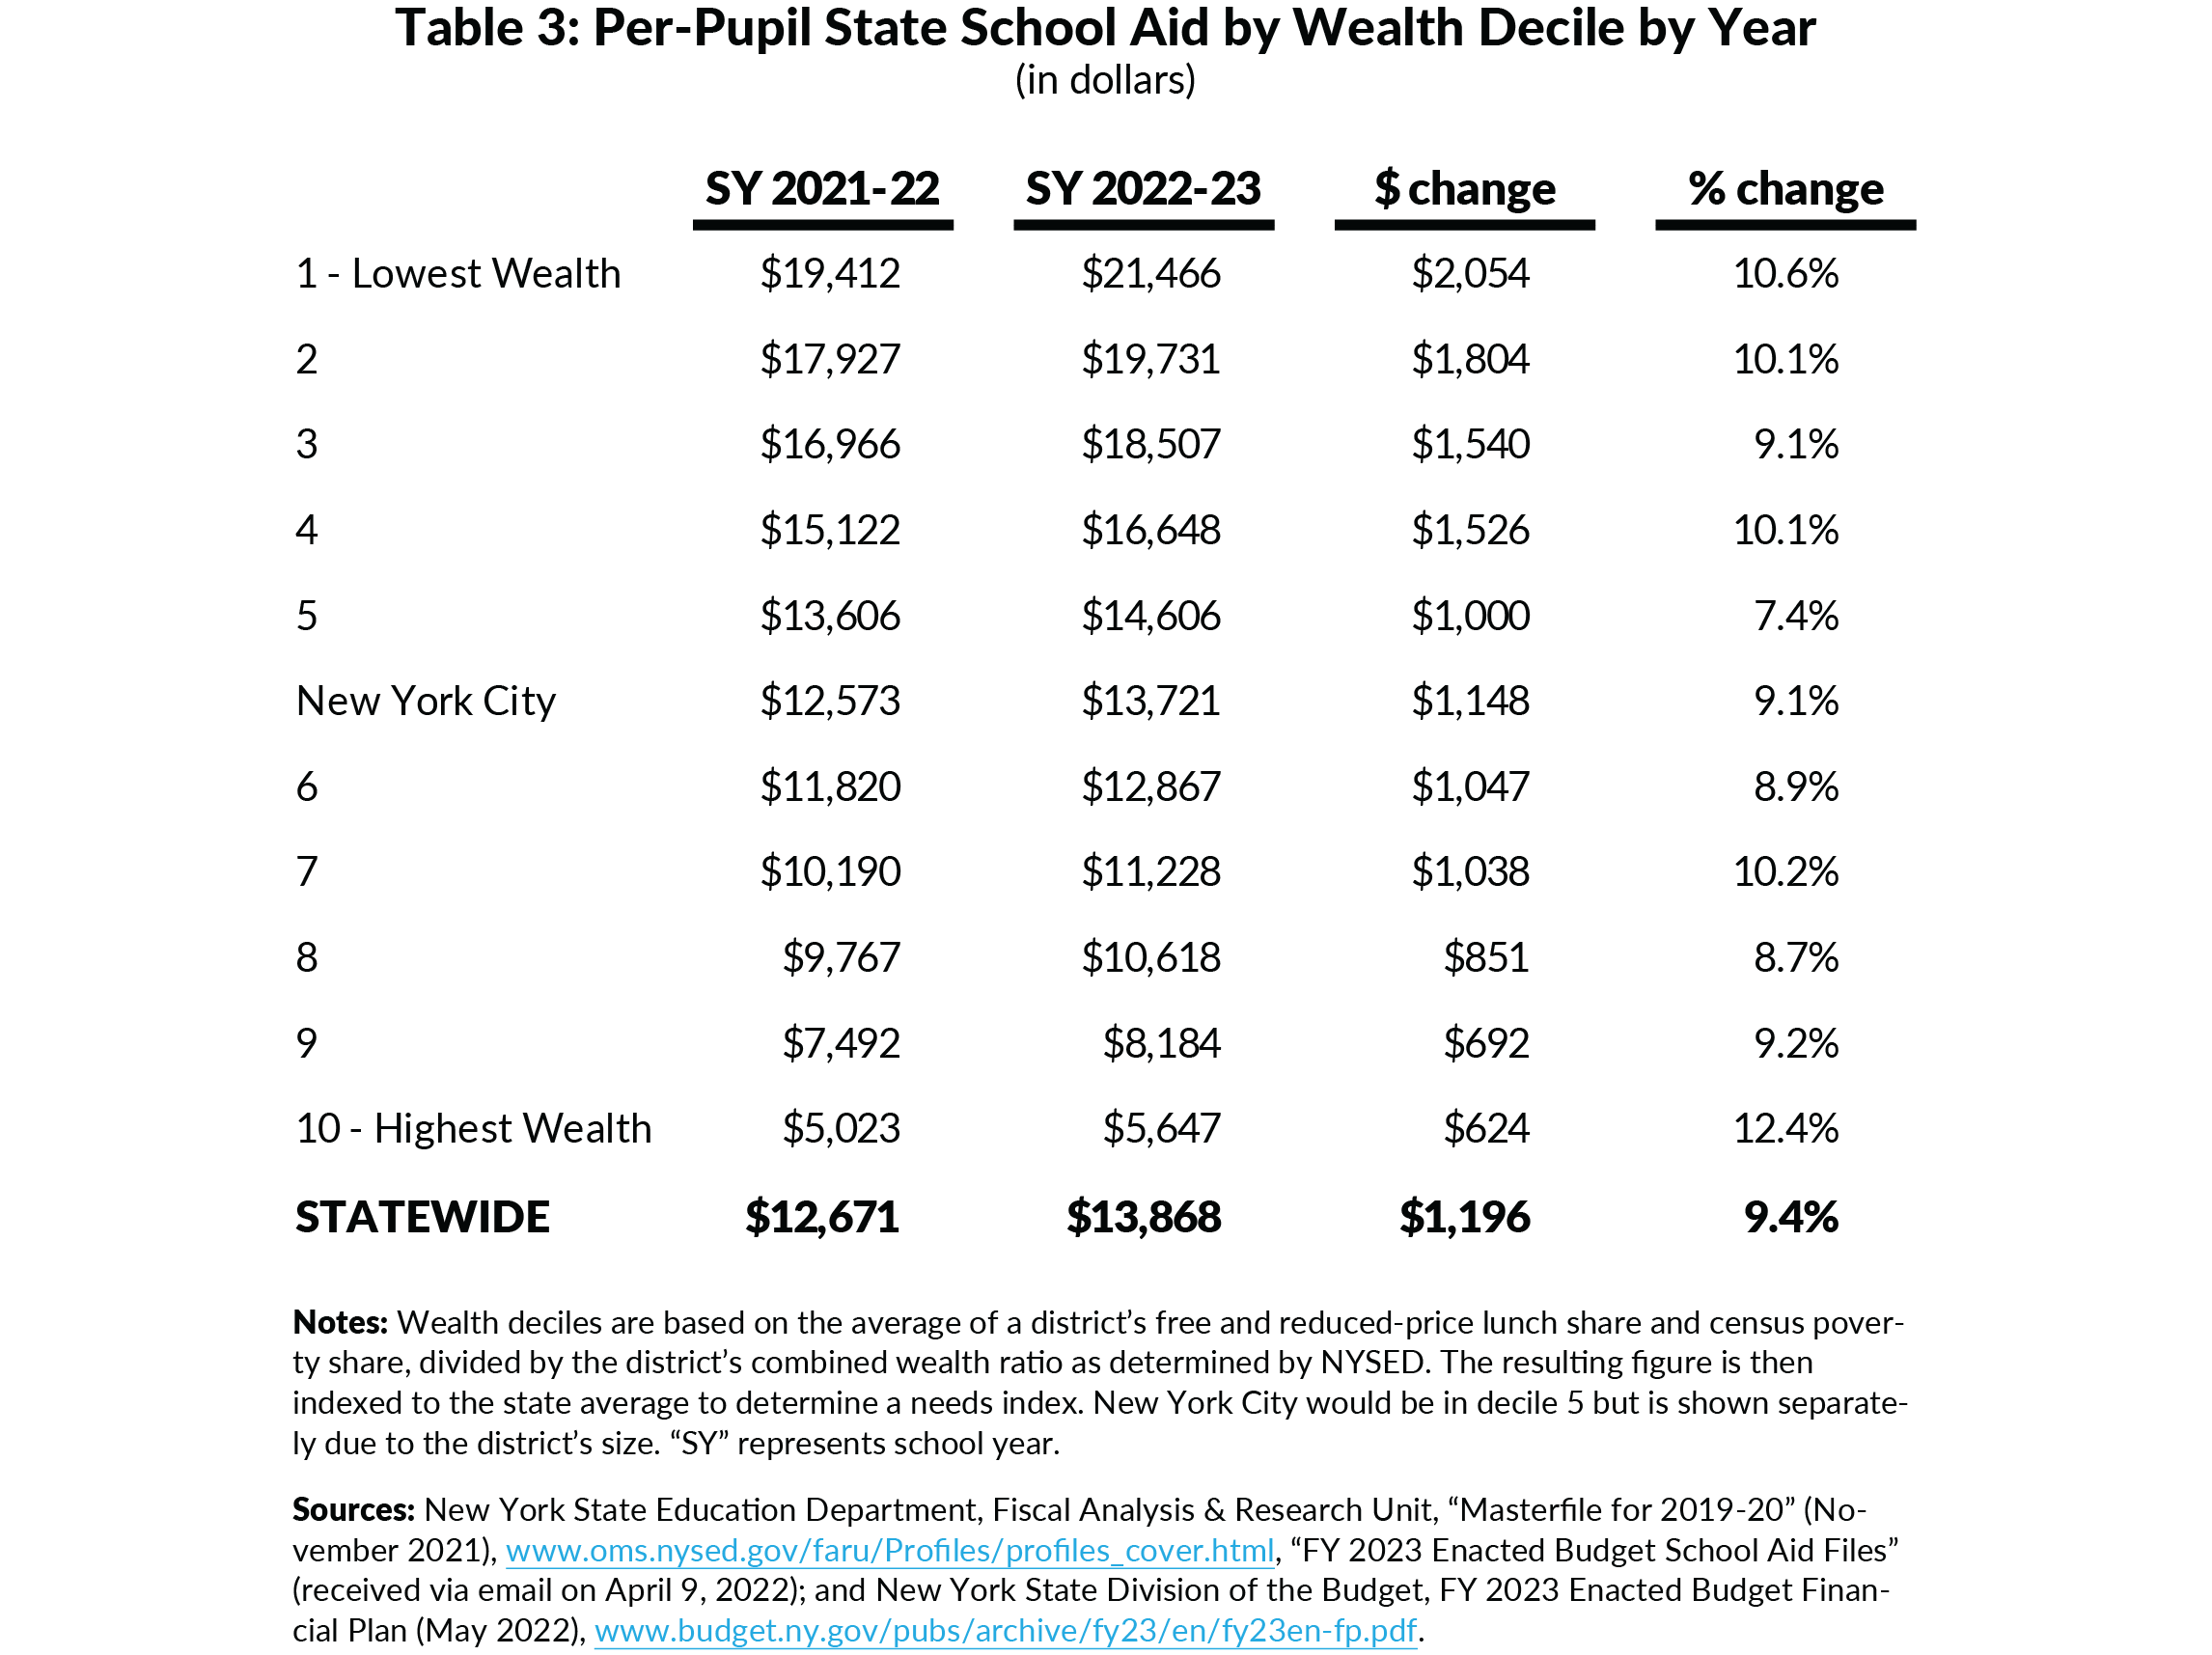
While public education is delivered primarily by local school districts, the State has ultimate responsibility for educating all of its residents and therefore provides financial aid to offset disparities in local wealth and student need. New York’s allocation of State aid is progressive, with lower-wealth districts receiving higher per-pupil funding. (See Table 3.)
Nonetheless, New York continues to direct billions of dollars in aid each year to districts that already raise enough local and regular federal funds to fund an SBE for two reasons:
- The Foundation Aid formula, while progressive, still directs significant aid to wealthy districts due to three factors;
- Theoretical local share calculations that may overstate need in high-wealth districts, rather than accounting for actual local revenues, which may be higher;
- Hold harmless provisions that prohibit decreases in Foundation Aid, even if enrollment is declining or district wealth is increasing; and
- Outdated measures of pupil need, such as poverty level, that are drawn from the 2000 Census.7
- Some expense-based aids, such as funding for textbooks and software, are not allocated based on need, but on other bases such as flat per-pupil amounts or district spending.8
As a result, this year, 176 districts (concentrated mainly in the top three wealth deciles) that generate sufficient revenue from local and regular federal sources to support an SBE will still receive $3.1 billion in State school aid.9 Last year, the State sent $2.7 billion to 168 such districts.10 Of the $2.2 billion year-to-year increase in State school aid, $400 million is going to districts that already fund an SBE through local and regular federal sources. Unless the State changes its methodology for allocating aid, the multi-year increases in State aid will continue to provide further increases to these districts in the future.
Of these 176 districts, 156 are in the top three wealth deciles and are receiving $2.7 billion of State aid this year. Furthermore, the remaining 41 districts in these three wealth deciles are receiving $1.2 billion more than is needed for them to provide an SBE. In total, $3.9 billion in State aid flowing to schools in the top three wealth deciles is in excess of the amount needed for an SBE. Conversely, just 4 districts remain underfunded by a combined $14.7 million, which could have easily been funded from the excess State aid sent to wealthy districts.
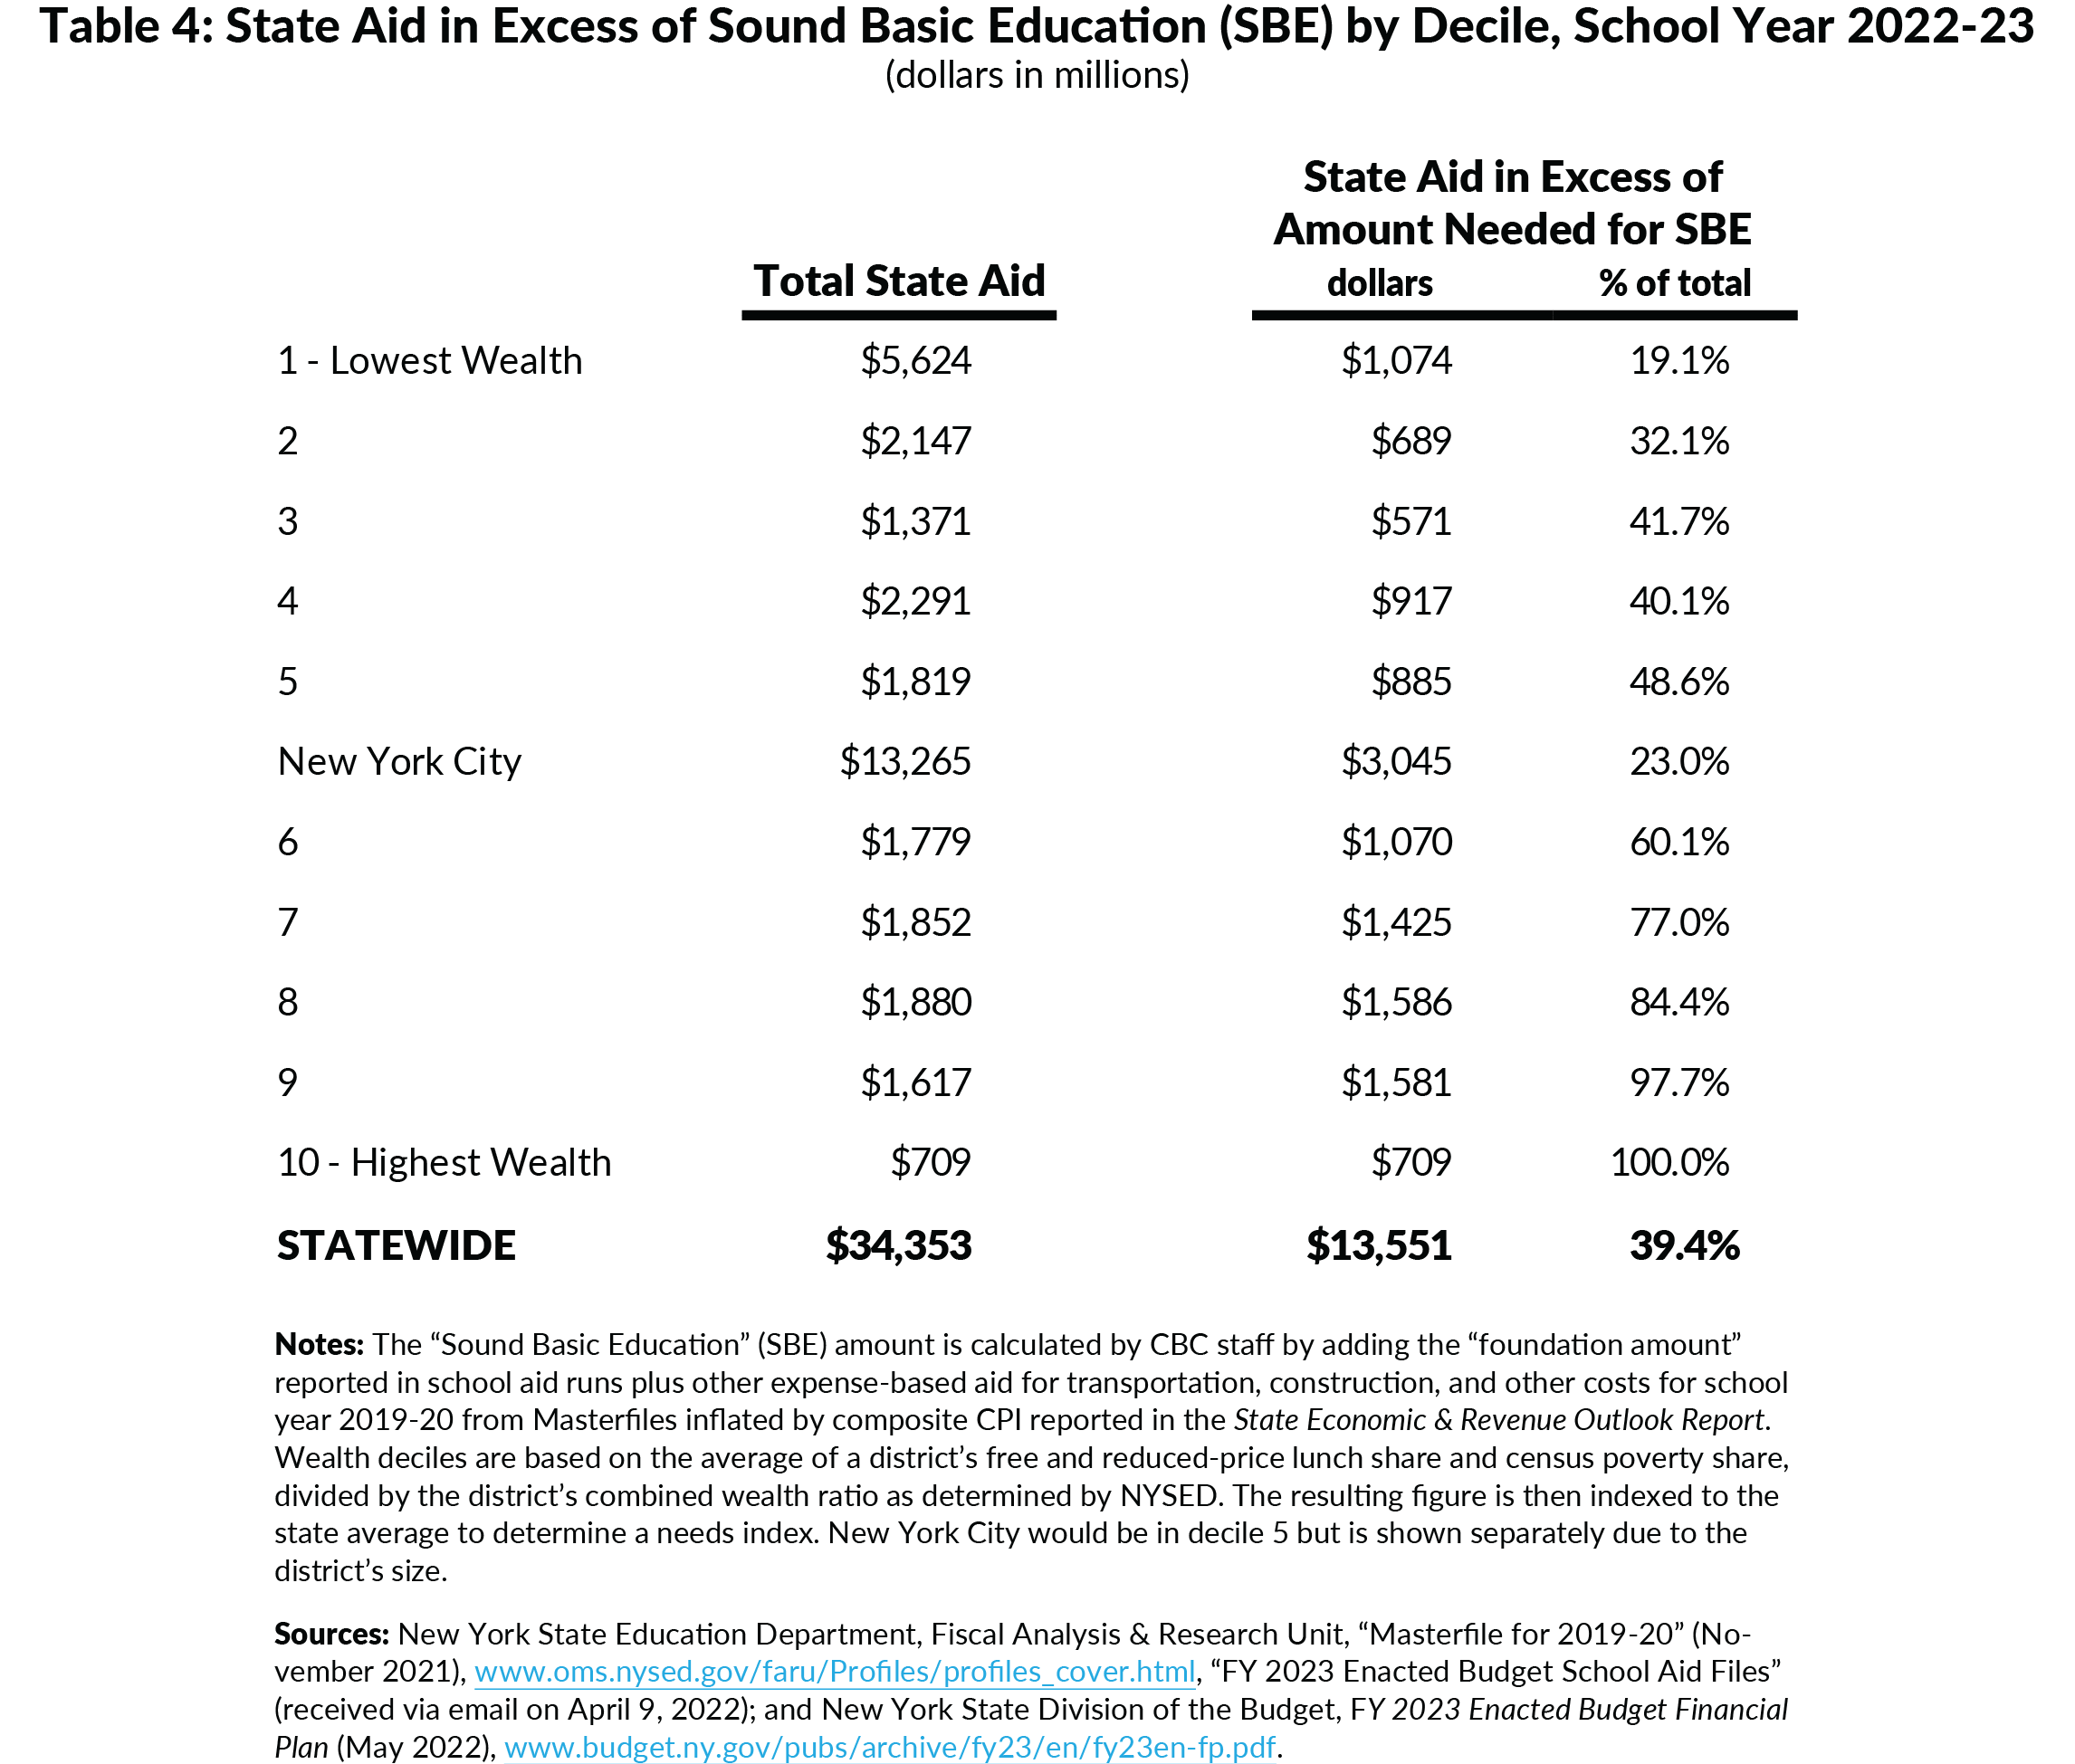
Across all districts, New York State is sending $13.6 billion in State aid above the level needed to fund an SBE (39 percent of all State aid). (See Table 4.) In fact, New York State could spend $13.5 billion less on State aid while still funding an SBE in every district if the allocation of State aid were corrected to direct aid based on need alone.11
The State now projects multi-billion-dollar budget gaps beginning in fiscal year 2025. To close these gaps, the State should reduce its recurring spending base. State school aid spending is the second largest area of spending in the budget, only behind Medicaid, and should be one source of savings.12 Reforming the Foundation Aid formula, including rolling in expense-based aids, could reduce State school aid spending while better targeting resources to districts and students with financial need.13
Despite Growth in State Aid, Increase in Local Funding Has Maintained Per-Pupil Funding Gap between Lowest and Highest Wealth Deciles
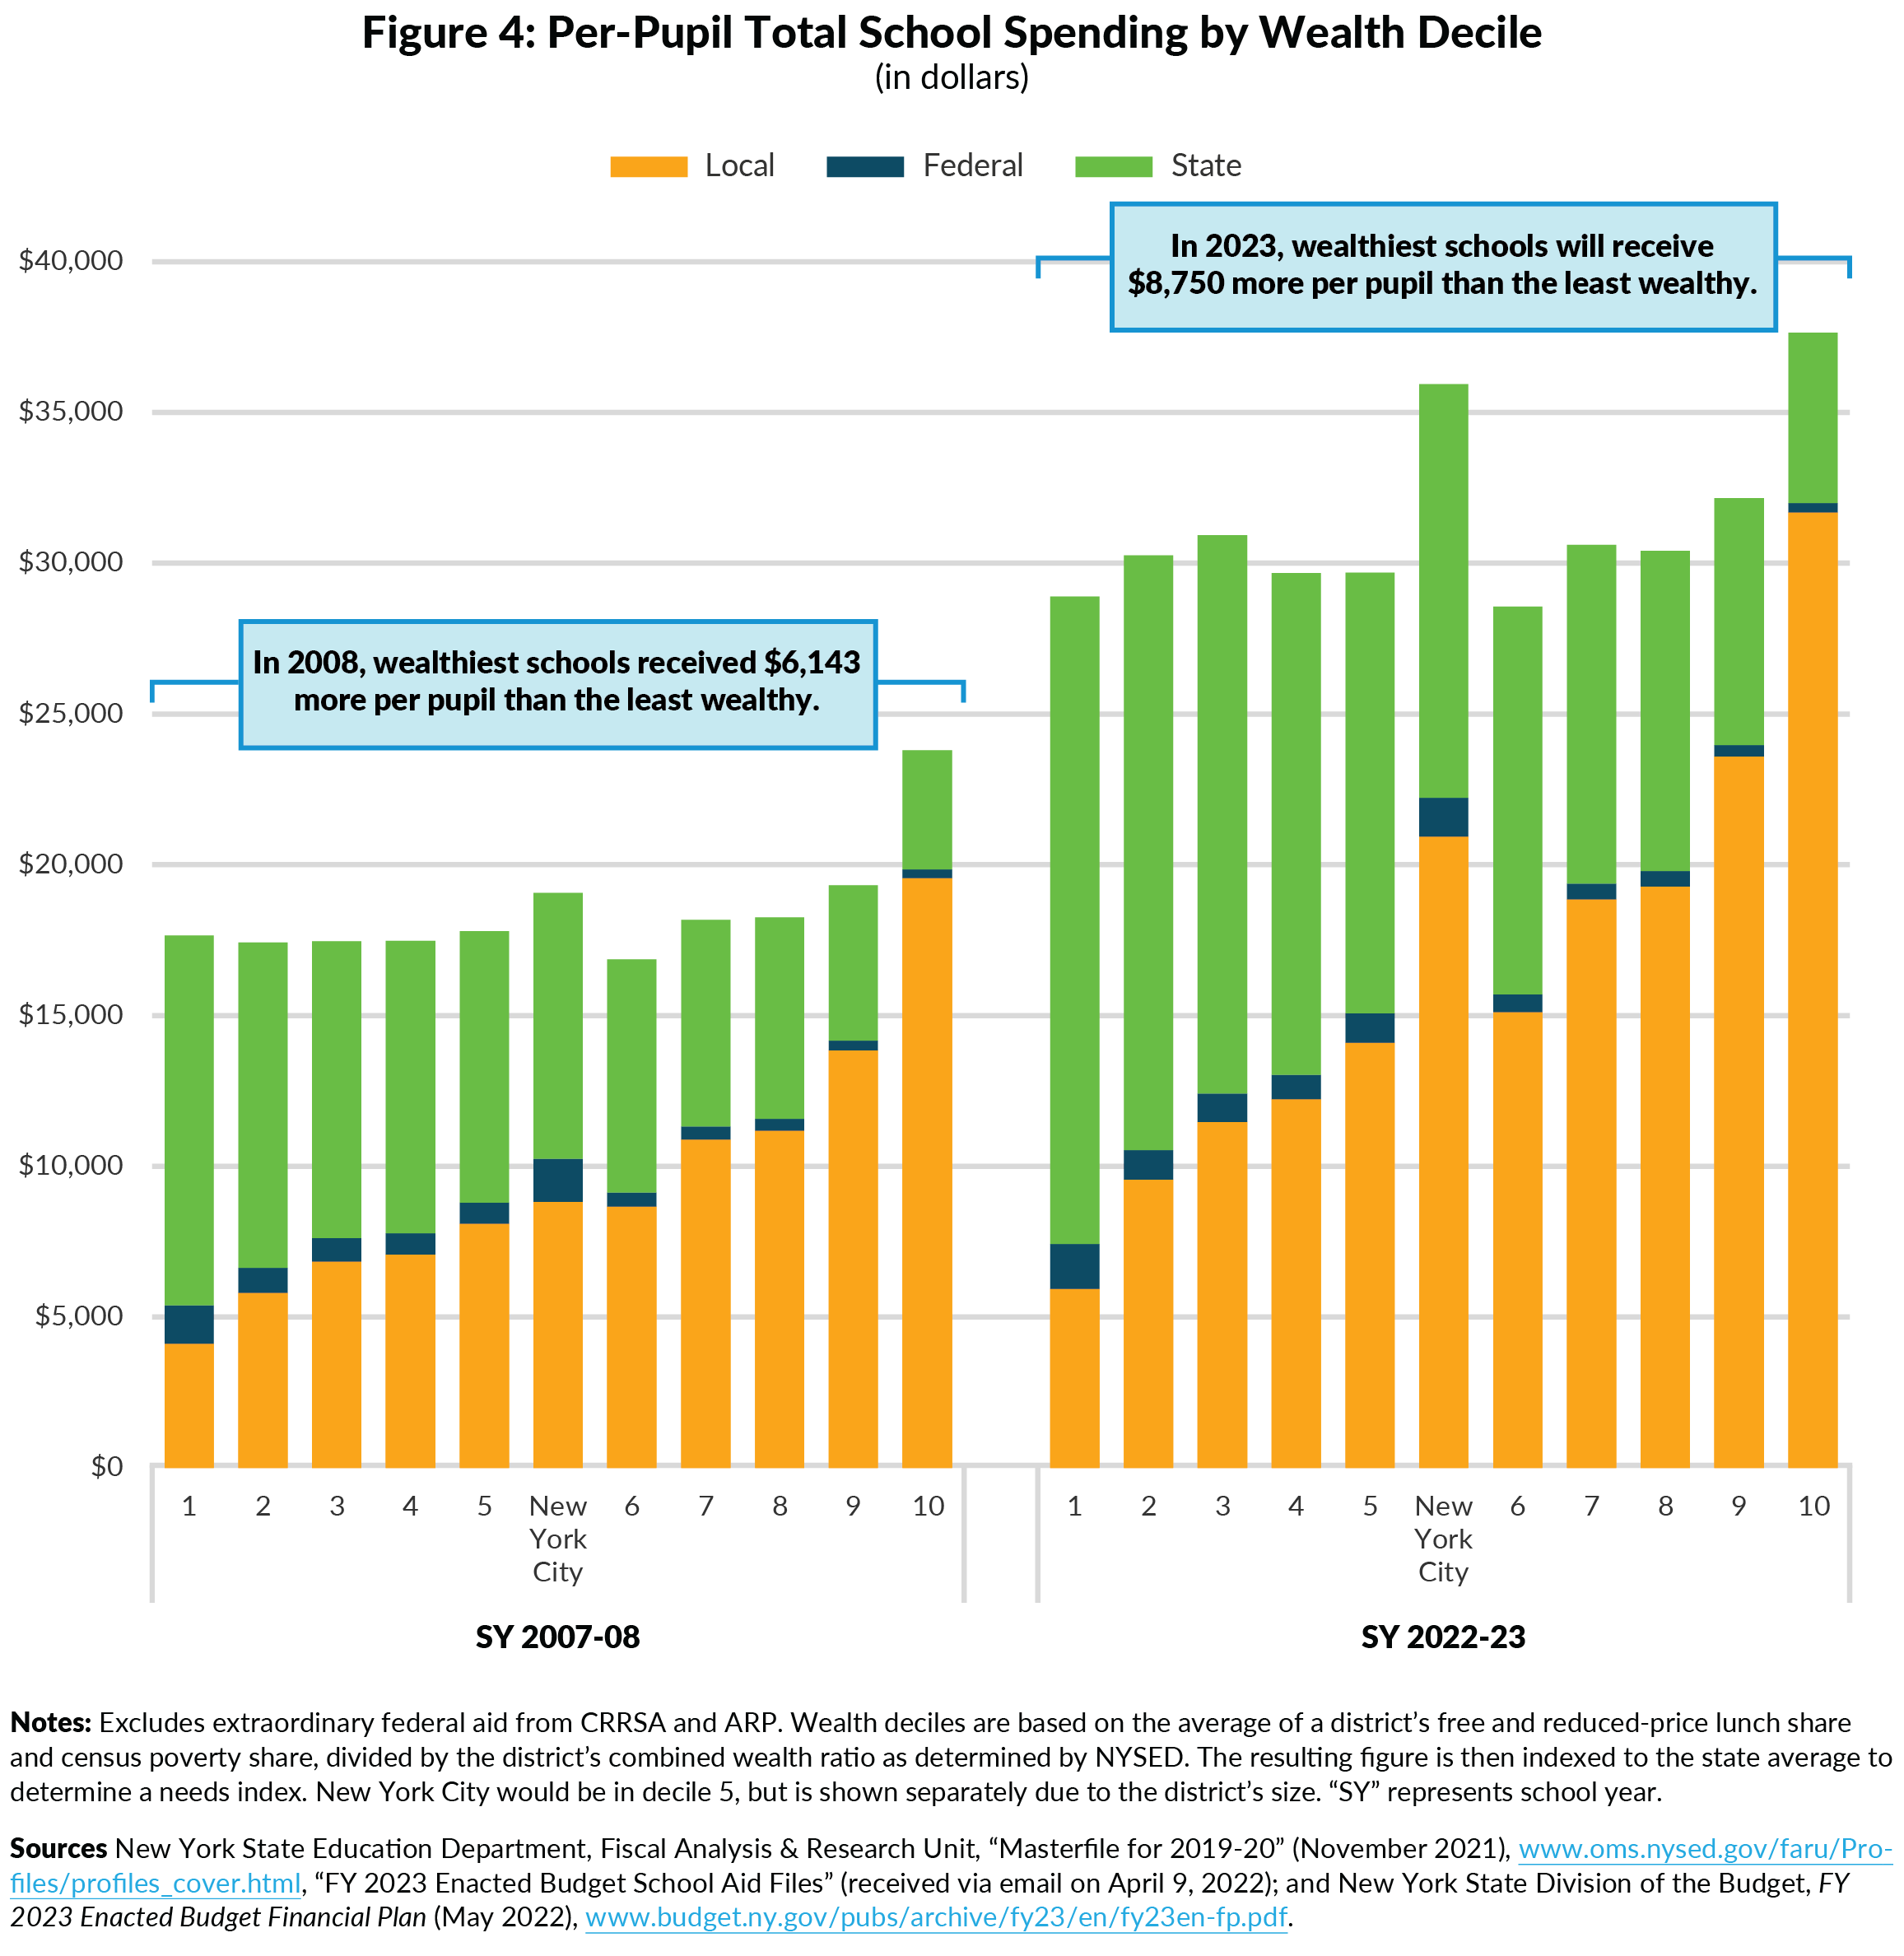
Despite significant increases in per-pupil State aid to lower-wealth districts since the 2007-08 school year, the gap between the lowest- and highest-wealth deciles has barely narrowed. (See Figure 4.) Districts in the wealthiest decile spent 35 percent more per pupil in school year 2007-08 and 30 percent more in school year 2022-23. The wealthiest districts now spend $8,750 more per pupil, up from $6,143 more in school year 2007-08.
Total per-pupil funding increased comparably between districts in the lowest- and highest-wealth deciles, 64 percent and 58 percent, respectively. State aid per pupil increased 75 percent among districts in the lowest wealth decile, and only 43 percent in the highest wealth decile. However, districts in the wealthiest decile increased their local support per pupil by $12,124 (62 percent), while districts in the poorest decile increased local support by $1,810 (44 percent) per pupil.
New York Lacks a System to Monitor Educational Performance and Promote Accountability
Students, parents, teachers, staff, administrators, and taxpayers all deserve to know whether education spending is well-targeted and delivering high-quality education that leads to high achievement.14 New York’s high per-pupil spending should deliver high achievement, but pre-pandemic data from the National Assessment of Education Performance (NAEP) showed that the share of New York’s fourth and eighth graders proficient in math and reading was close to the national average.15 Furthermore, recent national NAEP data show that pandemic-related learning loss was significant and greater among lower-performing students.16
New York should implement a comprehensive performance management system for school districts that uses robust metrics to track activities and results; identifies and spreads best practices; and holds districts accountable. Especially following the pandemic and with the massive influx of State and federal COVID aid, the State should track how districts are improving student achievement, reversing learning loss, and narrowing disparities within and between districts. A well-designed system would not only measure inputs and processes, such as the amount spent, but also measure outcomes, quality, and efficiency. It also would have a process to review these measures, work with districts on corrective action plans and improvements where needed, and hold districts accountable for meeting standardized goals
Conclusion
With the ‘phase-in’ of Foundation Aid funding set to be completed after school year 2023-24 and multi-billion-dollar budget gaps on the horizon, it is past time for the State’s leaders to chart a path forward for sustainable and effective State education spending. This will require better targeting aid to districts with the greatest need, tracking their performance, and holding districts accountable for delivering high-quality education. New York should not only lead the nation in spending, but also lead in achievement. There is more work to be done to understand how the rapidly rising aid has been spent over the years, how that spending has affected student achievement, and how it could be spent better to deliver results for students. As schools across the state complete their first month back in the classroom, the State’s leaders should focus on how their spending decisions are affecting schools and whether they are driving the educational results New York’s students deserve and need.
Footnotes
- Total state aid includes Foundation Aid, expense-based aids, and the STAR program.
- The “sound basic education” amount is calculated by CBC staff by adding the “foundation amount” reported in school aid runs plus other expense-based aid for transportation, construction, and other costs for school year 2019-20 from Masterfiles inflated by composite CPI reported in the State Economic & Revenue Outlook Report.
- The CRRSA are referred to as ESSER II, while the APR are referred to as ARP ESSER. ESSER was established under the CARES Act of 2020, which provided $1.0 billion in ESSER I funds to NYS School Districts, used primarily for school year 2020-21. See U.S. Department of Education, Office of Elementary and Secondary Education, “Elementary and Secondary School Emergency Relief Fund,” (accessed September 4, 2022), https://oese.ed.gov/offices/education-stabilization-fund/elementary-secondary-school-emergency-relief-fund/.
- For CRRSA, funds were appropriated in the 2021-22 enacted state budget and must be spent between March 13, 2020-September 30, 2023. For ARP, the funds must be spent between March 2021- September 30, 2024.
- These figures represent only the amounts of funding allocated to districts via the Title I funding formulas and included in school year 2021-22 school aid runs. Additional funding for learning loss, charter schools, administration, and other purposes is not included in this analysis.
- In order to approximate allocation of CRRSA funds, total district funds were allocated across school years based on the reported allocation of CRRSA funds in New York City. For districts with no reported data, the average allocation across all other districts was used. See New York State Education Department, “ARP LEA State Budget Reports” (accessed August 27, 2022), www.nysed.gov/federal-education-covid-response-funding/arp-lea-state-budget-reports.
- David Friedfel, A Better Foundation Aid Formula (Citizens Budget Commission, December 12, 2016), https://cbcny.org/research/better-foundation-aid-formula.
- Testimony of David Friedfel, Director of State Studies, Citizens Budget Commission, submitted to the New York State Senate Committees on Education, and Budget and Revenue, Testimony on the Distribution of the Foundation Aid Formula as it Relates to Pupil and District Needs (December 3, 2019), https://cbcny.org/advocacy/testimony-distribution-foundation-aid-formula-it-relates-pupil-and-district-needs.
- The “sound basic education” amount is calculated by CBC staff by adding the “foundation amount” reported in school aid runs plus other expense-based aid for transportation, construction, and other costs for school year 2019-20 from Masterfiles inflated by composite CPI reported in the State Economic & Revenue Outlook Report. A “self-funding” district is defined as any district for which base federal aid (excluding CRRSA and ARP ESSER funds) plus estimated local revenue is greater than SBE. There are also 15 self-funding districts in decile 7, 3 in decile 6, and 1 each in deciles 5 and 3.
- Patrick Orecki, Making the Grade (Citizens Budget Commission, September 2021), https://cbcny.org/research/making-grade.
- David Friedfel, Target School Aid to Avoid the Most Painful Cuts (Citizens Budget Commission, May 2020), https://cbcny.org/newsroom/target-school-aid-avoid-most-painful-cuts.
- See Citizens Budget Commission, New York State Budget Fiscal Year 2023 (August 15, 2022), https://cbcny.org/research/new-york-state-budget-fiscal-year-2023.
- New York State Division of the Budget, FY 2023 Enacted Budget Financial Plan (May 2022), p. 65, www.budget.ny.gov/pubs/archive/fy23/en/fy23en-fp.pdf, and First Quarterly Update to the FY 2023 Enacted Budget Financial Plan (May 2022), p. 11, www.budget.ny.gov/pubs/archive/fy23/en/fy23en-fp-q1.pdf.
- Testimony of Patrick Orecki, Director of State Studies, Citizens Budget Commission, submitted to the New York State Senate Committees on Education, New York City Education, and Budget and Revenue, Testimony on New School Aid Spending and Performance (October 5, 2021), https://cbcny.org/advocacy/testimony-new-school-aid-spending-and-performance.
- The Nation’s Report Card, “Explore Results for the 2019 NAEP Mathematics Assessment” (accessed 9/5/2022), www.nationsreportcard.gov/mathematics/?grade=4, and “Explore Results for the 2019 NAEP Reading Assessment” (accessed 9/5/2022), www.nationsreportcard.gov/reading/?grade=4.
- The Nation’s Report Card, “NAEP Long-Term Trend Assessment Results: Reading and Mathematics” (accessed 9/5/2022), www.nationsreportcard.gov/highlights/ltt/2022/.