PEGs In Perspective
NYC FY 2024 Executive Budget
The New York City Fiscal Year 2024 Executive Budget included a PEG (Program to Eliminate the Gap), Mayor Eric Adams’ fourth savings initiative (one vacancy reduction and three PEGs).The vast majority of these actions will have no impact on services, thus far providing savings primarily by saving money that would not have been spent anyway. While the multiple rounds of initiatives are a welcome notable departure from the recent past, these PEGs and vacancy reduction do not sufficiently reduce the City’s large budget gaps. More is needed; future actions should focus much more on prioritizing impactful programs and restructuring operations to preserve services, lest the City balance its budget by reducing critical services unnecessarily.
Importantly, 91 percent of these four plans’ total savings should not reduce services; rather, savings comes from eliminating underspending, leveraging non-City funding, reducing vacancies, lower than budgeted debt service, efficiencies, and new revenues.
The savings initiatives that may affect programs total just 0.5 percent of City-funded spending, excluding Medicaid, Public Assistance, and pension contributions.
Notably, this round relies more on revenue increases from fees, licenses, and fines. Revenue raising initiatives have increased as a share of the PEGs—8 percent of the Executive PEG, compared to 4 percent in January 2023, 6 percent in November 2022, and 2 percent in February 2022. Recurring revenue from the four rounds is nearly $180 million annually.
Furthermore, CBC’s analysis of the Executive Budget PEG finds that:
- The Executive Budget PEG totals $542 million in fiscal year 2023, increasing to $1.1 billion annually in fiscal year 2024 and beyond;
- Fully 87 percent of the Executive Budget PEG should not affect services since it comes from eliminating underspending, leveraging non-City funding, reducing vacancies, lower than budgeted debt service, efficiencies, and new revenues;
- Of the fiscal year 2024 to 2027 savings:
- 38 percent is from underspending and re-estimating what programs will actually cost;
- 18 percent from vacancy reductions;
- 8 percent is from new City revenues;
- 7 percent is from efficiency initiatives that reduce costs without reducing service levels;
- 7 percent comes from debt service savings;
- 6 percent is from shifts from City to federal or State funding; and
- 3 percent is Illusory, created since the budget adds and claims credit for reducing the same spending;
- Approximately 13 percent of the savings (roughly $140 million annually) may potentially affect program services;
- These equal just 0.2 percent of City-funded spending; and
- More than one-quarter of the total recurring value of the PEG—28 percent—comes from re-estimating the cost of DOE fringe benefits.
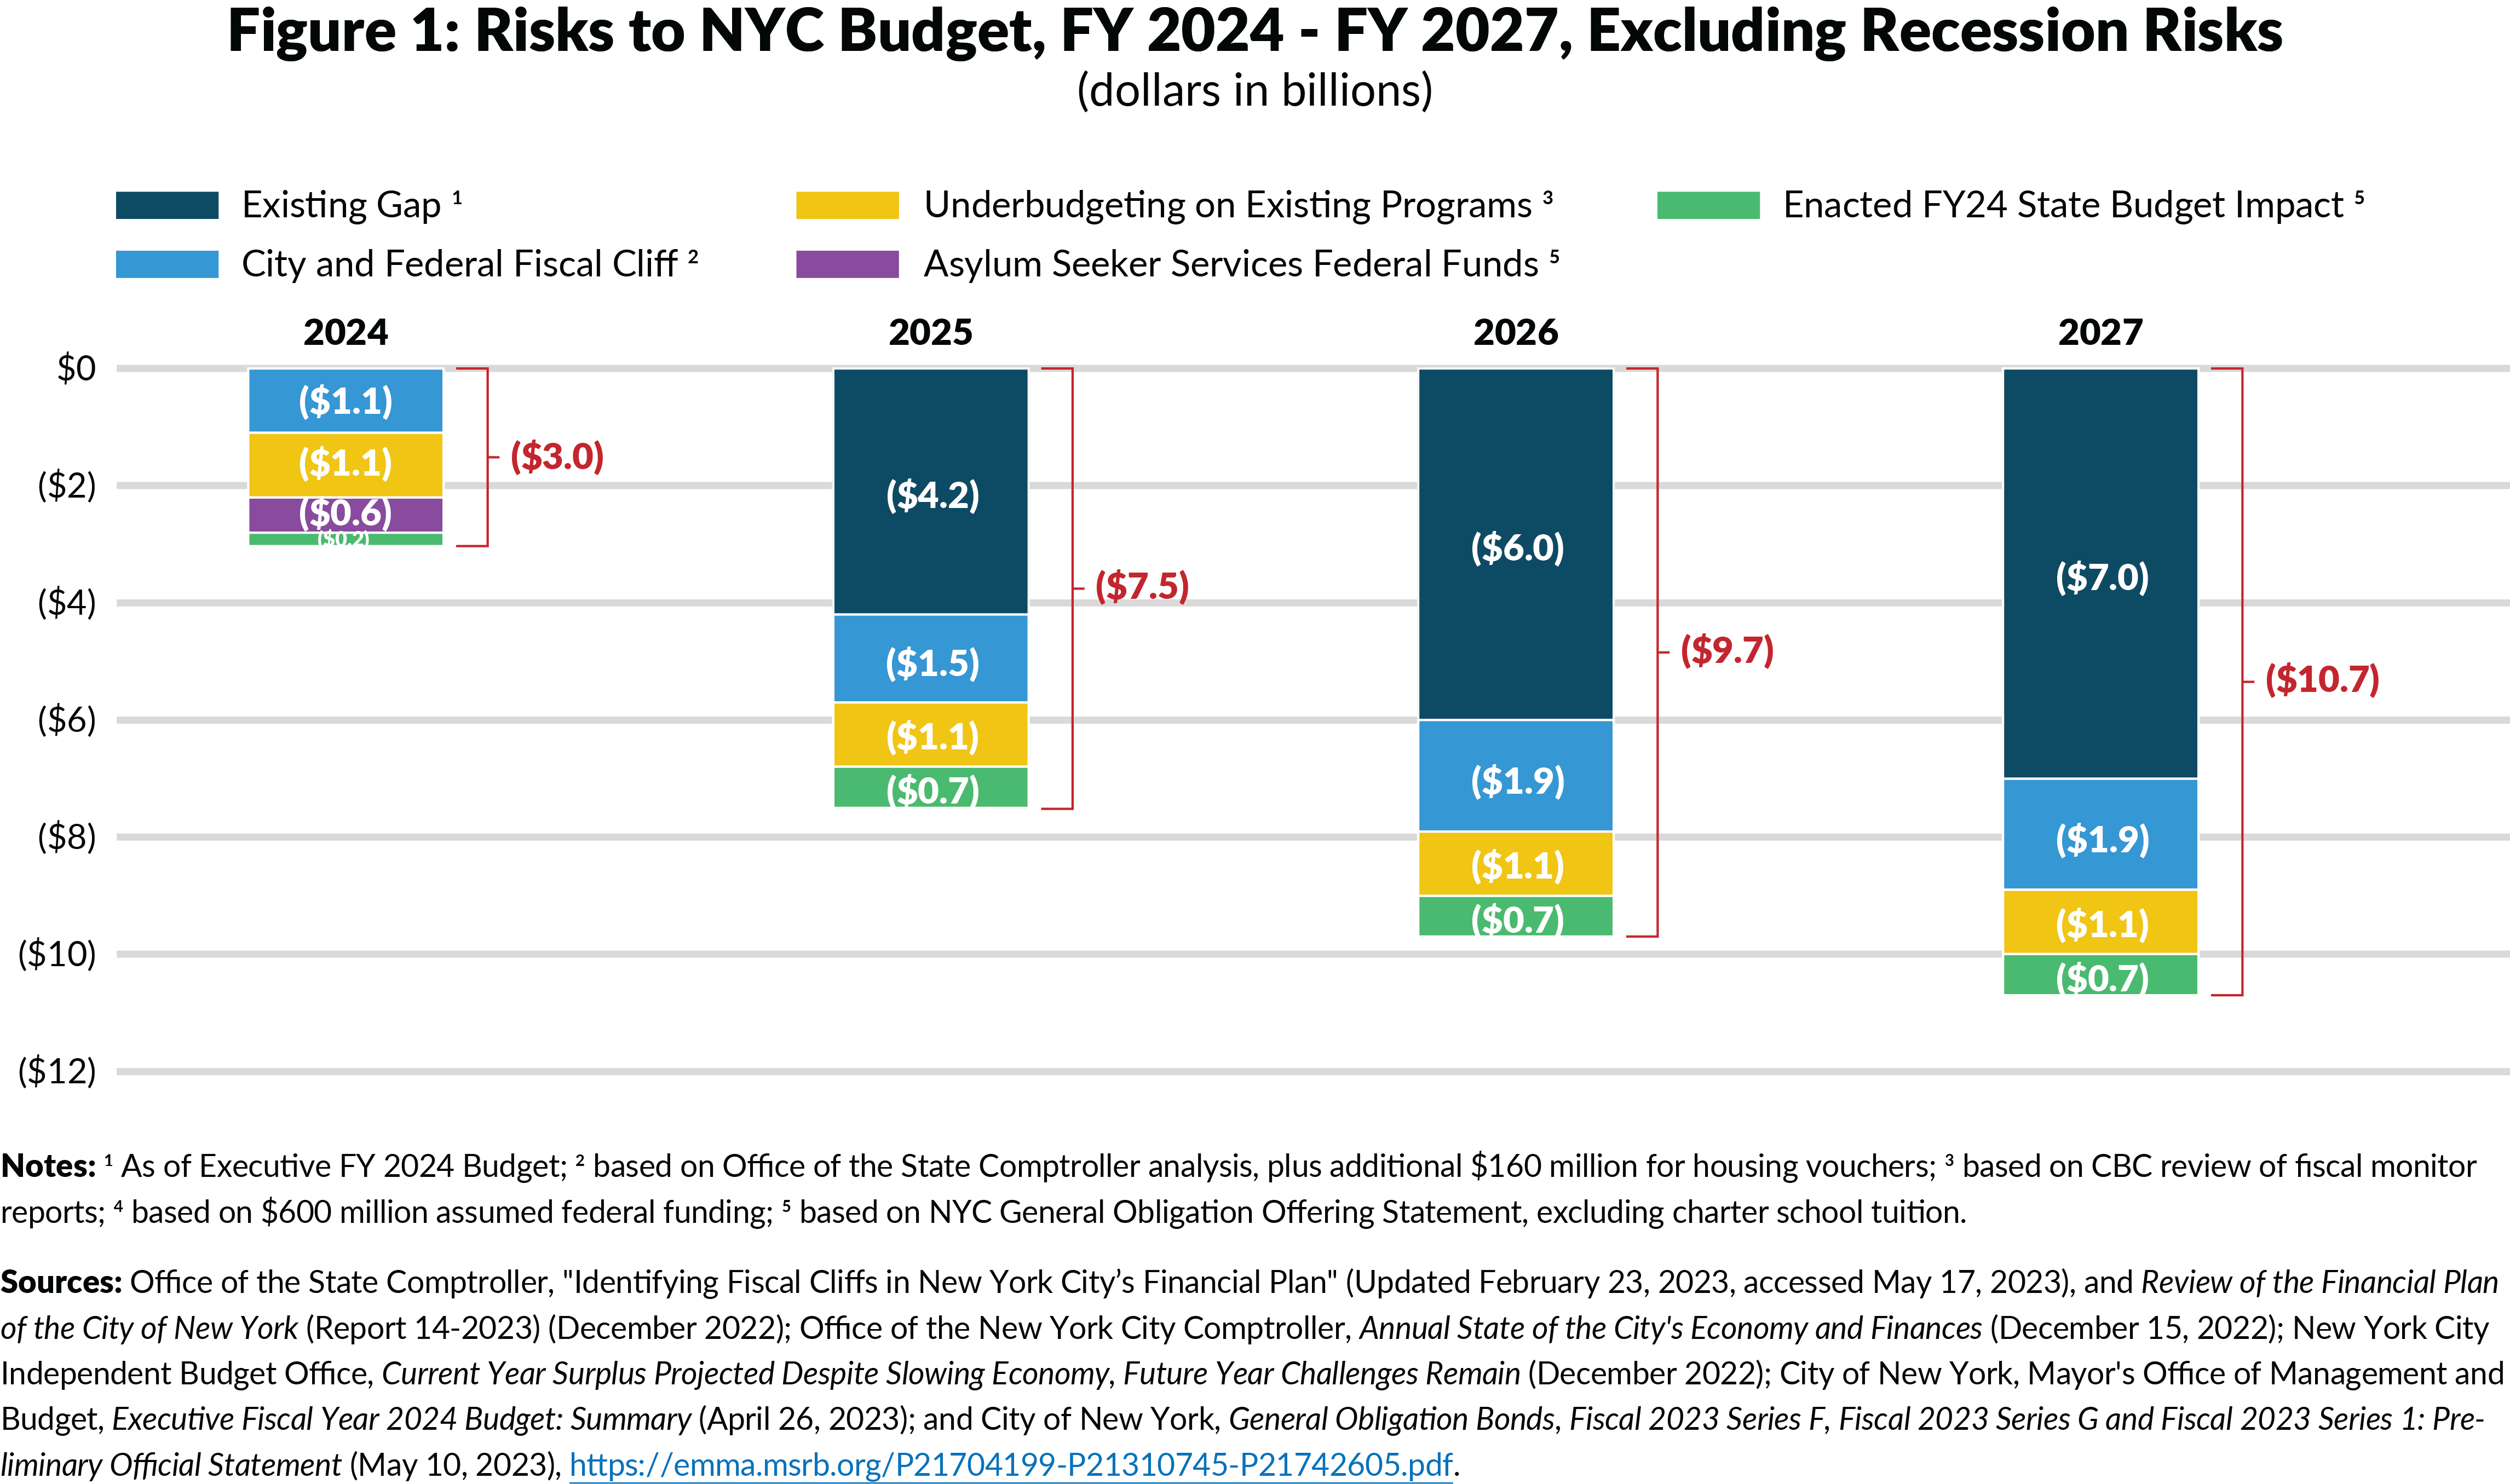
However, the PEGs and vacancy reduction do not sufficiently reduce the City’s large budget gaps. In fact, the gaps have widened since the Preliminary Fiscal Year 2024 Budget to $4.2 billion, $6 billion, and $7.0 billion in fiscal years 2025, 2026, and 2027, respectively. Furthermore, CBC finds that budget gaps are larger than those reported due to City and federal fiscal cliffs (recurring programs funded with non-recurring resources), underbudgeting for programs and costs such as overtime, the impact of the Enacted Fiscal Year 2024 State Budget, and potentially lower than expected Federal aid for asylum seekers. The City could have to identify $3.0 billion just to balance fiscal year 2024—the budget currently being negotiated—and will have gaps of $7.5 billion, $9.7 billion, and $10.7 billion in fiscal years 2025 to 2027, respectively. (See Figure 1.)
TOTAL VALUE OF FOUR SAVINGS PLANS
Cumulative Recurring Savings from PEGs and Vacancy Reduction Initiative Total $4.1 Billion, 3.6 Percent of All Funds and 5.9 Percent of Applicable City-Funded Spending
The four savings plans total $2.8 billion in fiscal year 2023 savings and $4.1 billion in recurring annual savings starting in fiscal year 2024. (See Table 1.) Savings in fiscal years 2024 to 2027 average 3.6 percent of all funds spending and 5.9 percent of City-funded spending excluding Medicaid, Public Assistance, and pension contributions, which are not subject to the PEG. If illusory savings are excluded, the cumulative value of plans in fiscal years 2024 to 2027 is 3.3 percent of all funds spending and 5.5 percent of City-funded spending.
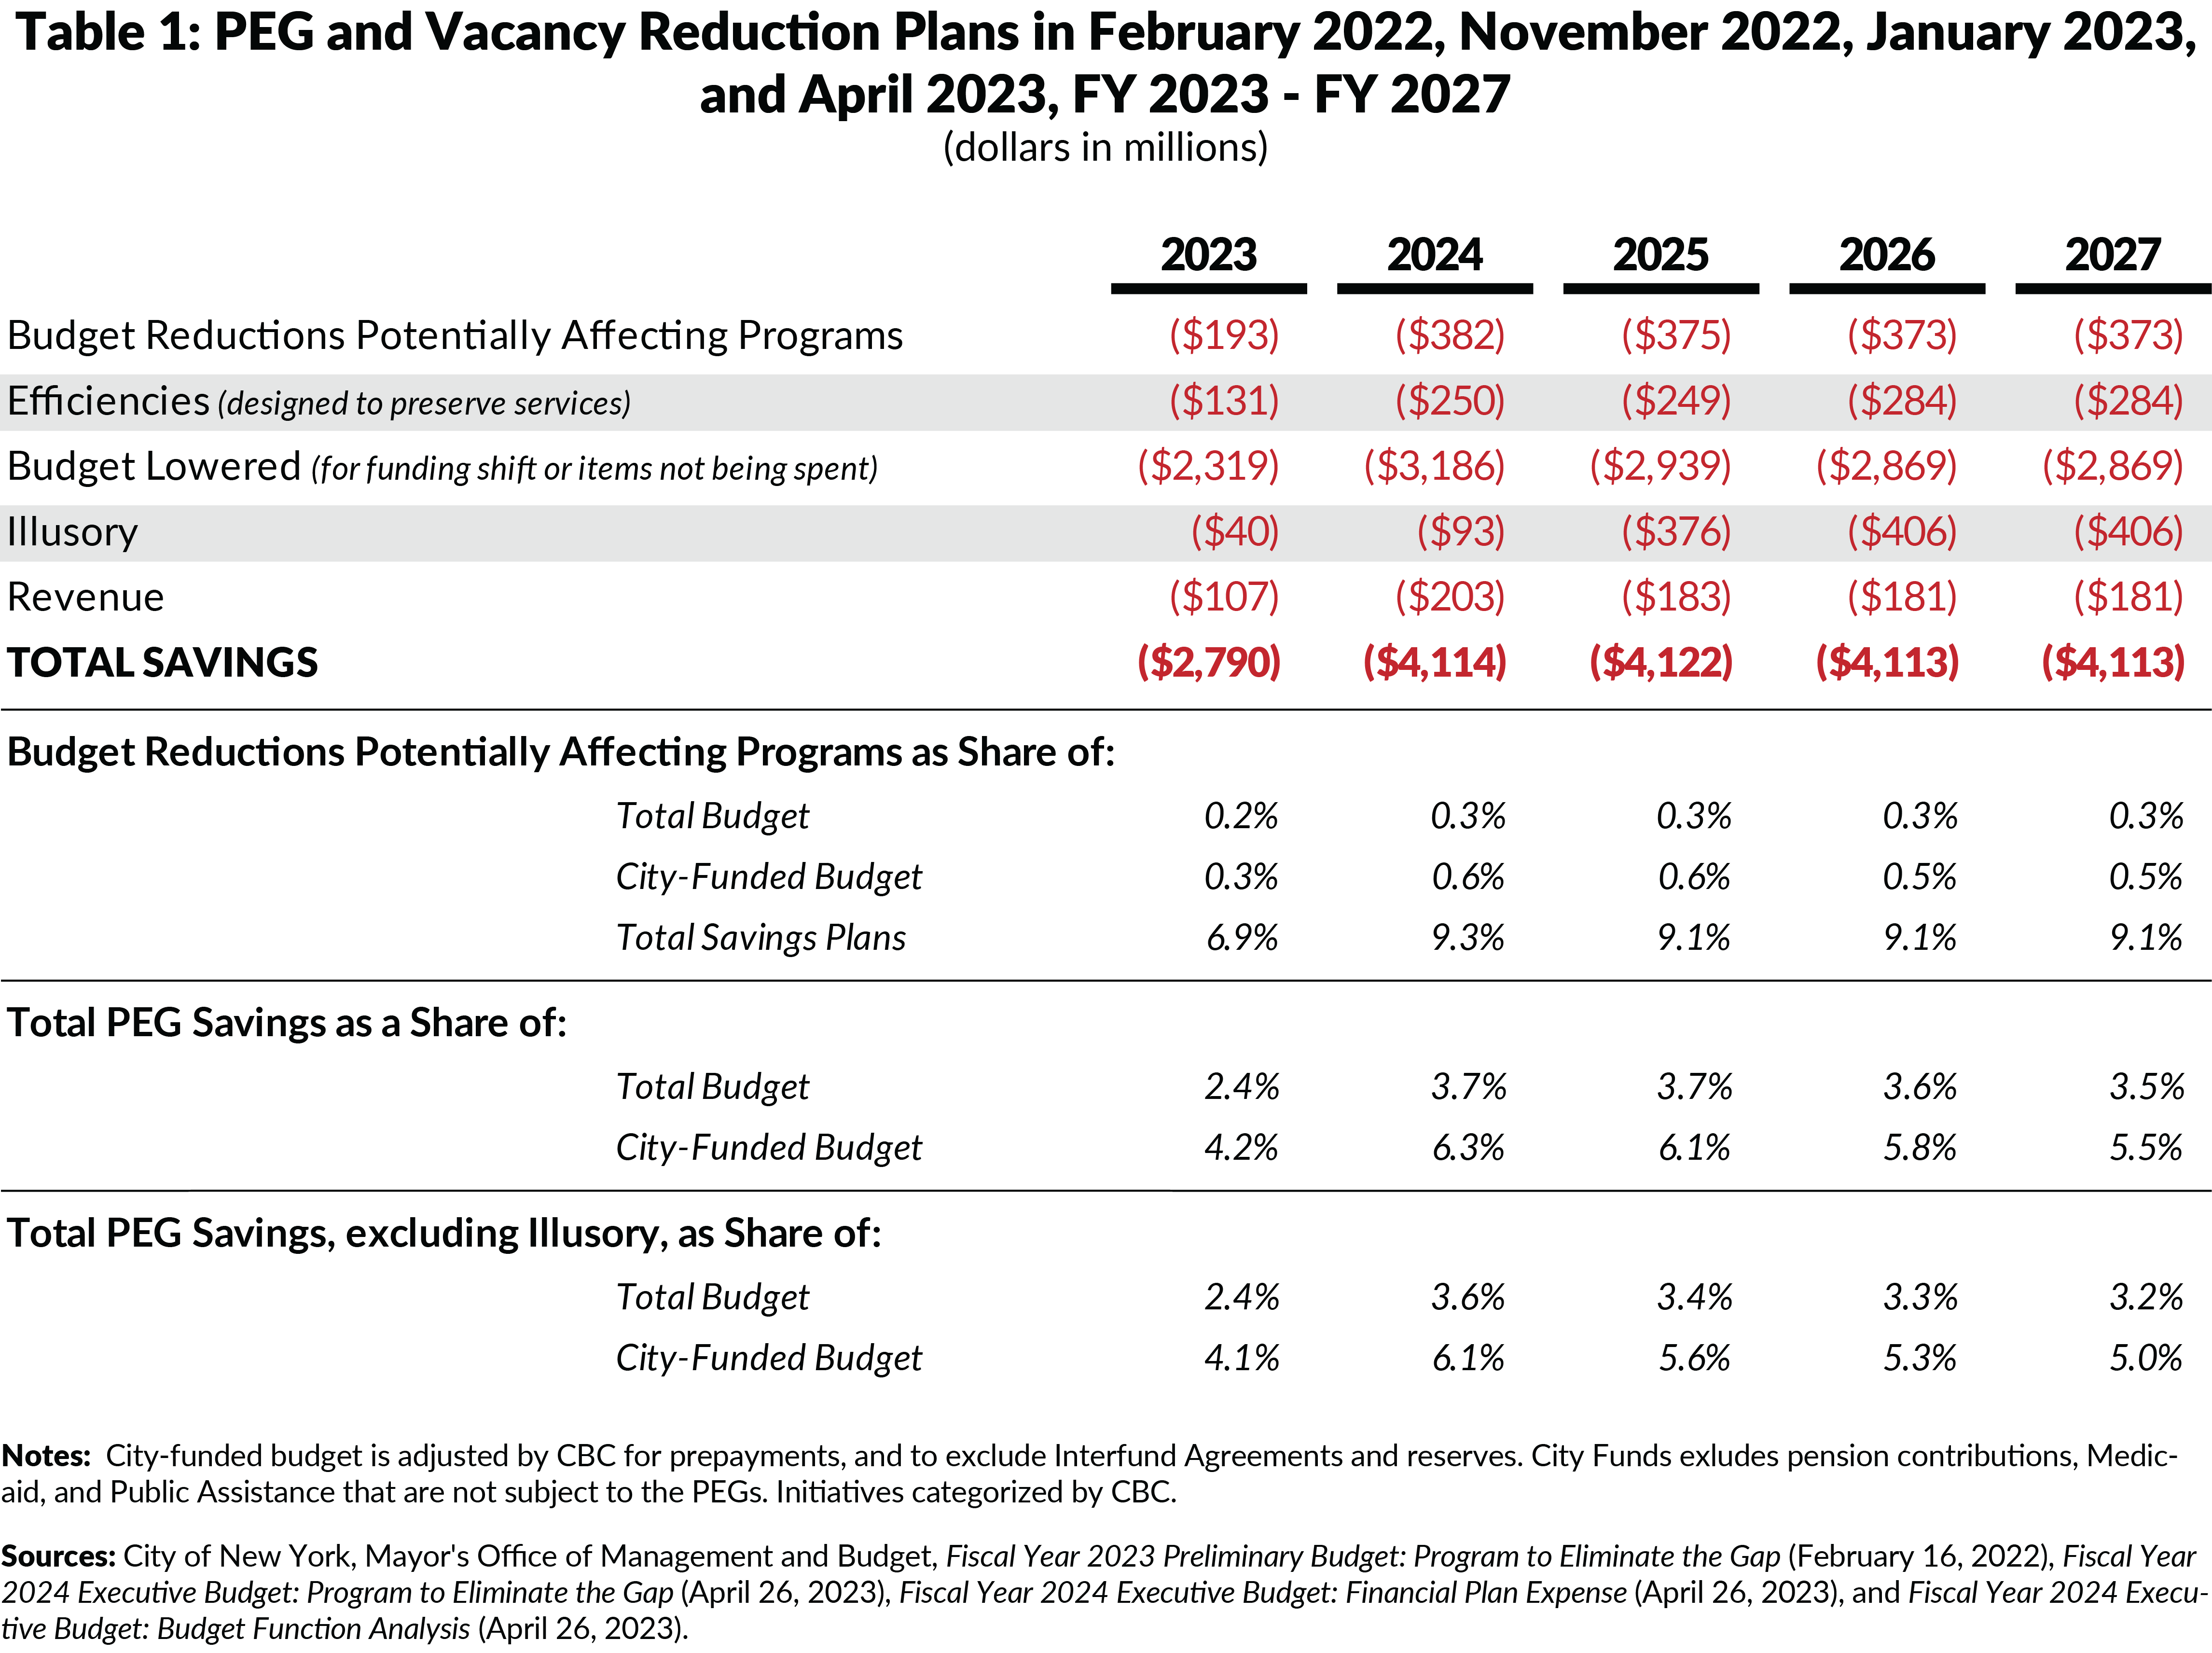
Cumulative Savings Potentially Affecting Programs Average $376 Million Annually in Fiscal Years 2024 to 2027, Equal to 0.3 Percent of Total Budget or 0.5 Percent of Applicable City-Funded Spending
A relatively small share of these savings potentially affects programs and services. Across the four savings plans, reductions potentially affecting programs were just 0.3 percent of all funds spending and 0.5 percent of City-funded spending excluding pension contributions, Public Assistance, and Medicaid.
CBC PEG Categories
- Budget Lowered (for funding shifts or items not being spent):
- Underspending or Re-estimates: Savings from lower than previously expected costs or generated from underspending not attributable to specific efforts to reduce spending.
- Funding Shifts: Reductions in City-funded spending due to securing non-City revenues. Occasionally, these may be recurring funding, but in most instances, these are one-time revenues from prior years applied to current year spending.
- Vacancy Reduction: Savings from eliminating vacant positions and accruals, short-term savings from temporarily unfilled positions, and hiring delays.
- Debt Service Savings: Savings from lower-than-expected debt service, including variable rate interest, refunding savings, and differences in actual versus projected debt service on new debt.
- Budget Reduction: Savings that reduce the City funds budget of certain programs, potentially affecting services.
- Efficiency Savings: Initiatives that lower spending without reducing services through improvement in operations.
- Revenue Savings: Initiatives that increase City-funds revenue.
- Illusory Savings: Savings that offset new spending added in the same budget, which do not reduce budget gaps. The Mayor’s Office of Management and Budget labels them “cost avoidance.”
Revenue Raising PEGs are Increasing, Now Totaling $179 Million in New Recurring Annual Revenue from Businesses and Residents
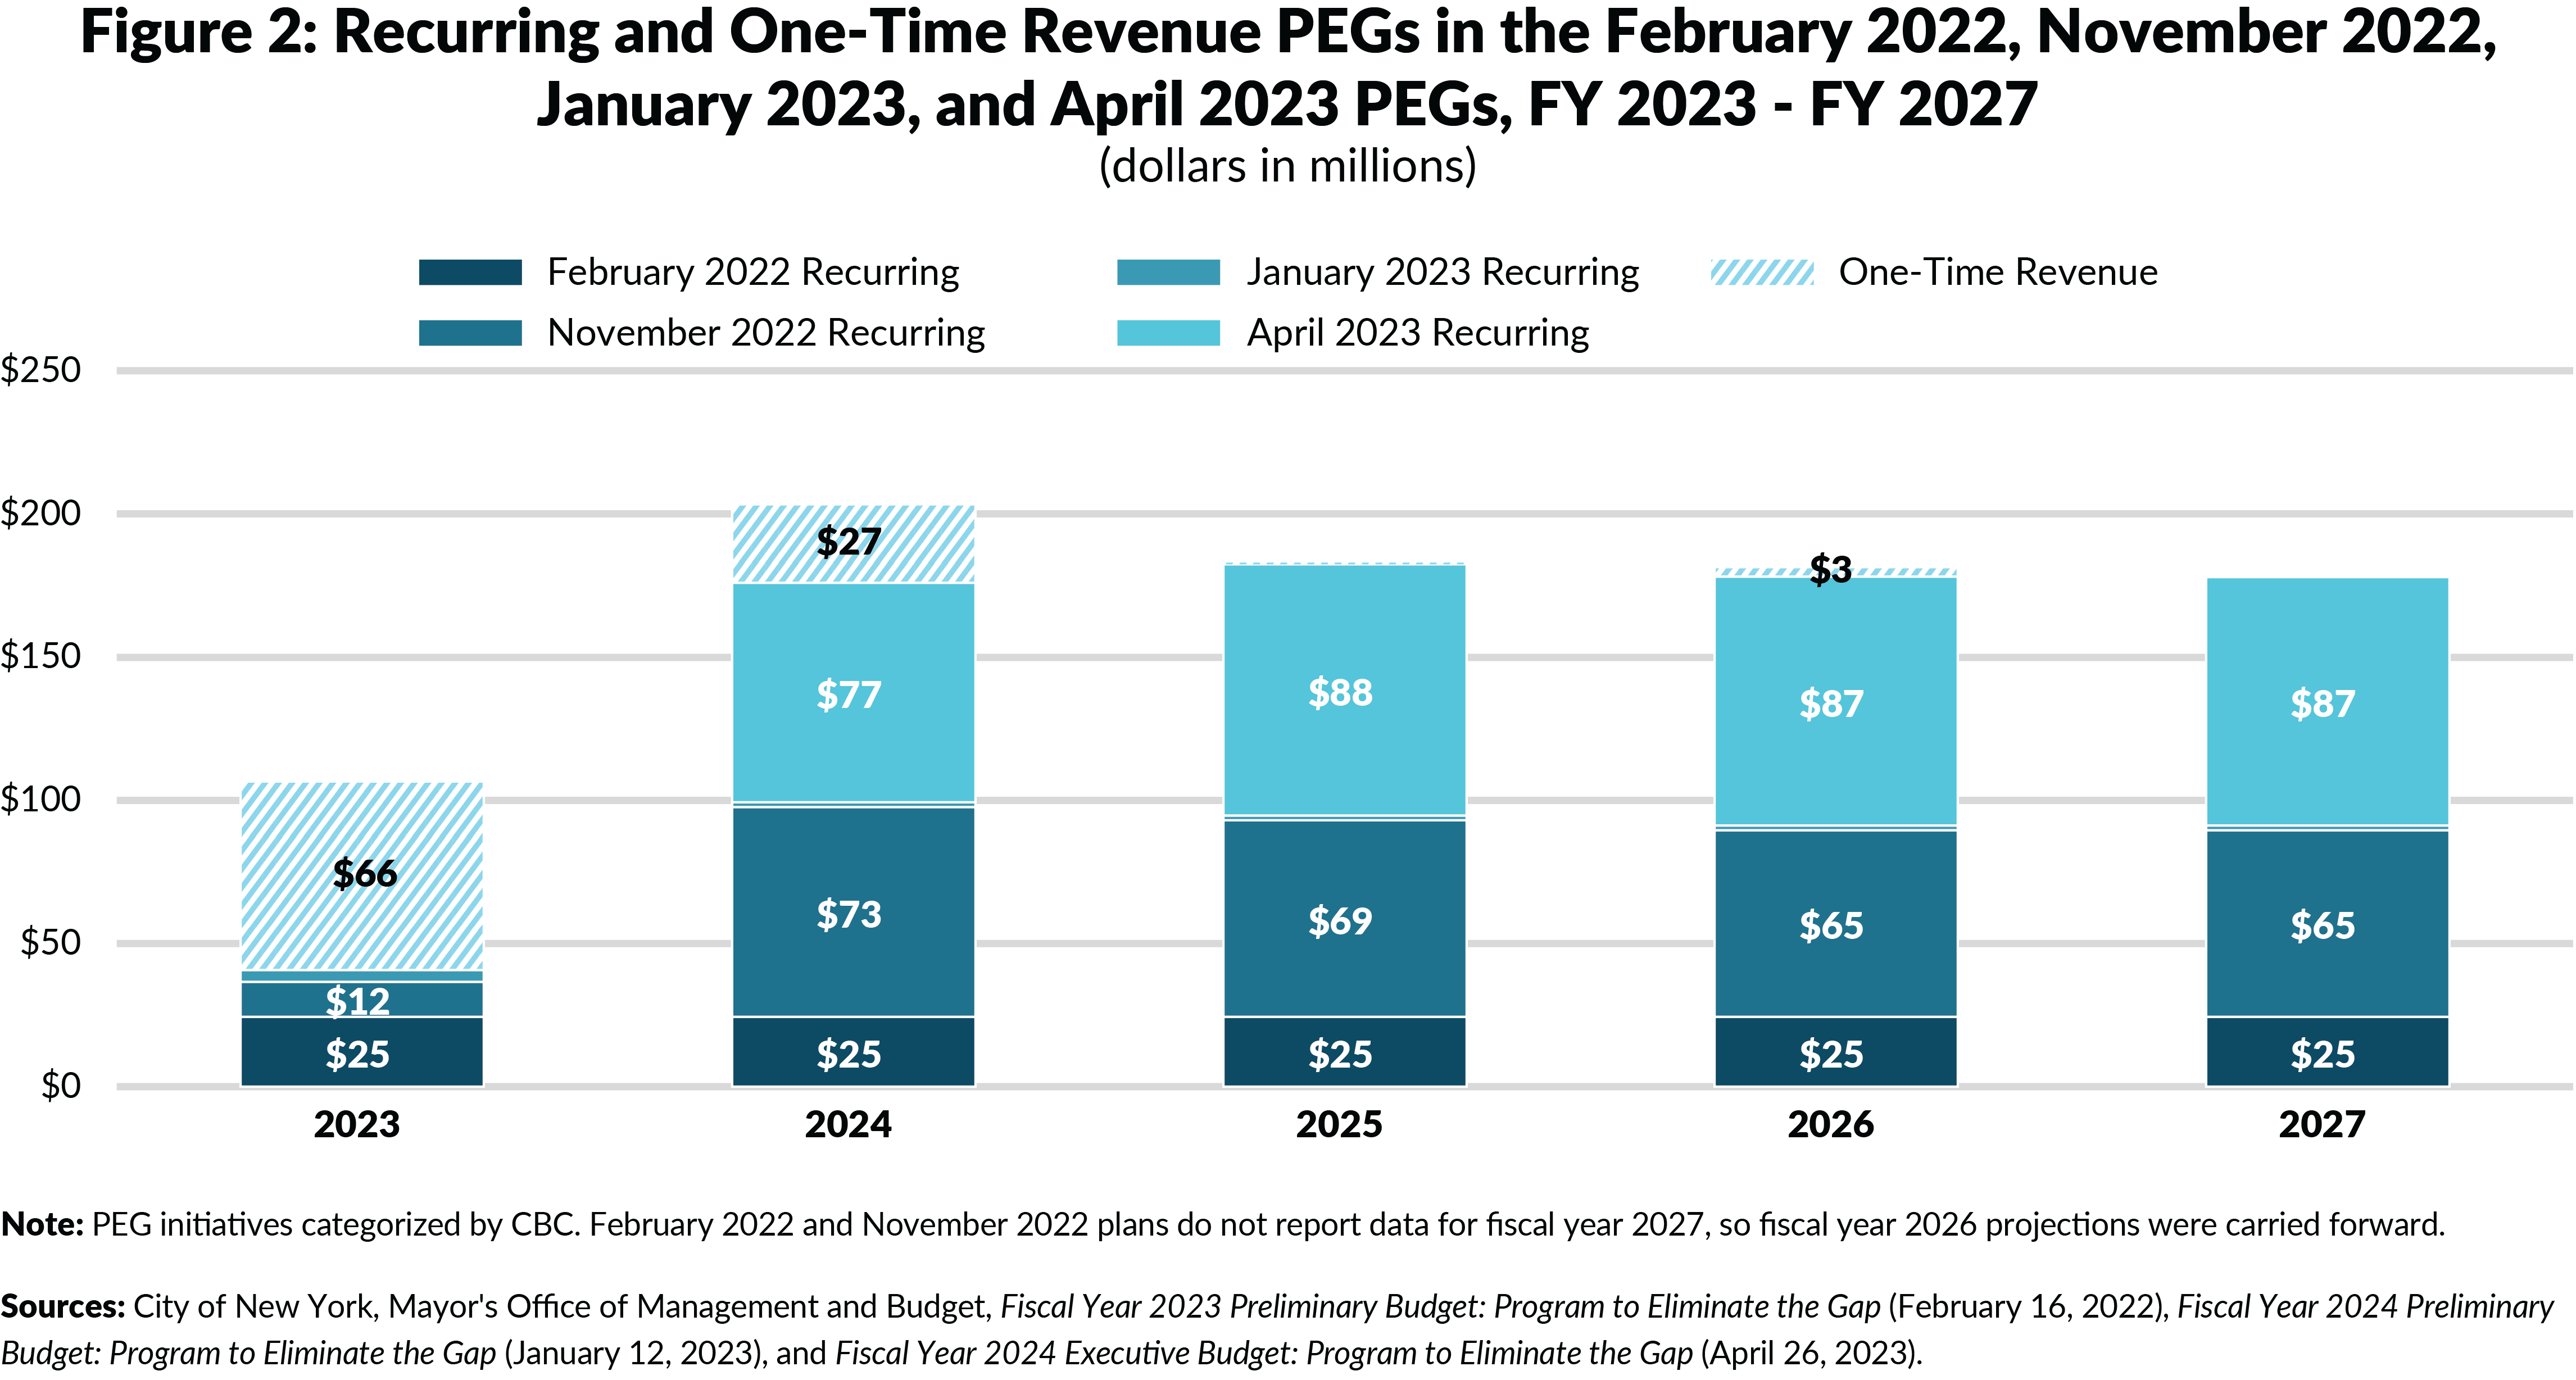
PEGs can narrow the gap by increasing revenue, rather than reducing spending. Revenue PEGs include non-recurring revenue from higher-than-expected collections or actions such as asset sales and recurring revenue from higher projections of on-going collections. These totaled 8 percent of the Executive Budget PEG, compared to 4 percent in January 2023, 6 percent in November 2022, and 2 percent in February 2022. Cumulatively, revenue PEGs will generate nearly $180 million in recurring annual revenue, much of which will be paid by City business and residents. (See Figure 2.)
City Still Has Nearly 23,000 Vacant Full-Time Positions and Added Over 1,270 New Full-Time Positions, After Vacancy Reductions Save $1.0 Billion in Fiscal Year 2024
As of January 2023, following the Administration’s November 2022 directive to agencies to cut a portion of the City-funded vacant civilian positions by half, 23,000 full-time positions remain vacant.1 Moreover, the Executive Budget added 1,274 full-time positions in fiscal year 2024.2 Most of the additions were uniformed sanitation positions and civilian health and mental hygiene positions.
The City has sufficient vacancies and should not be adding new positions. Instead, it should shift vacancies to where they are most needed and take steps to aggressively reform how it hires, especially for critical functions.
FISCAL YEAR 2024 EXECUTIVE BUDGET PEG
Fiscal Year 2024 Executive Budget PEG Averages $1.1 Billion Annually from Fiscal Year 2024 Onwards
The April 2023 memo from the Office of Management and Budget (OMB) directed most agencies to identify savings equal to 4 percent of their City-funded spending; the Department of Education (DOE) and City University of New York (CUNY) were directed to identify 3 percent. Subsequently, the City’s libraries and the Department of Cultural Affairs were exempted from the PEG entirely.
The Fiscal Year 2024 Executive Budget includes PEG actions that save $542 million in fiscal year 2023, and an average of $1.1 billion annually from fiscal year 2024 to fiscal year 2027. (See Figure 3.)

87 Percent of Executive Budget PEG Savings Should Not Affect Services
The Executive Budget PEGs that should not affect services include: underspending and re-estimates, funding shifts, vacancy reductions, and debt service (68 percent); efficiencies designed to preserve services (7 percent); illusory savings (3 percent); and new revenues (8 percent).
Underspending and re-estimates, funding shifts, vacancy reductions, and debt service savings total $512 million in fiscal year 2023, increasing to an average of $725 million annually in fiscal years 2024 to 2027. For fiscal years 2024 to 2027:
- 38 percent of savings stem from underspending or re-estimates, nearly $400 million per year, of which three-quarters is from a re-estimate of DOE fringe benefit costs;
- 18 percent of savings are from reducing vacancies;
- 7 percent comes from lower debt service spending; and
- 6 percent comes from shifting funding to federal and State funding sources.
DOE Fringe Benefit Re-Estimate is 28 Percent of the Entire PEG
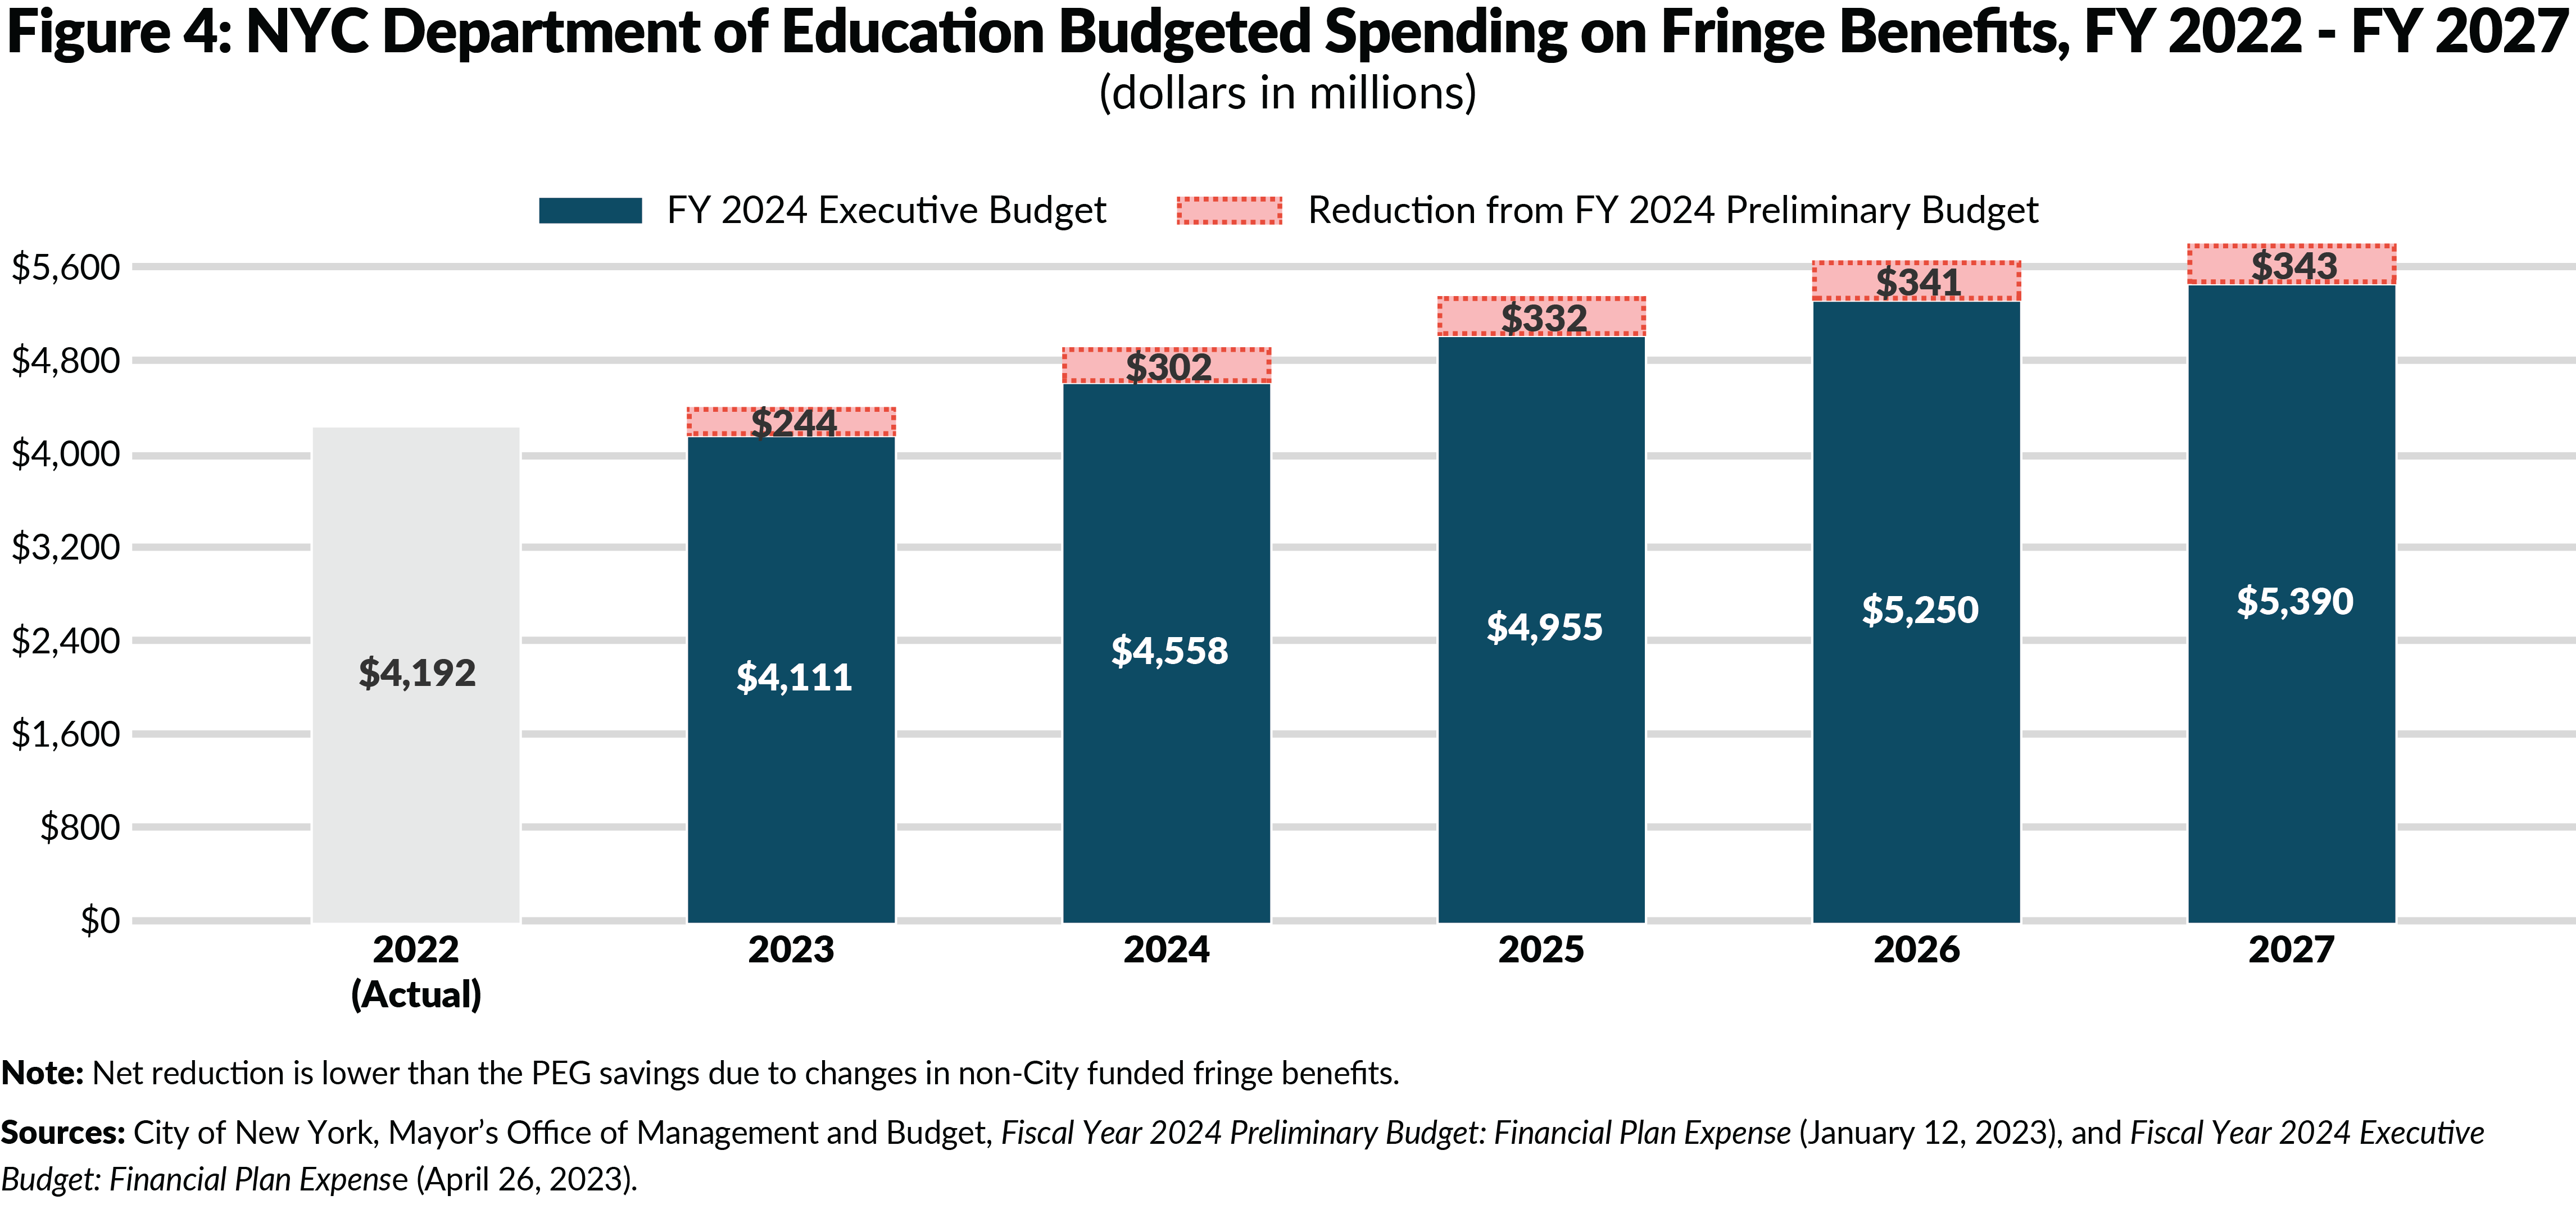
The largest single savings initiative, comprising more than one-quarter of the entire Executive Budget PEG, was to re-estimate DOE’s fringe benefit costs. Before the PEG, DOE fringe benefits were budgeted to grow 11.6 percent, from $4.4 billion in fiscal year 2023 to $4.9 billion in fiscal year 2024. After the significant PEG reduction, 4.6 billion is budgeted for DOE fringe benefits in fiscal year 2024, still 10.9 percent higher than the now projected $4.1 billion in fiscal year 2023. The fringe benefits budget now grows 5.7 percent per year through 2027. (See Figure 4.) Furthermore, given that actual DOE fringe benefit spending has increased by an average of 3.2 percent annually over the past decade, actual spending in fiscal years 2023 to 2027 may be even lower than the re-estimated budget.3
Just 13 Percent of the Executive Budget PEG Savings are from Initiatives that May Affect Services
Recurring reductions to agency budgets that may affect services total around $150 million annually in fiscal years 2024 to 2027, representing 13 percent of the Executive Budget PEG. As a share of the City’s budget, excluding Medicaid, Public Assistance, and pension contributions, these reductions were less than one-quarter of a percent of City-funded spending.
Illusory Savings Reappear
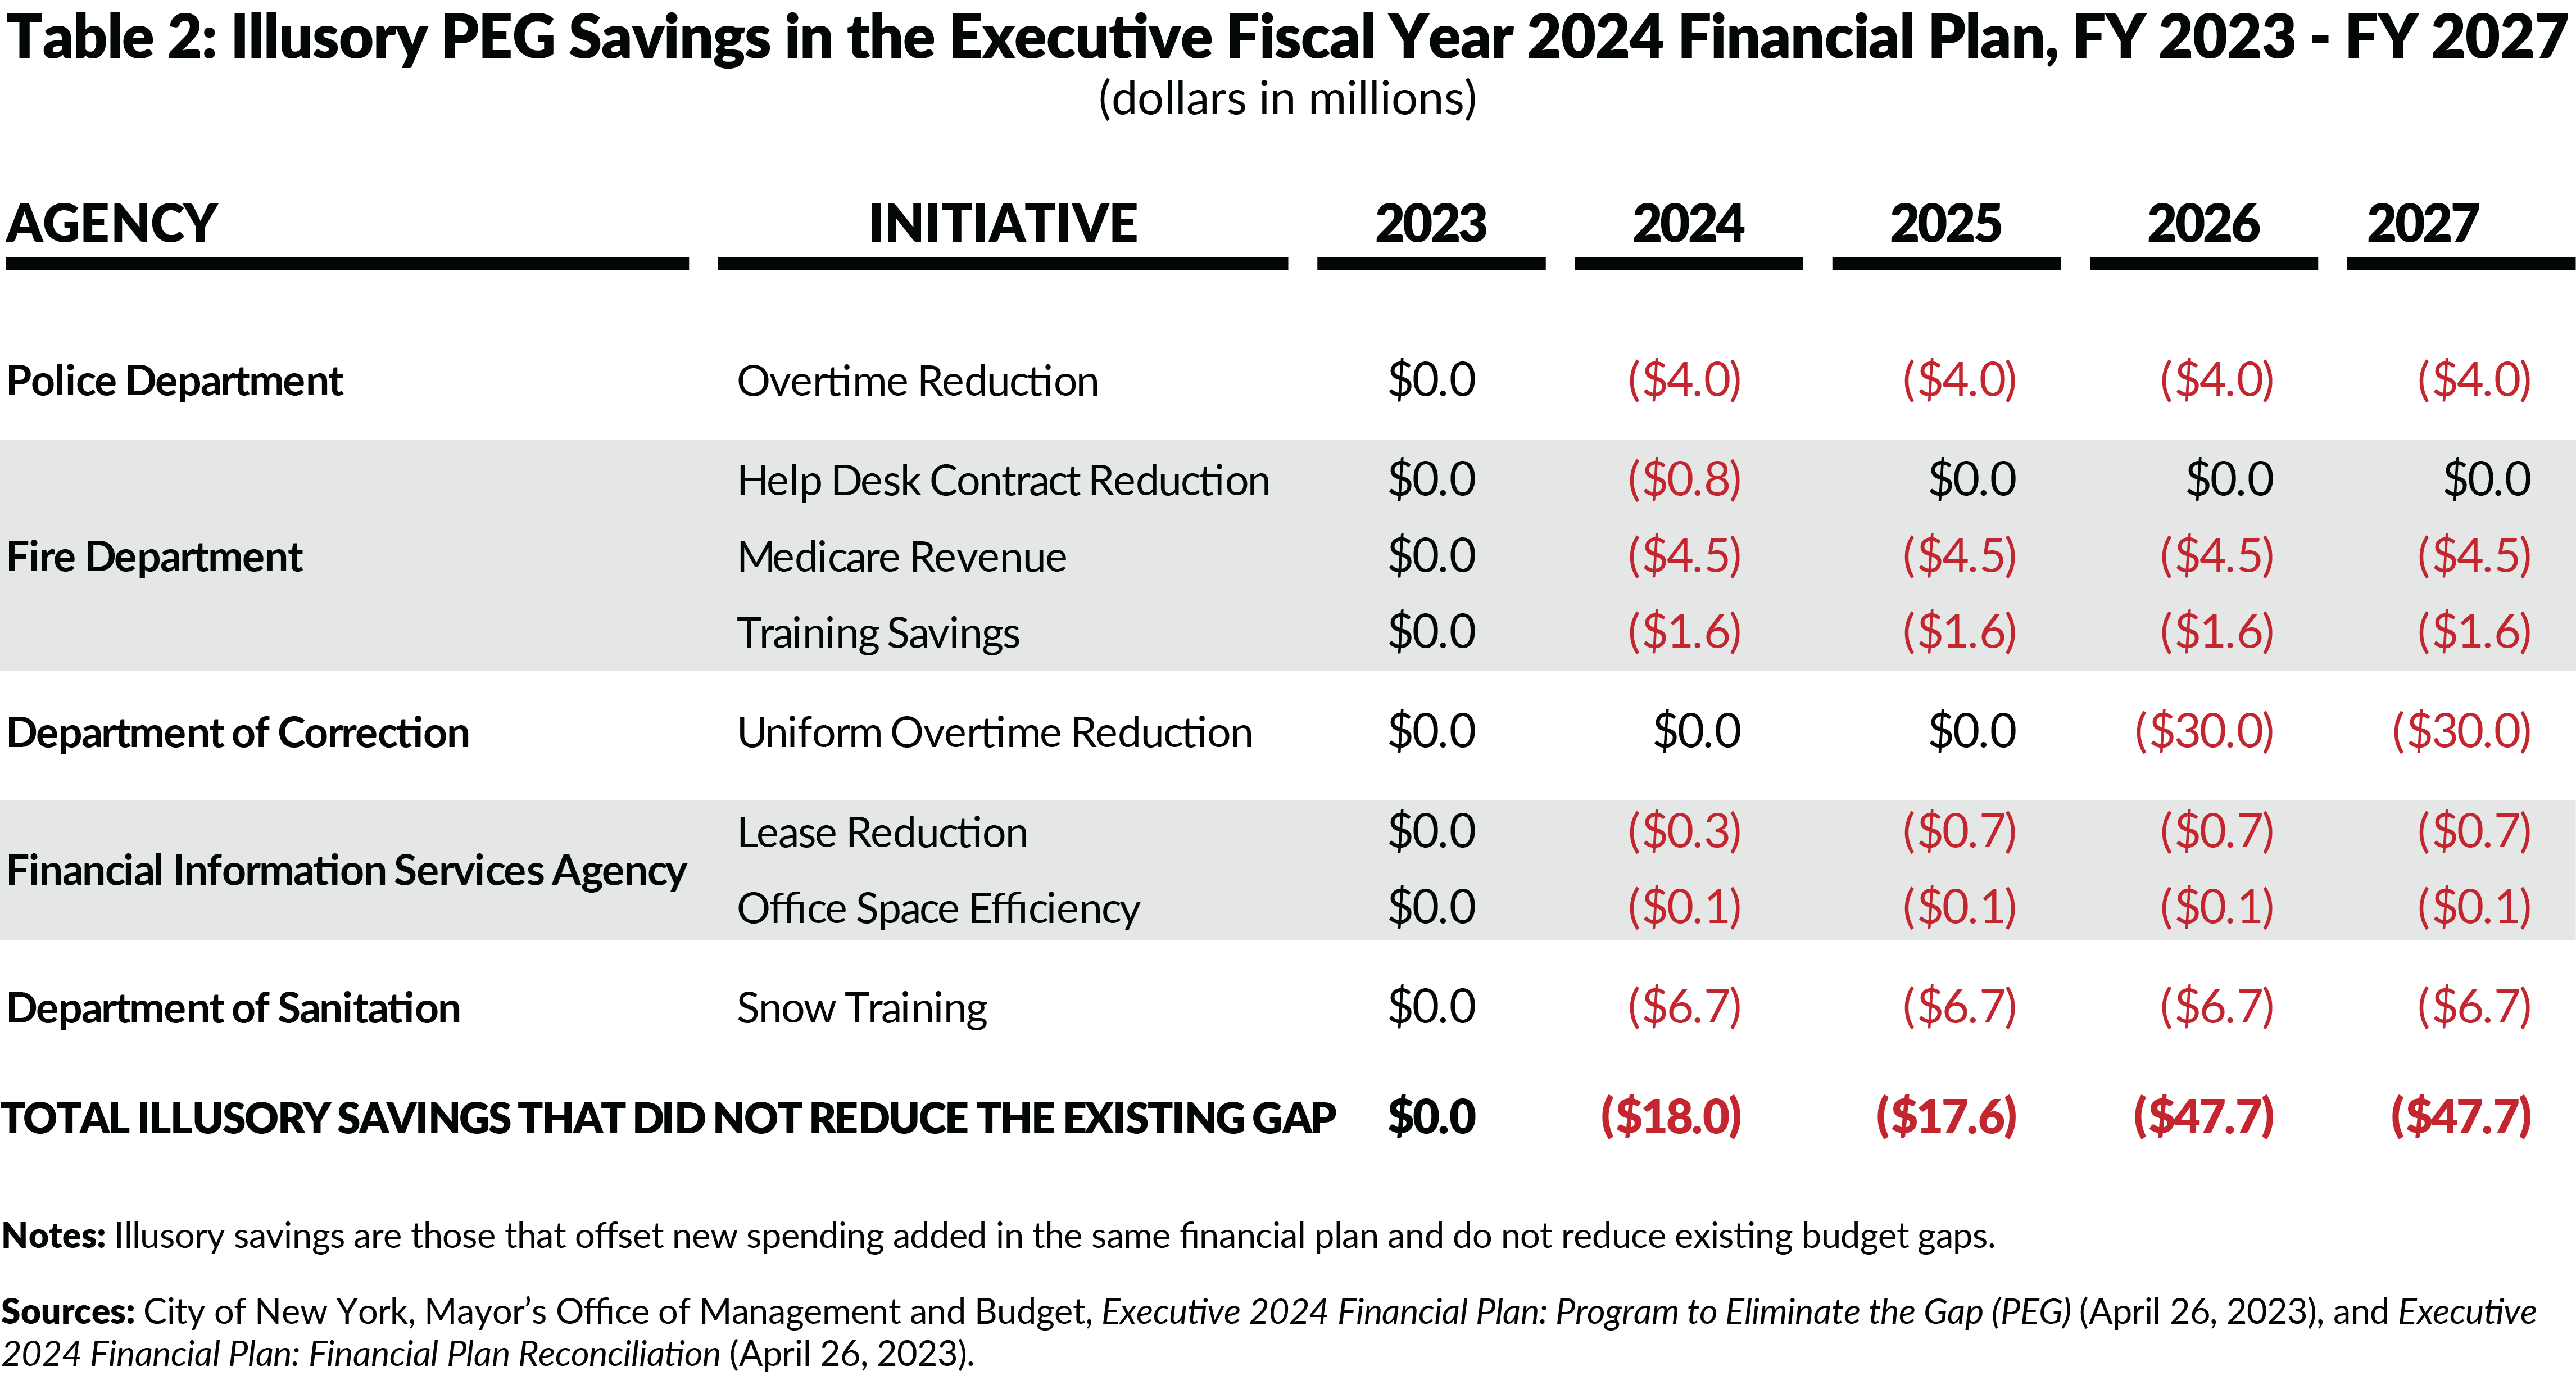
Illusory savings reappear, though at a lower level than in the November 2022 PEG. Illusory savings are those for which the budget both adds and claims credit for reducing the same spending; these savings are not actually gap reducing but do serve to make the PEG appear larger than it is. OMB refers to them as cost avoidance.
The illusory savings in the Executive Budget PEG are $18 million annually in fiscal years 2024 and 2025, and $48 million annually in fiscal years 2026 and 2027. (See Table 2.) For example, the City will not be leasing more space for Financial Information Services Agency (FISA), which was not budgeted for, and reflects those as savings. There is also $34 million of savings for overtime, assuming overtime will not increase beyond budgeted levels, despite a long history of the City exceeding budgeted overtime spending.
CONCLUSION
The PEGs and vacancy reduction plan implemented to date have largely reduced spending or increased revenue without directly affecting services. About 9 percent of the cumulative savings across four plans in fiscal years 2024 to 2027 may affect programs, representing just 0.5 percent of City-funded spending subject to the PEG and only 0.3 percent of the total budget. Despite these efforts, the City’s budget gaps remain wide, projected to reach $11 billion by fiscal year 2027, according to CBC’s analysis. The best strategy to narrow budget gaps significantly while preserving services is to implement additional PEGs that focus on improving efficiency—reducing costs without reducing services. This should be prioritized in the adopted budget and in future financial plans.
Download Brief
PEGs In Perspective: NYC FY 2024 Executive BudgetFootnotes
- Another 7,500 full-time equivalent positions are vacant.
- City of New York, Mayor’s Office of Management and Budget, Fiscal Year 2024 Executive Budget: Full-Time and Full-Time Equivalent Staffing Levels (April 26, 2023), https://www.nyc.gov/assets/omb/downloads/pdf/exec23-stafflevels.pdf, and Fiscal Year 2024 Preliminary Budget: Full-Time and Full-Time Equivalent Staffing Levels (January 12, 2023), https://www.nyc.gov/assets/omb/downloads/pdf/jan23-stafflevels.pdf.
- City of New York, Mayor’s Office of Management and Budget, Fiscal Year 2024 Executive Budget: Financial Plan Expense (April 26, 2023), https://www.nyc.gov/assets/omb/downloads/pdf/exec23-fp.pdf, and fiscal year 2013 to 2023 editions, https://www.nyc.gov/site/omb/publications/publications.page.