Top of the Charts
New York and Its Localities Were #1 in Taxes and #2 in Spending


Summary
New York State and New York City are both in the process of determining their fiscal year 2025 budgets. The decisions made will significantly affect New York’s trajectory—its ability to serve New Yorkers, accelerate its economic recovery, and attract and retain residents, businesses, and jobs. Both the State and City face fiscal stress, as well as calls to increase funding for a variety of services.
New York does not exist in a vacuum. It competes with other places, and other jurisdictions’ experiences provide an important perspective on the different choices that are being made.
The Citizens Budget Commission’s (CBC’s) analysis of U.S. Census state and local finance data found that, in 2021, New York State and its localities were the highest taxing and second highest spending among all U.S. states.1 Key parts of the analysis are detailed in the accompanying chartbook. The report finds:
- New York State and its localities spent 50 percent more per capita than the national average—higher than all other States except Alaska;
- Higher than California (7 percent), Massachusetts (24 percent), New Jersey (55 percent), Texas (71 percent), Connecticut (77 percent), and Florida (101 percent);
- New York State and its localities led in taxes, collecting the most per person (63 percent more than the national average) and the most per $1,000 personal income (36 percent more than the national average); and
- New York State and its localities collected more revenue from many types of taxes—property, personal income, corporate, and sales—than most other States and their localities.
These 2021 data are the most recent available, before New York increased tax rates and grew spending. New York State and New York City have both substantially increased spending since State and City fiscal year 2021, likely maintaining New York’s chart-topping status.2
New York State has also increased taxes since 2021. State temporary personal income and business tax surcharges enacted in April 2021, will be included in collections beginning in 2022, and were projected to annually yield $4 billion and $1 billion, respectively.3 The State also increased the payroll mobility tax rate as part of the stabilization plan for the Metropolitan Transportation Authority, which took effect on July 2023 and is expected to yield $1.1 billion annually.4
Higher than average taxes and spending is not inherently bad. New York has long chosen to levy high taxes to fund an extensive array and level of services that are relatively high cost. The issue is whether the value proposition—are residents and businesses satisfied with what they get, what they pay for, and what they need—continues to hold and bolster New York’s future. Public officials and the public should consider New York relative to its competitors to ensure that the tax burdens supporting government spending do not undercut the State’s job growth and attractiveness to residents and businesses. They also should consider whether New York’s local governments should be able to provide needed services at a lower cost.
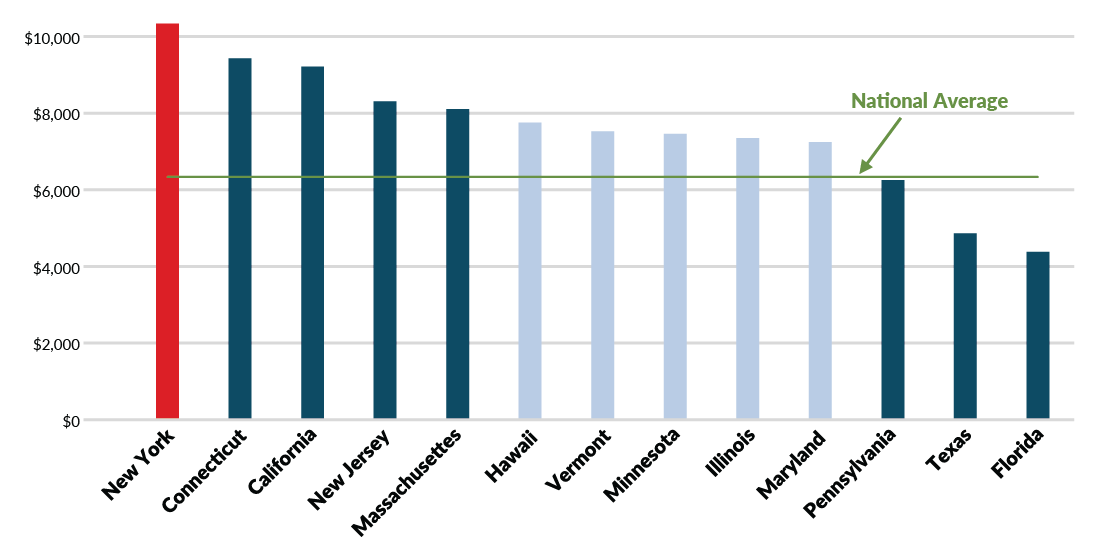
Total State & Local Taxes Collected per Capita, Top 10 & Comparator States, 2021
U.S. Department of Commerce, Bureau of the Census, “2021 State & Local Government Finance Historical Datasets and Tables” (accessed August 1, 2023), https://www.census.gov/data/datasets/2021/econ/local/public-use-datasets.html.
Download Chartbook
CBC-PRESENTATION_Tax-Spend_02132024.pdfNew York is at a precarious time, with hybrid work, pandemic-accelerated outmigration, affordability challenges, and high taxes all potentially posing threats to its future. Neighboring and competitor states are able to tax and spend less. Given the need to compete, increasing taxes in New York would risk the State’s economic wellbeing. New York should focus on identifying which services and policies are most critical for New Yorkers and New York’s future, run them well, and align spending with affordable, recurring revenues.
Findings
Using U.S. Census Bureau’s Annual Survey of State and Local Government Finances data, the CBC analyzed tax burdens facing New Yorkers and compared those to the nation’s highest states and a selected set of seven comparator states that represent New York’s regional and national competitors—California, Connecticut, Florida, Massachusetts, New Jersey, Pennsylvania, and Texas. The amounts spent and collected reflect all levels of government within the state; for example, New York’s personal income tax collections are the sum of New York State, New York City, and Yonkers personal income tax, while property taxes include collections by counties, towns, villages, school districts, and all other local government entities.
Taxes
New York State and its local governments collected the most taxes of all U.S. States in 2021, relative to both the state’s population and personal income.
- New York led with $10,331 taxes collected per resident—nearly $4,000 more than the national average; and
- New York State and local governments tax collections were $135 per $1,000 of total personal income—the highest of all States and 36 percent higher than the national average.
Compared to a set of seven competitor states and their localities, New York collections were significantly higher.
- On a per capita basis, New York State and its localities collected 10 percent more than Connecticut, 12 percent more than California, 24 percent more than New Jersey, 27 percent more than Massachusetts, 65 percent more than Pennsylvania, 113 percent more than Texas, and 136 percent more than Florida; and
- Measuring tax collections relative to personal income, one measure of a State’s economy, New York and its localities similarly collected higher levels of taxes: 13 percent more than California, 25 percent more than New Jersey, and 90 percent more than Florida.
New Yorkers’ high tax burden, nationally and compared to the seven competitors, stemmed not from one specific tax, but from the combination of relatively high collections across four major types:
- Personal Income Tax: 2nd highest nationally;
- New York State and localities were second nationally, at $46 per $1,000 of personal income, only behind California, which collected $49;
- The next highest competitors were Connecticut and Massachusetts, at $34 each;
- Pennsylvania state and locals collected $26 per $1,000 of personal income, while New Jersey collected $24; and
- Florida and Texas have no personal income tax;
- Corporate Income Tax: 6th highest nationally;
- For each $1,000 of state gross domestic product (GDP), New York State and local governments collected $6.40;
- It is important to note that three of New York’s competitors were higher: Connecticut at $8.74, New Jersey at $8.73, and California at $7.74 (per $1,000 of state GDP); and
- Massachusetts collected $5.73, Pennsylvania collected $5.49, Florida collected $2.71, while Texas has no state corporate income tax;5
- Property Tax: 2nd highest nationally; and
- New York’s localities collected $3,343 per person in property taxes in 2021, just 6 percent less than New Jersey’s localities ($3,538), which were the highest in the U.S;
- Connecticut, was not far behind, with localities in that state collecting $3,276 per person; and
- Local governments in New York collected, per capita, 19 percent more than Massachusetts, 51 percent more than Texas, 59 percent more than California, 99 percent more than Pennsylvania, and 106 percent more than Florida;
- Sales Tax: 9th highest nationally;
- While eight states collected more in sales tax revenue per resident than New York, none of those were in the set of New York comparator states;
- New York state and local governments collected $2,324 per resident in 2021, just 1 percent more than Texas and its localities, which have no personal income tax;
- Similarly, New York was only 9 percent higher than Florida state and local governments, which also do not tax personal income; and
- New York state and local governments also exceeded State and local collections in other comparator states: 3 percent more than Connecticut, 8 percent more than California, 17 percent more than Pennsylvania, 20 percent more than New Jersey, and 52 percent more than Massachusetts.
Spending
This high level of taxation supported a comparably high level of spending across all governments in New York—$15,350 per resident. In fact, only one state spent more in 2021; Alaska and its localities spent $15,480, less than 1 percent more than New York. The next highest spender, California’s state and local governments, spent $14,389 per resident. Massachusetts state and local governments, the fifth highest spenders, were more than $3,000 lower per resident than New York.
Conclusion
New York was a leader in taxing and spending in 2021, with New York state and its localities collecting more per capita and per $1,000 of personal income than all other states. Tax increases enacted since then have likely driven tax burdens even higher. New York state and local government spending also was the second highest nationally in 2021 and State and New York City spending has grown significantly since then. While the State’s economy is strong, further tax increases could be counter-productive, threatening New York’s competitiveness. They also should not be needed, since the State and its localities should instead focus on the most impactful programs and policies, running them efficiently and effectively.
Footnotes
- See Appendix for more details on data and methodology. U.S. Department of Commerce, Bureau of the Census, “2021 State & Local Government Finance Historical Datasets and Tables” (accessed August 1, 2023), www.census.gov/data/datasets/2021/econ/local/public-use-datasets.html.
- Ana Champeny, “5 Myths and Facts about the NYC FY 2024 Budget” Citizens Budget Commission Blog (August 15, 2023), cbcny.org/research/5-myths-and-facts-about-nyc-fy-2024-budget; and Patrick Orecki, “What to Look for in New York State’s Fiscal Year 2025 Executive Budget” Citizens Budget Commission Blog (January 11, 2024), cbcny.org/research/what-look-new-york-states-fiscal-year-2025-executive-budget.
- New York State Division of the Budget, FY 2022 Enacted Budget Financial Plan (May 2021), www.budget.ny.gov/pubs/archive/fy22/en/fy22en-fp.pdf.
- Metropolitan Transportation Authority, MTA 2024 Preliminary Budget: July Financial Plan 2024-2027 (July 2023), new.mta.info/document/115321.
- Texas has a franchise tax which yielded $4.5 billion ($2.21 per $1,000 of State GDP) but is not classified as a corporate income tax by the U.S. Census Bureau. See: State of Texas, Texas Comptroller of Public Accounts, Sources of Revenue: A History of State Taxes and Fees 1972-2022 (January 2023), comptroller.texas.gov/transparency/revenue/sources.php .