Twenty Years Later
Integrating Services In The New York City Fire Department
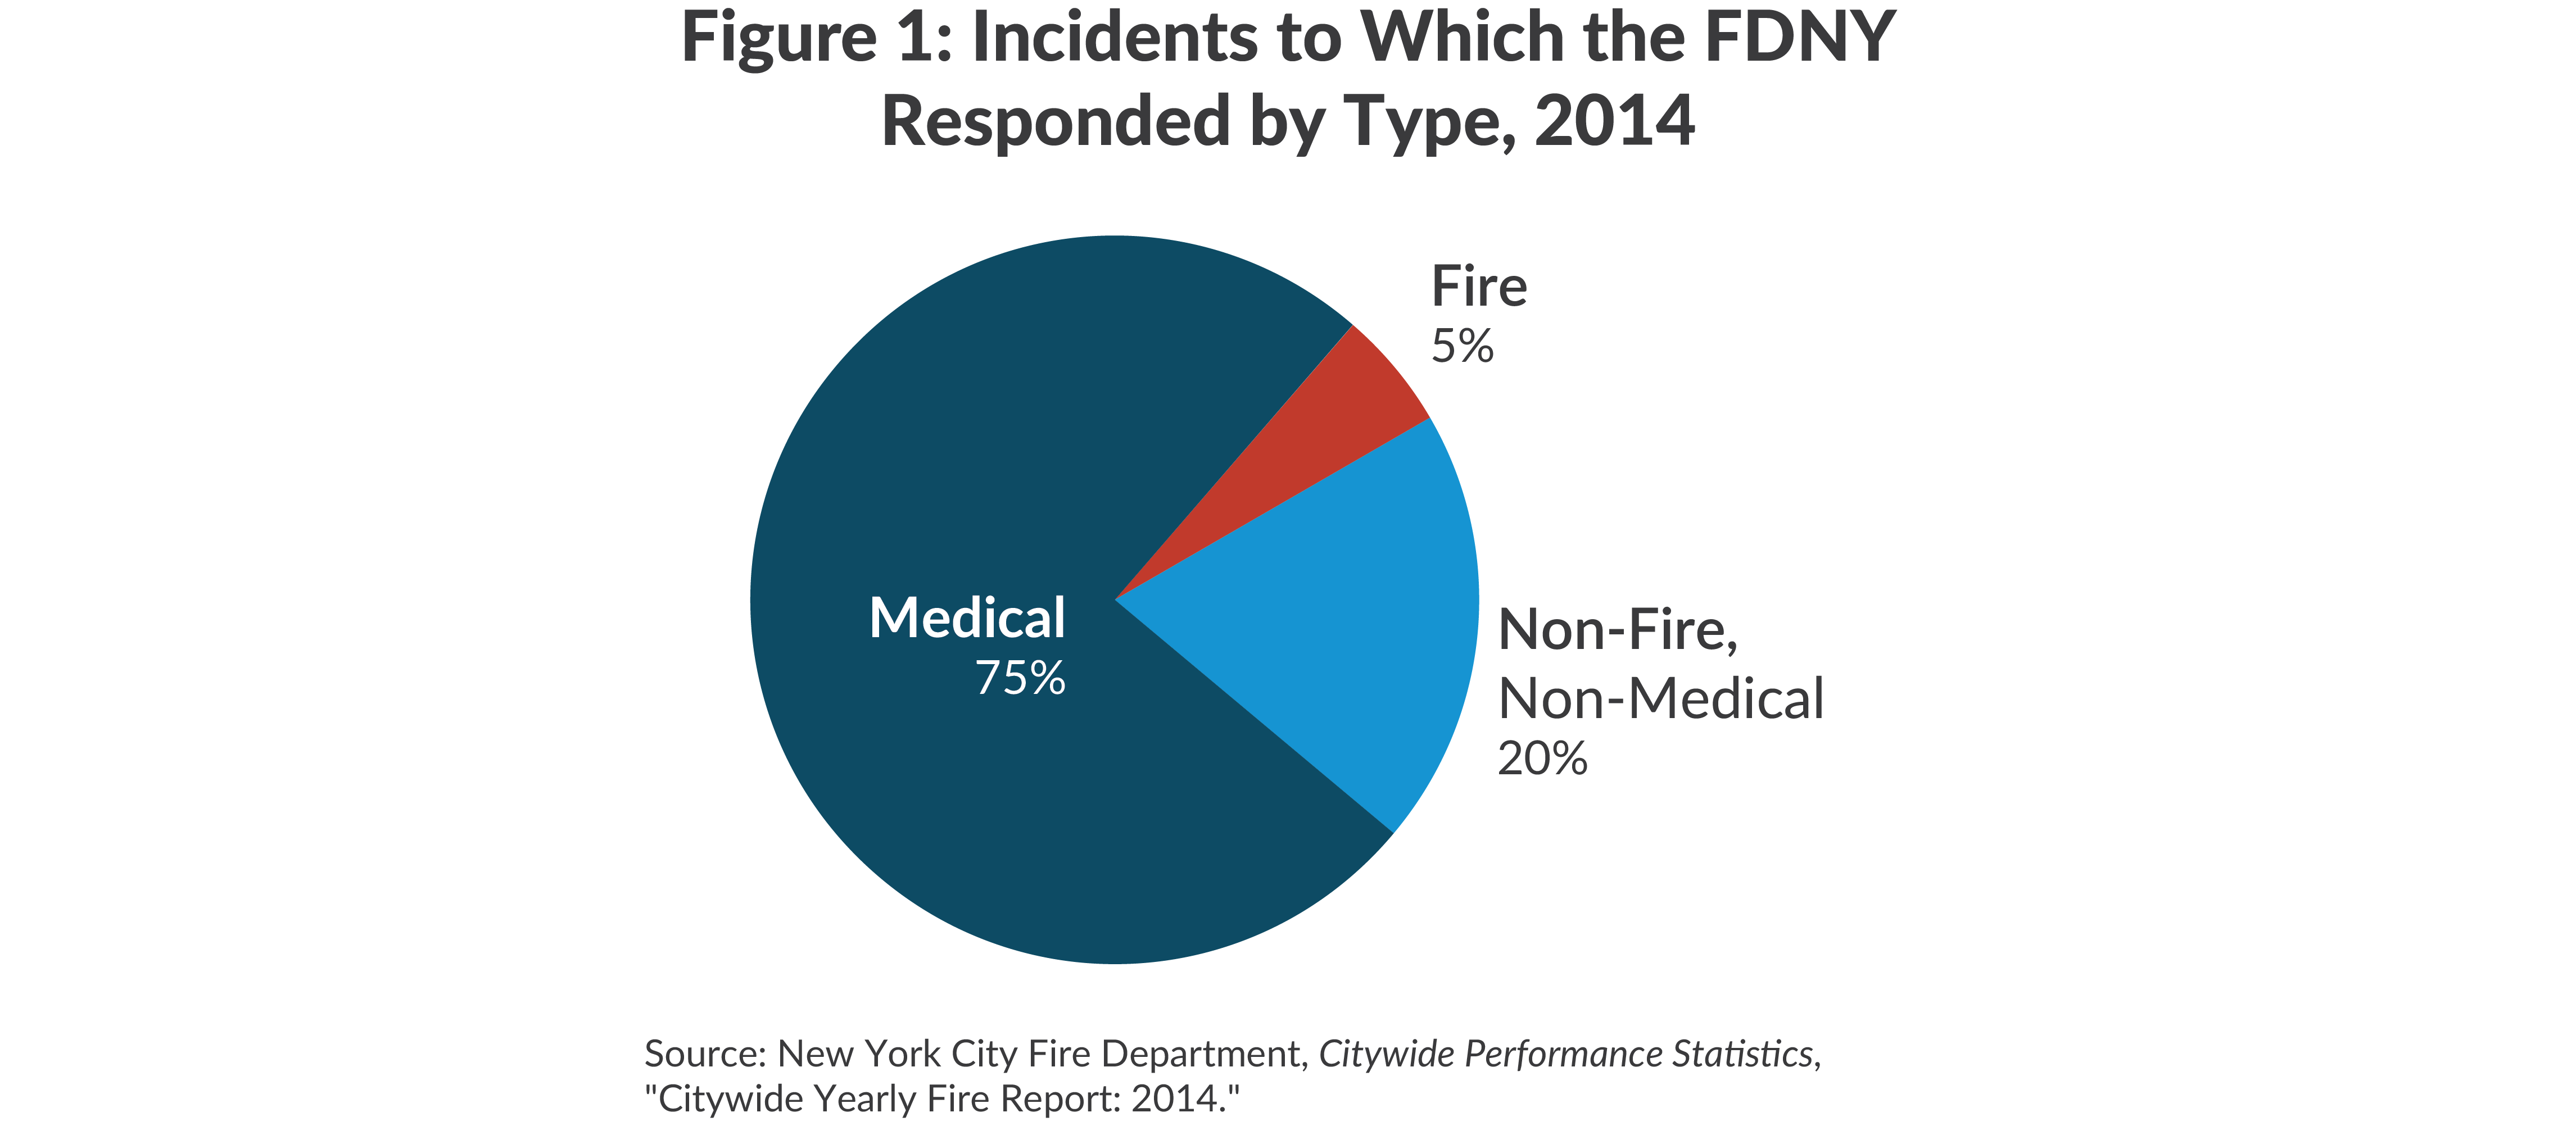
One would think a fire department’s chief responsibility is to fight fires. But when a New Yorker sees a firetruck heading down the street with its lights flashing and siren sounding, the odds are less than one in five that the firefighters are headed to a fire; it is more likely that they are responding to a medical emergency.1
Medical emergencies have outnumbered fires since the municipal ambulance service, known as the Emergency Medical Service (EMS), merged with the New York City Fire Department (FDNY) in 1996. 2 But the merger was not accompanied by a fundamental transformation of the organization and staffing of the FDNY. As a result, the FDNY does not efficiently address its most common job: responding to medical emergencies.
The FDNY leadership has recognized this major challenge. Its 2015 Strategic Plan established a goal of integrating fire and EMS services to enhance emergency medical service. 3 The measures they are taking in pursuit of this goal are constructive, but incremental; bolder actions are essential for meaningful progress.
This policy brief documents the increased volume of medical emergencies and highlights the continued allocation of most of the department’s resources to firefighting despite the declining role of that function. This brief provides three strategies, spanning from short term to medium and long term, for addressing the mismatch.
The Changing Mix of Services
The dominant service the FDNY provides is medical emergency response. In 2014 three-quarters of the 1.3 million incidents to which FDNY vehicles responded were medical incidents—compared to only 5 percent fire-related incidents, and 20 percent non-fire, non-medical incidents.4
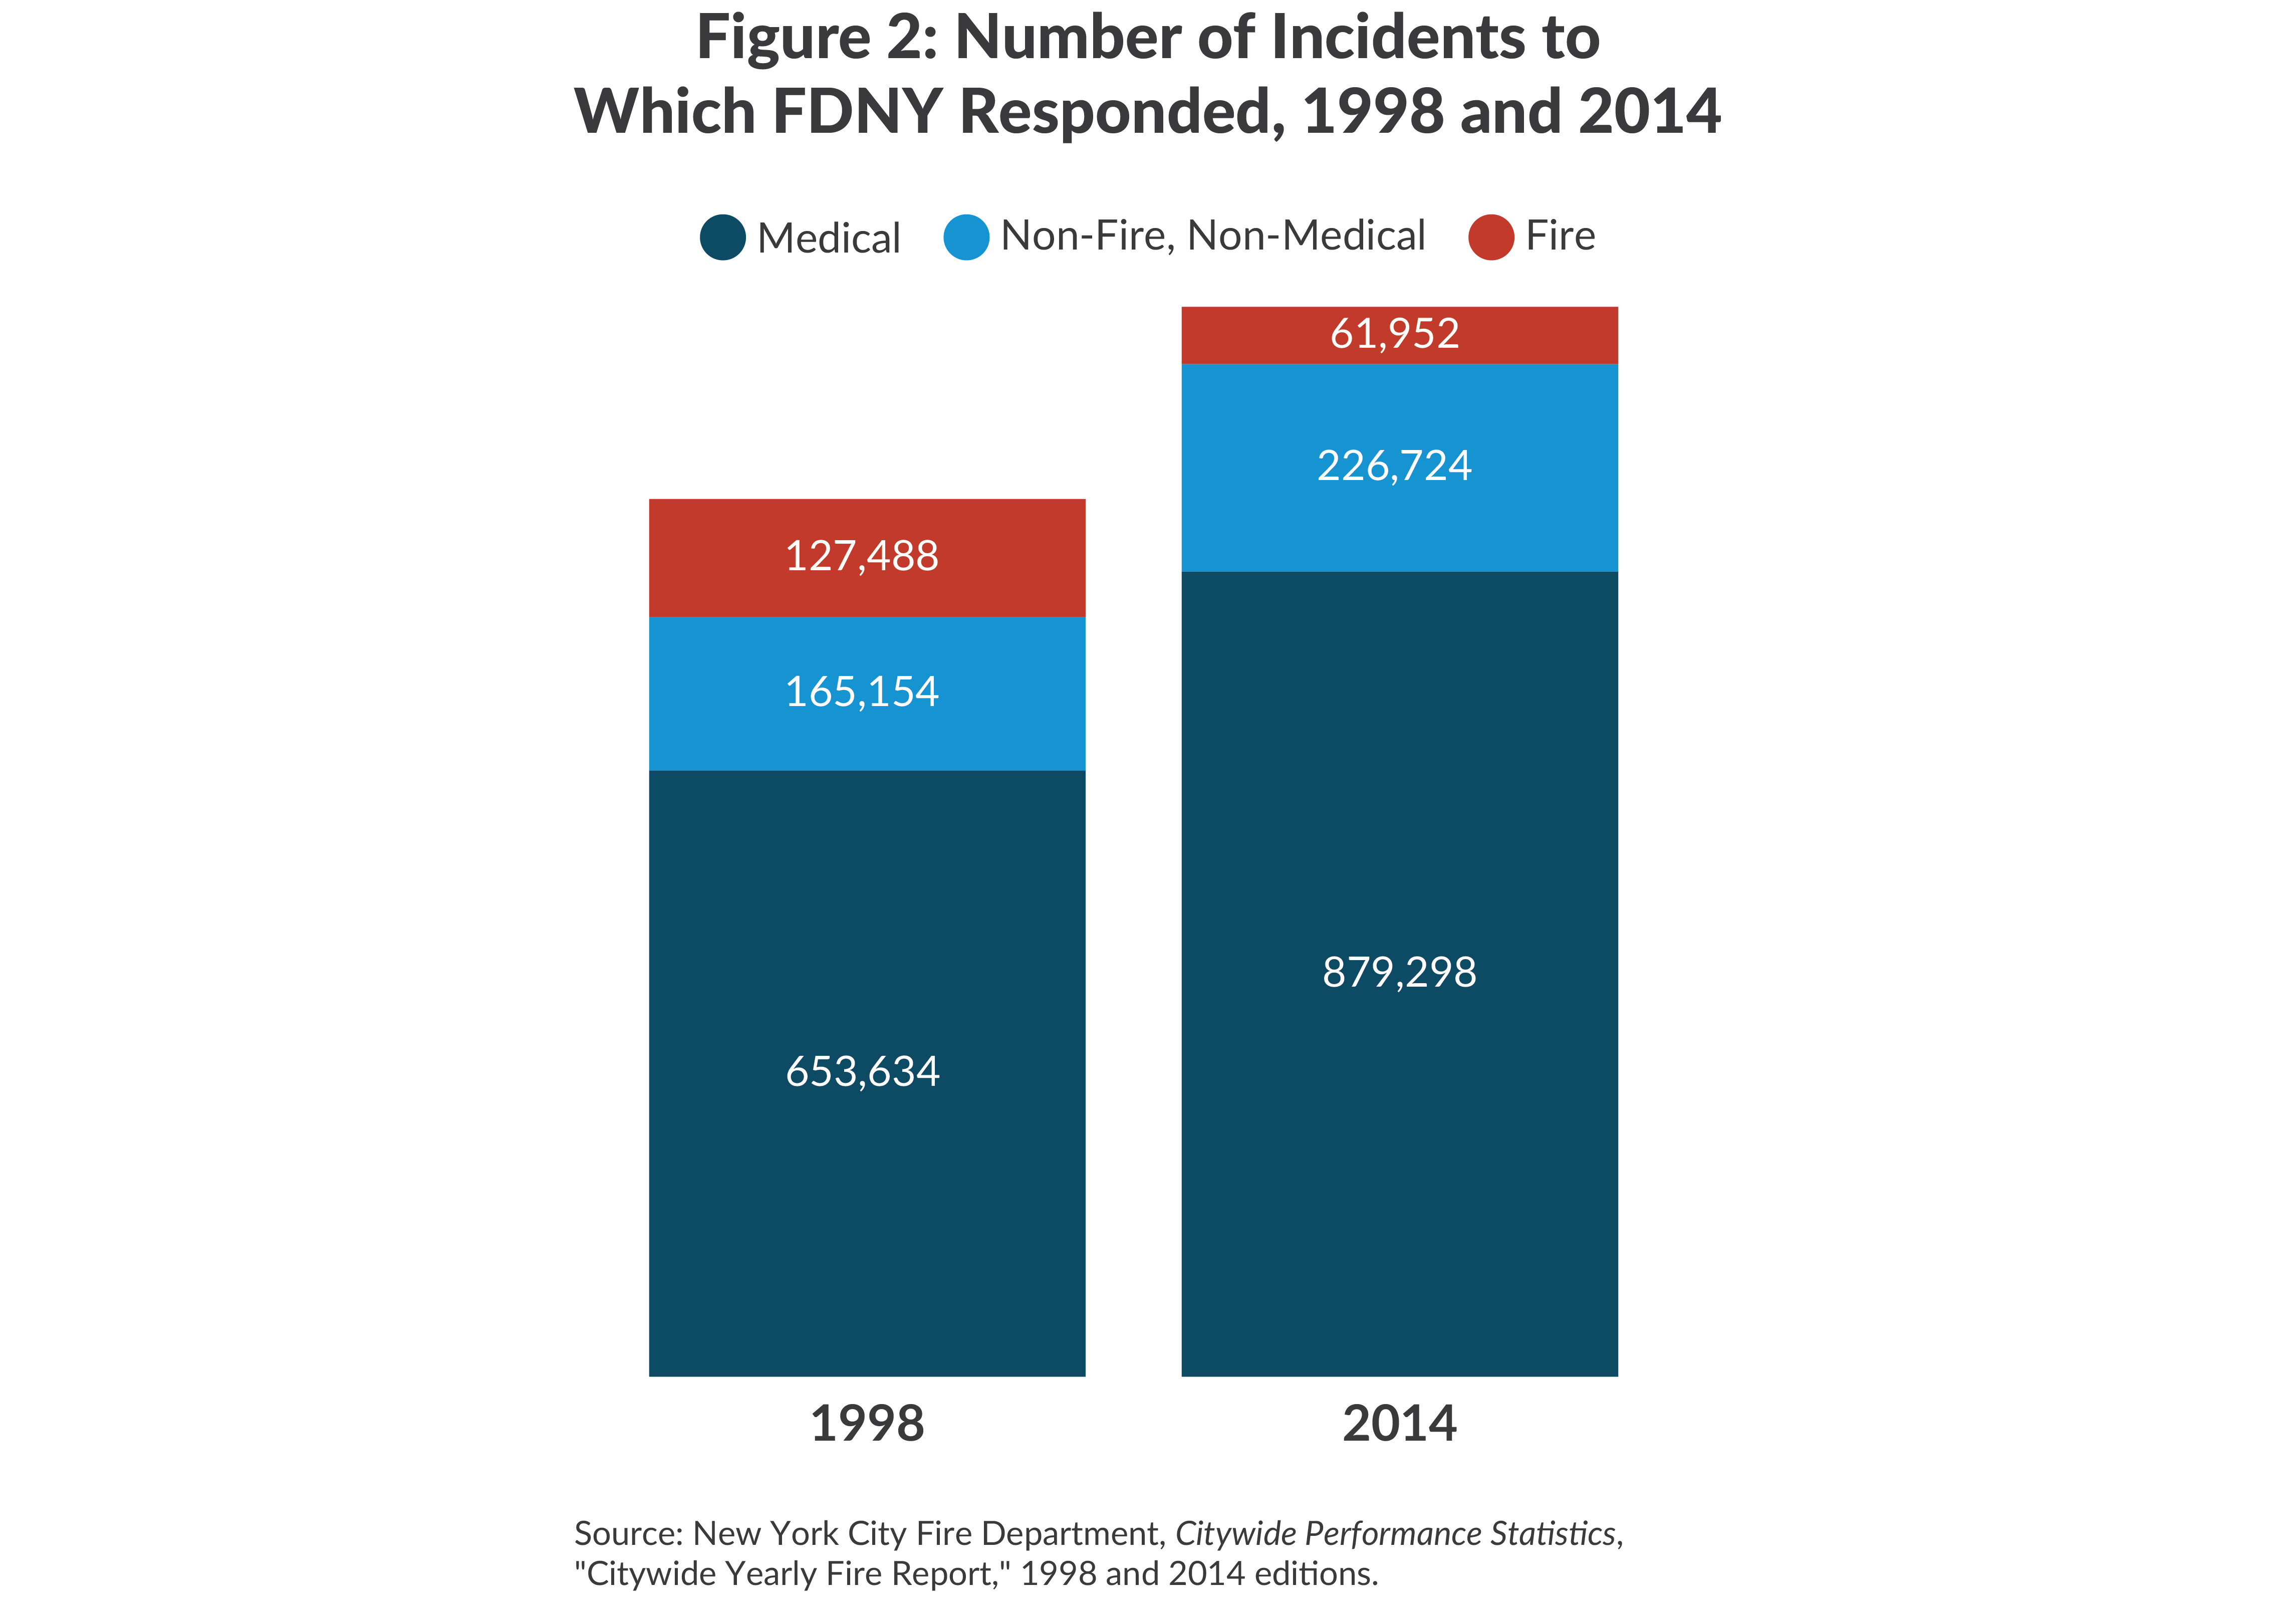
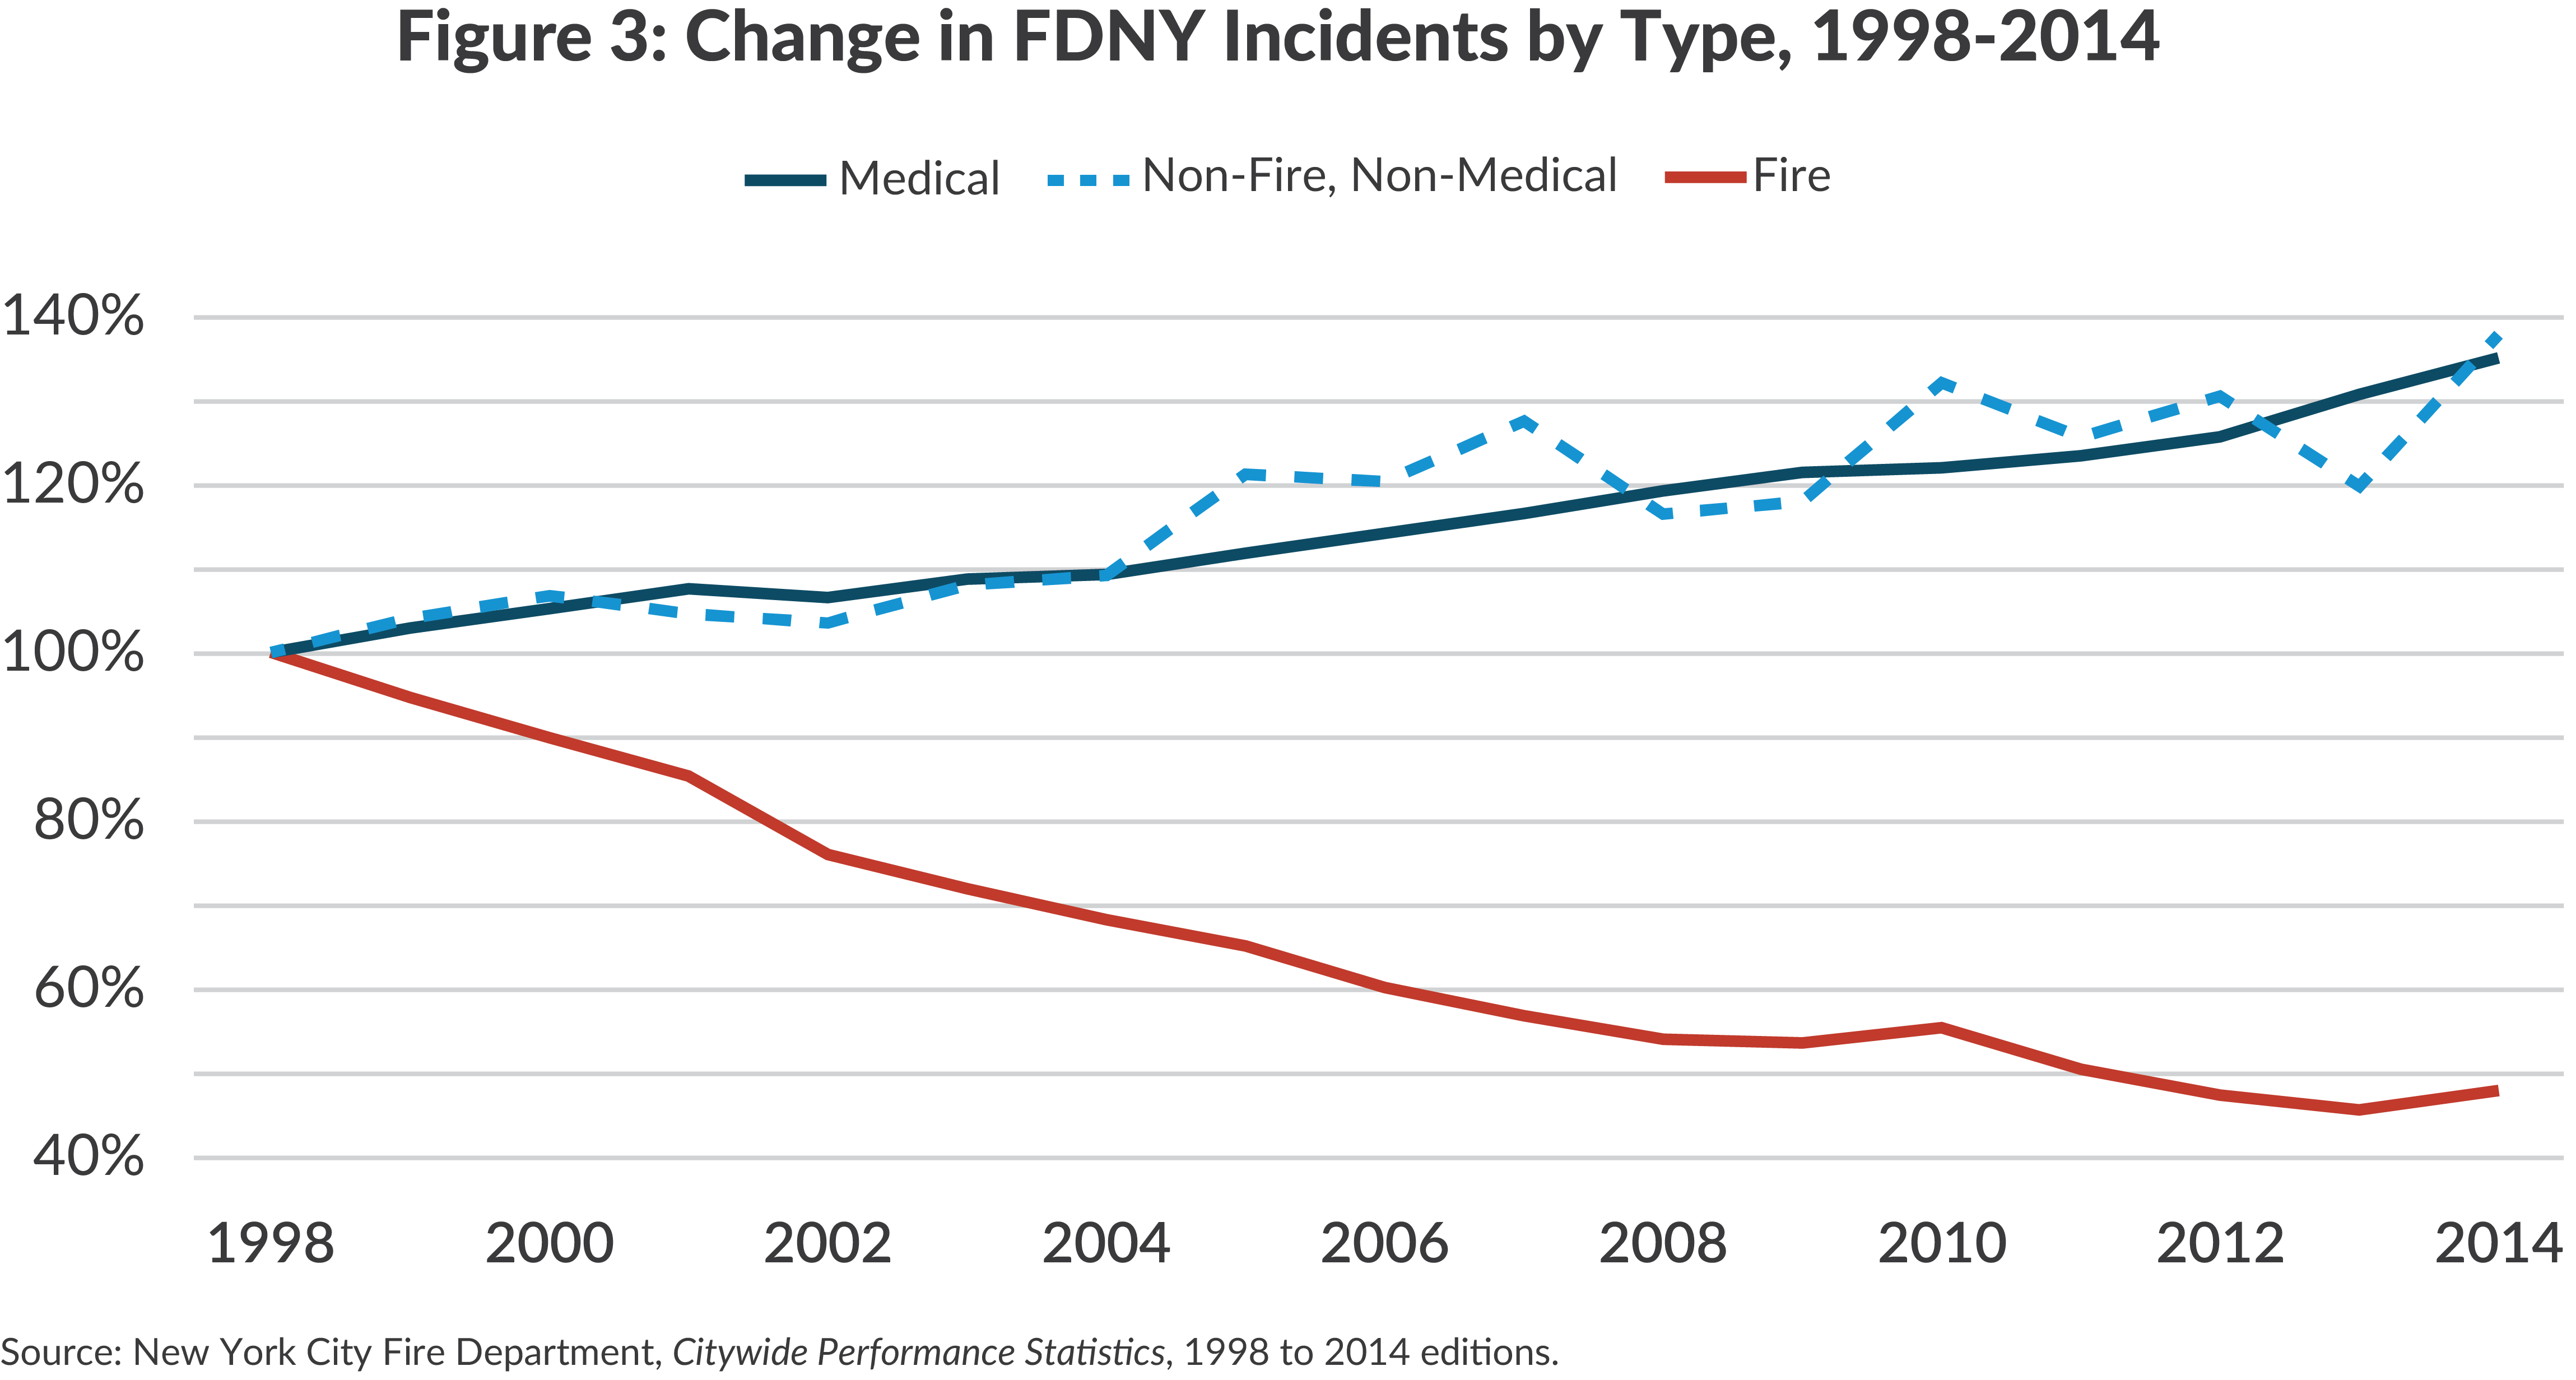
Since 1998, the first year for which comparable data are available post-merger, three trends have been evident.5 First, the number of fire-related incidents declined 49 percent over the period to less than 62,000 in 2014. The sharpest decline, about 70 percent, was in false alarms, which have dropped to one-third of fire incidents, or 55 per day, thanks to improved technology, such as caller identification and modernized call boxes. Non-structural fires, such as trash or auto fires, also declined more than 50 percent to an average of about 42 per day in 2014, or one-quarter of all fire related incidents. Structural fires, which are fires in buildings, averaged about 73 per day and were about one of every four fire incidents in 2014. Structural fires dropped about 9 percent since 1998; improved building codes and technology have helped reduce fires in commercial buildings and large apartment buildings, but fires in smaller residential structures remain a persistent problem.6
Second, the volume of non-fire, non-medical emergencies increased from more than 165,154 to 226,724, or 37 percent, from 1998 to 2014. In 2014 they averaged 621 per day citywide, more than eight times the number of structural fires. Non-fire emergencies include a wide variety of situations, such as search and rescue events resulting from building collapses or elevator malfunctions, utility disruptions, hazardous materials incidents, response to catastrophic weather events, and terrorist attacks.7 Some of the increase can be attributed to expanded responsibilities, including fire unit response to motor vehicle accidents (supplementing EMS and Police Department responses since 1997) and gas leaks (since 2014).8
Third, the medical emergencies to which FDNY responded increased by more than one-third to 1,352,766 annually, or 2,409 a day. The number of medical incidents to which the FDNY responds is about 15 times that of fire-related incidents and more than 30 times that of structural fires.
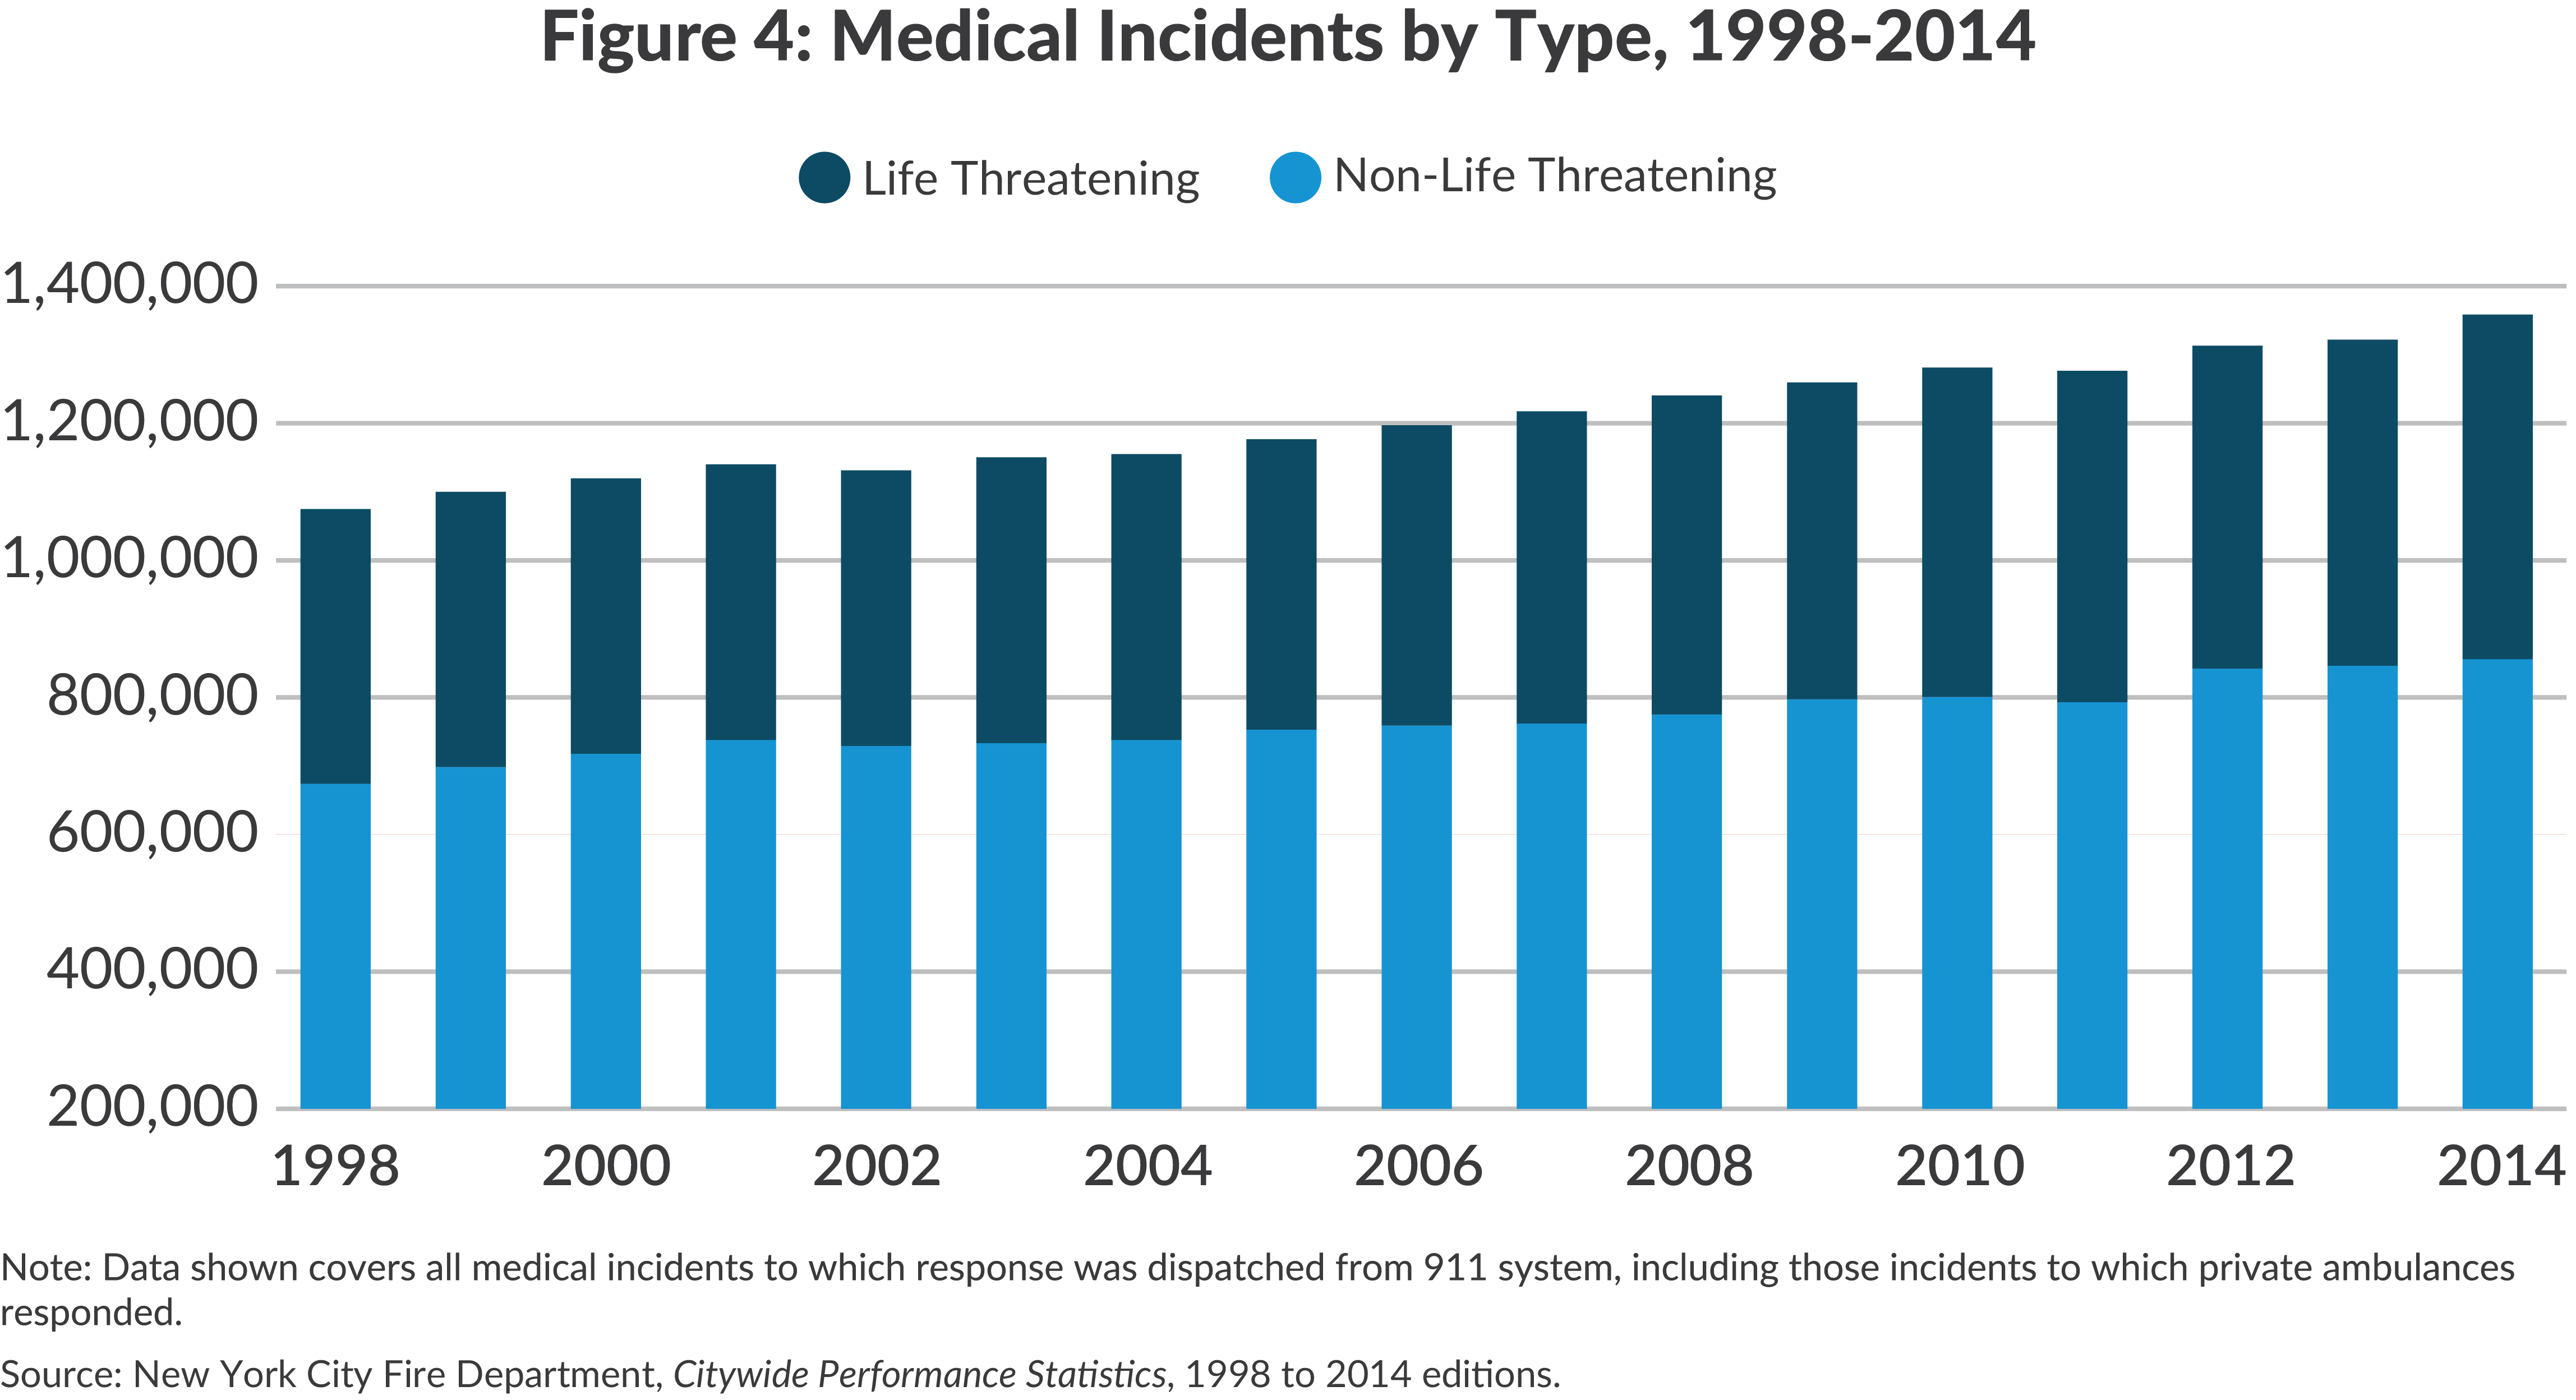
The growth in medical incidents is likely caused by multiple factors including a larger and older population, as well as more commuters and visitors to the city. The FDNY categorizes the medical incidents to which it responds into eight “segments,” with three representing life-threatening conditions such as cardiac arrest, anaphylactic shock, major burns, and choking.9 Five segments include non-life threatening conditions such as abdominal pain, behavioral health conditions, or general sickness. Non-life threatening incidents grew more quickly (38 percent) than life-threatening incidents (23 percent). In 2014 nearly two-thirds (64 percent) of the medical incidents to which the 911 system responded were of the less serious, non-life threatening nature.
Organization and Staffing
In fiscal year 2015 the FDNY’s total budget was more than $3.8 billion. 10 Despite the preponderance of medical incidents and the continued decline in fire incidents, most of the department’s resources—71 percent of the budget and two-thirds of personnel—are devoted to staffing fire units. The 10,789 fire personnel well outnumber the approximately 4,700 emergency medical technicians (EMTs) and paramedics, and EMS operations are funded at $500 million annually—just 13 percent of the budget.
Because the FDNY was not fundamentally reorganized in the wake of the merger, the FDNY sought to adjust to the mismatch between incidents and resources by training and requiring some firefighters to respond to certain medical emergencies; including medical responses by fire units brings resources for emergency medical services to 28 percent of the budget.11
Nevertheless, the workload of the two major service divisions differ notably, and the current arrangement is costly and redundant.

Fire
The 218 firehouses across the city house 198 engine companies, 143 ladder companies, and 16 specialized companies assigned to rescue activities, marine equipment, or handling hazardous materials.12 Engine companies are staffed 24/7 by four firefighters and an officer, and work with “pumpers,” large trucks that pump water onto fires at the scene of a fire or other emergency.13 Ladder companies staff trucks with extension ladders and equipment to ventilate fires and perform search and rescue operations. Ladder companies are staffed 24/7 with five firefighters and an officer.
Firefighters receive 18 weeks of training. Firefighters assigned to an engine company are trained as Certified First Responders with Defibrillation (CFRD), which requires an additional 80 hours of training, and can provide immediate assistance to people with some life-threatening medical conditions such as cardiac arrest, choking, drowning and allergic reactions. Salaries start at $39,370 and reach $76,488 after five years (not including overtime and other differentials).14
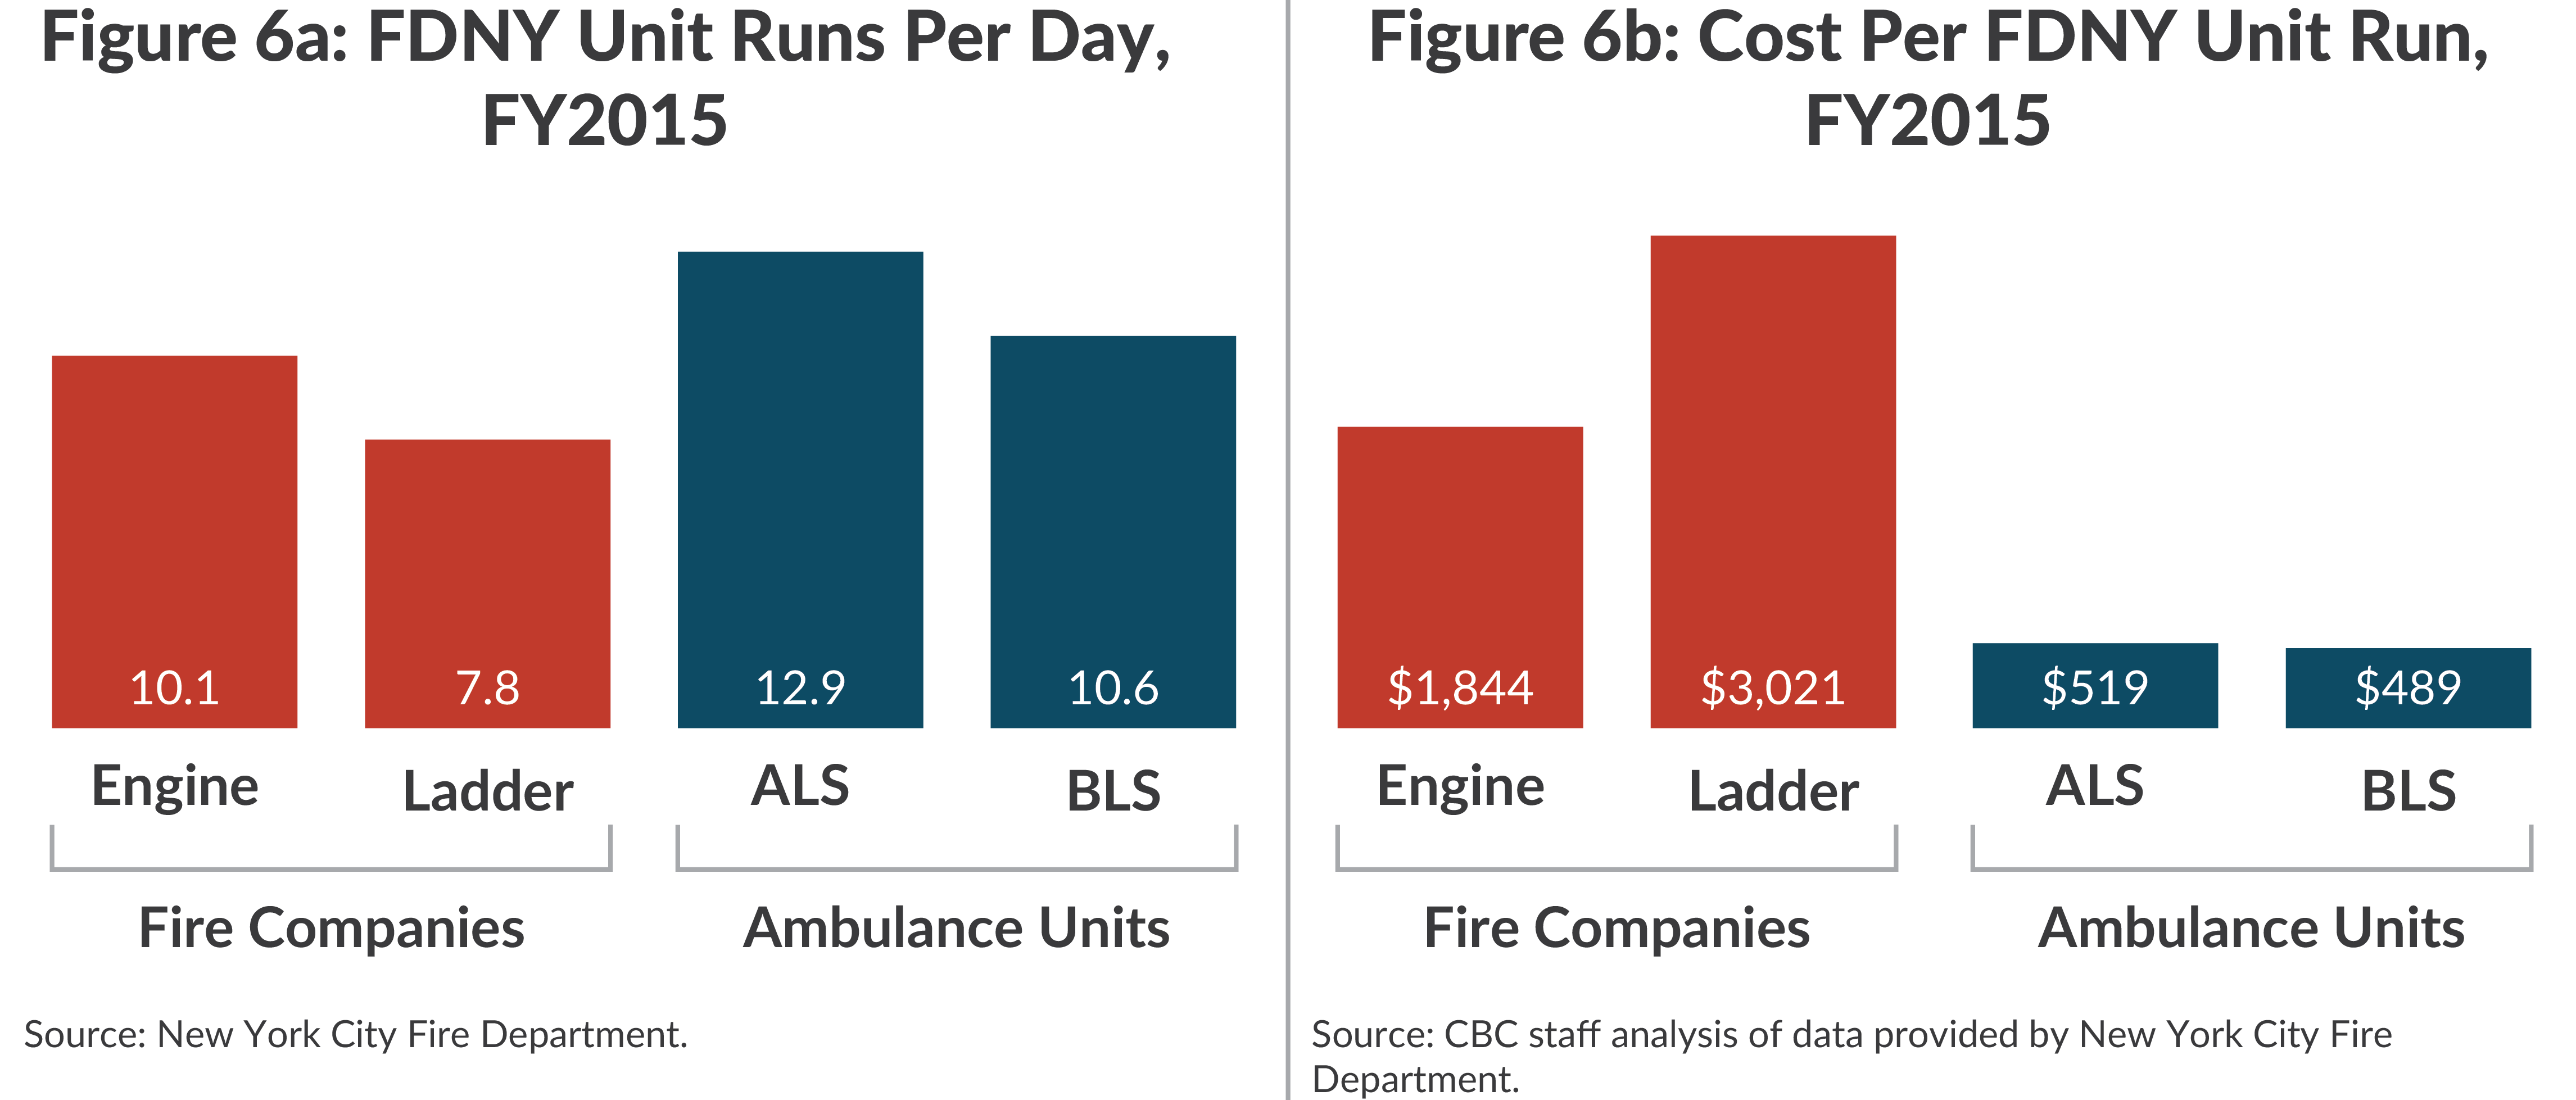
In fiscal year 2015 the average annual cost of operating an engine company was estimated at $6.8 million and that of a ladder company estimated at $8.6 million15 Incident responses, known as “runs,” varied widely among companies depending on neighborhood characteristics; citywide, the average was 10.1 runs per day for engine companies and 7.8 per day for ladder companies.16 This suggests average cost per response of $1,844 for engine companies and $3,013 for ladder companies.
EMS
The EMS is organized geographically with five borough divisions. Ambulances may be assigned to an EMS station, to a combined fire/EMS station, or a designated street intersection where they await a dispatch. EMS staff work eight-hour shifts, but staffing is not uniform for all hours and days of the week; the number of ambulances varies by shift and day of the week based on anticipated demand for the service.
The EMS has a fleet of 421 ambulances of which about 80 percent operate daily.17 Ambulances are staffed and equipped to provide one of two levels of service. A basic life support (BLS) ambulance can serve people needing cardio-pulmonary resuscitation (CPR), oxygen, bleeding control, stabilizing broken bones, and similar emergency responses. An advanced life support (ALS) ambulance carries more advanced equipment and medications to serve those with more medically difficult conditions, like those requiring intubation.
BLS ambulances are staffed with two EMTs; ALS ambulances are staffed with two paramedics. An EMT has received 200 hours of training and passed a State exam; a paramedic has received 1,280 hours of training including a field internship and also received state certification. EMT salaries start at $31,931 and reach $45,834 after five years. Paramedics start at $43,690 and reach $59,079 after five years.18 These figures do not include overtime.
On average an ambulance responds to about 3.8 calls each eight hour shift, or 11.4 responses per day of three tours per ambulance. The figure is higher for ALS ambulances (12.9 per day) than for BLS ambulances (10.6). 19 The average cost per ambulance response is estimated at $519 for ALS ambulances and $489 for BLS ambulances.20
Overlap and Service Redundancy
Emergency calls to the citywide 911 service are screened and referred to an FDNY dispatcher when appropriate. The dispatcher decides what type of unit to send to the incident. For fires a minimum response is one engine company and one ladder company; more companies are sent to more serious fires.
For medical emergencies the dispatcher decides whether to send a BLS or an ALS ambulance based on the nature of the incident. Based on availability and anticipated response time, the dispatcher also decides whether to send a private ambulance or a FDNY EMS ambulance. For incidents that seem life threatening, the dispatcher may also send an engine company to ensure a quick response. This is one key reason runs for engine companies exceed those of ladder companies: In calendar year 2014 engine companies responded to more than 231,000 medical incidents, about 633 per day citywide and about 3 per engine company per day.21
Response times for engine companies are generally quicker than for ambulances, but firefighter response is limited in important ways. First, firefighters cannot offer transport to a hospital; engines are not equipped to transfer patients, and firefighters cannot be “out of commission” for very long in the event there is a fire or other emergency. Second, firefighters have less extensive medical training than EMTs and paramedics; even when firefighters can provide meaningful assistance, protocols require an ambulance to arrive and take over, necessitating a redundant dual response.
Strategies for More Effective Emergency Services
Bolder strategies are needed to rethink FDNY services in order to better accommodate the growing demand for medical emergency responses and reduced need for firefighting activities.
Short-term: Staff for more efficient ambulance responses.
Nationally, ALS ambulance staffing varies among EMS agencies: some use two paramedics while others rely on one paramedic and one EMT. The available evidence indicates that the two paramedic model is not superior with respect to patient outcomes.22 Yet the FDNY is required to use two paramedics on ALS ambulances under rules established by the New York City Regional Emergency Medical Services Council (REMSCOs)—the only such council statewide to require two paramedics on ALS ambulances.23
The FDNY has petitioned the NYC-REMSCO unsuccessfully for permission to change ALS ambulance staffing to one paramedic and one EMT.24 It should apply again, and the change should be approved. It would not diminish the quality of care and would yield about $5 million in savings, which could be reinvested to expand the number of ambulance tours.25
Medium-term: Increase the medical training of firefighters so they can handle more situations without reliance on a separate ambulance and its staff.
Training firefighters as EMTs is already a common practice among departments in major U.S. cities including Chicago, Dallas, Houston, and Phoenix.26 Having at least one of the firefighters staffing an engine company trained as an EMT would require training about 850 or roughly 8 percent of uniformed personnel. Approaches for reaching or exceeding this goal include having firefighters who previously served as EMTs or paramedics renew their credentials; requiring officers assigned to engine companies to receive EMT training; or, more broadly, subsidizing the training for all current firefighters (about $1,200 per person).27
Over the long term, it may be preferable to require EMT qualifications for new applicants for firefighter jobs, which would also effectively create a career ladder for advancement among the EMS staff.
Having more firefighters trained as EMTs would yield two benefits. First, medical incidents to which engine companies are being dispatched could be handled more effectively and efficiently. In addition, in cases where transport is not required, it might not be necessary to dispatch an ambulance to the incident. Second, fire companies could respond to a wider range of medical incidents. The EMT training would enable fire companies to respond to many non-life threatening incidents now handled by BLS ambulances. This greater response capacity could reduce the need for BLS ambulances and/or speed response times to such incidents.
The Houston Fire Department (HFD) is an emergency service agency that has effectively handled a growing volume of medical emergencies by integrating its medical and firefighting staffing.
In the 1980s HFD began training firefighters as EMTs and dispatching them to medical emergencies. Subsequently, the HFD trained all new fire cadets as EMTs. Training is a continuous process: it starts with EMT training and is followed by fire academy training. During the first four years of service, firefighter/EMTs rotate between BLS ambulances and fire trucks gaining experience with the full range of services. Thus it is the same staff working on fire trucks and BLS ambulances.
Building on the success of the firefighter/EMT model, in 1996 HFD began to train firefighters as paramedics to staff ALS ambulances. Based on staffing needs, some new classes of cadets receive paramedic training beyond the EMT and firefighting training at the HFD academy. Firefighter/paramedics rotate between fire apparatus and ALS ambulances for four years after completing their training and an internship. At the end of the four-year period they can elect to continue serving as ambulance paramedics or shift roles to function as firefighter/EMTs. The majority choose to work as firefighter/EMTs due to better advancement opportunities as firefighters. Between 1991 and 2001, medical emergencies grew steadily at about 5 percent per year, but the HFD maintained good response times without adding ambulances by better training and deploying its firefighters.
Houston has successfully remodeled its department such that all personnel are able to address many medical emergencies as well as fire-related incidents. The expectations of recruits match these responsibilities. Many cadets attend the academy with the goal of serving as firefighters, but they understand that their primary responsibility is to respond to community needs by also being capable of handling the numerous medical emergencies.
Long-term: Fundamentally reorganize the department.
The sharp contrast between the persistent trends in the FDNY’s service demands and its traditional allocation of resources to fire companies suggest significant reforms are needed. The relationships between the two services should be redefined, and the financial and human resources provided for each type of emergency service should be rebalanced. This will require rethinking not only personnel training, but the types of equipment needed and the use, placement, and deployment of these assets. It is no small task, and will require extensive analysis of neighborhood demographic, building, and service trends; new and more nimble staffing arrangements that must be implemented through collective bargaining; and procurement of new technologies.
As noted earlier, the FDNY leadership has identified integration of fire and EMS services as a long-run goal and has cautiously begun this process. Interim objectives include increasing the number of EMS tours and more training for firefighters in handling medical conditions. With respect to future medical training, the Commissioner Daniel Nigro in a recent internal newsletter reported that among the changes under discussion are CFRD training for ladder companies and EMT training for engine companies.”28 These modest and conventional measures may be positive steps, but future strategies should be more extensive and creative. New York should begin to lead the nation’s cities in the integration and redesign of firefighting and emergency medical service missions.
Footnotes
- In fiscal year 2015 FDNY fire companies were dispatched on 1,138,509 “runs” or responses to calls; of this, 18 percent were responses to fire emergencies and 20 percent were responses to medical emergencies. Multiple units may be dispatched to a single incident, which explains why the number of runs exceeds the number of incidents. CBC staff analysis based on data provided by New York City Fire Department, Public Information Office, email to Citizens Budget Commission staff (November 17, 2015); and New York City Independent Budget Office, email to Citizens Budget Commission staff (November 5, 2015).
- Previously, EMS was under the New York City Health and Hospitals Corporation, now known as NYC Health + Hospitals.
- New York City Fire Department, FDNY Strategic Plan 2015-2017 (October 2015), pp. 20-23, www.nyc.gov/html/fdny/pdf/ofc/FDNY_strategic_plan_2015_2017.pdf.
- In 2014 more than 1.6 million incidents were referred to the FDNY for an emergency response by the citywide 911 system. Medical emergencies comprised 82 percent of that total. About one-third of the medical incidents were handled by private ambulance services, typically operated by voluntary hospitals, which participate in the 911 system along with the FDNY. Multiple units may be dispatched to a single incident, which explains why the number of runs exceeds the number of incidents. See New York City Fire Department, Citywide Performance Statistics, “Citywide Yearly Fire Report,” 1998 to 2014 editions (accessed October 8, 2015), www.nyc.gov/html/fdny/html/stats/citywide.shtml.
- Total medical emergencies are adjusted by 36 percent to reflect the share of medical emergencies responded to by private ambulances in the four years for which data is available (2010, 2012, 2013, and 2014). See New York City Fire Department, Citywide Performance Statistics, “Citywide Yearly Fire Report,” 1998 to 2014 editions (accessed October 8, 2015), www.nyc.gov/html/fdny/html/stats/citywide.shtml; New York City Fire Department, Citywide Performance Statistics, “Citywide Yearly EMS Report,” 1998 to2014 editions (accessed October 8, 2015), www.nyc.gov/html/fdny/html/stats/citywide.shtml; and New York City Fire Department, “Vital Statistics,” 2010 to 2014 editions, www.nyc.gov/html/fdny/html/general/vital_statistics.shtml.
- Michael Karter, “Trends and Patterns of U.S. Fire Losses in 2013,” National Fire Protection Association (March 2015), www.nfpa.org/research/reports-and-statistics/fires-in-the-us/overall-fire-problem/trends-and-patterns-of-us-fire-losses.
- New York City Fire Department, FDNY Strategic Plan 2004, p. 2, www.nyc.gov/html/fdny/pdf/pr/2004/strategic_plan/responsibilities.pdf.
- City of New York, Mayor’s Office of Operations, Mayor’s Management Report for Fiscal Year 1997 (September 1997), p. 22; and City of New York, New York City Underground Infrastructure Working Group, Infrastructure Report (June 2014), p. 6, www1.nyc.gov/assets/home/downloads/pdf/press-releases/2014/infrastructure_report.pdf.
- City of New York, NYC Analytics: 911 Performance Reporting, “Incident Type Definitions” (accessed October 8, 2015), www.nyc.gov/html/911reporting/html/reports/incident-type-definitions.shtml.
- Includes costs for the fire department that are centrally budgeted, most notably pension contributions. Employee compensation is 89 percent of the total FDNY budget.
- City of New York, Office of Management and Budget, Executive Budget for Fiscal Year 2016: Message of the Mayor (May 7, 2015), p. 143, www.nyc.gov/html/omb/downloads/pdf/mm5_15.pdf; and City of New York, Office of Management and Budget, Adopted Budget for Fiscal Year 2016: Revenue Contract, p. 78E, www.nyc.gov/html/omb/downloads/pdf/erc6_15.pdf; and New York City Fire Department, Public Information Office, email to Citizens Budget Commission staff (November 17, 2015).
- A firehouse may have both an engine and ladder company or just one. City of New York, Office of Management and Budget, Executive Budget for Fiscal Year 2016: Message of the Mayor (May 7, 2015), p. 144, www.nyc.gov/html/omb/downloads/pdf/mm5_15.pdf.
- The 1988 collective bargaining agreement between United Firefighters Association (UFA) and the City eliminated the fifth firefighter on all engine companies. Recently, the UFA and the City reached a tentative agreement that includes restoration of the fifth man at 20 engine companies.
- New York City Fire Department, “Firefighter Benefits and Salary” (accessed October 6, 2015), www.nyc.gov/html/fdny/html/community/ff_salary_benefits_080106.shtml.
- City of New York, Mayor’s Office of Operations, Mayor’s Management Report for Fiscal Year 2015 (September 2015), p. 72, www1.nyc.gov/assets/operations/downloads/pdf/mmr2015/2015_mmr.pdf.
- Data on runs by engine and ladder companies in fiscal year 2015 provided by New York City Fire Department, Public Information Office, email to Citizens Budget Commission staff (November 17, 2015).
- City of New York, Mayor’s Office of Operations, Mayor’s Management Report for Fiscal Year 2015: Additional Tables (September 2015), p. 32, www1.nyc.gov/assets/operations/downloads/pdf/mmr2015/vehicle_fleets_and_maintenance.pdf.
- New York City Fire Department, “EMS Benefits and Salary” (accessed October 6, 2015), www.nyc.gov/html/fdny/html/community/ems_salary_benefits_042607.shtml.
- Runs per tour estimate is based on the total number of medical incidents for fiscal year 2015 (1,395,570, with 526,904 requiring an ALS ambulance and 868,666 requiring a BLS ambulance). Subtracting the incidents handled by private ambulances (an estimated 36 percent) yields 893,165 incidents handled by the FDNY in fiscal year 2015, with 337,219 requiring an ALS ambulance and 555,946 requiring a BLS ambulance. The number FDNY EMS ambulance runs responding to those incidents is estimated by multiplying the number incidents by the average ratio of runs to incidents (1.11:1). This yields an estimated total number of fiscal year 2015 FDNY EMS ambulance runs of 991,413 with 374,313 by ALS ambulances and 617,100 by BLS ambulances. This total is divided by the number of days per year (365) and average tours per day (238 for ALS ambulances and 477 for BLS ambulances) to yield average runs per tour of 4.3 for ALS ambulances and 3.5 for BLS ambulances. With three tours per day, the average runs per day are 12.9 for ALS ambulances and 10.6 for BLS ambulances. See New York City Fire Department, Citywide Performance Statistics, 1998-2014 editions (accessed October 8, 2015), www.nyc.gov/html/fdny/html/stats/citywide.shtml.
- The average cost per ambulance tour is $1,901. Using a cost index based on salaries for paramedics ($59,079) and EMTs ($45,834) with five years of service, averages were calculated per ALS ambulance tour ($2,236) and per BLS ambulance tour ($1,733). Dividing by runs per tour yields an estimated cost per run of $519 for an ALS ambulance and $489 for a BLS ambulance. See City of New York, Mayor’s Office of Operations, Mayor’s Management Report for Fiscal Year 2015 (September 2015), p. 72, www1.nyc.gov/assets/operations/downloads/pdf/mmr2015/2015_mmr.pdf.
- New York City Fire Department, Citywide Performance Indicators, “Citywide Yearly Fire Report: 2014” (December 31, 2014), www.nyc.gov/html/fdny/pdf/stats/2014/fire/cw/fire_cwsum_cy14.pdf.
- Ryan Bayley, Matthew Weinger, Stephen Meador, and Corey Slovis, “Impact of Ambulance Crew Configuration on Simulated Cardiac Arrest Resuscitation,” Prehospital Emergency Care, vol. 12, no. 3 (August 26, 2009), pp. 62-68, www.tandfonline.com/doi/abs/10.1080/10903120701708011 .
- New York City Independent Budget Office, Budget Options for New York City (November 2014), p. 15, www.ibo.nyc.ny.us/iboreports/options2014.pdf.
- New York City Fire Department, FDNY Strategic Plan 2007-2008, p.9, www.nyc.gov/html/fdny/html/general/strat_plan_2007.shtml.
- The savings are possible because paramedics have higher salaries than EMTs; the respective salaries at five years of service are $59,079 and $45,834 excluding fringe benefits. In fiscal year 2015 EMS staffed 86,870 ALS ambulance tours; assuming each staff person works 240 tours annually, the salary savings would be about $4.8 million. This is a conservative estimate which does not include fringe benefit savings or actual higher average wages due to overtime.
- David Almaguer, Houston Fire Department, Assistant Chief, Emergency Medical Services, personal communication (January 26, 2015); Dallas Fire and Rescue, “Emergency Medical Services Bureau” (accessed October 8, 2015), www.dallasfirerescue.com/ems.html); City of Chicago, Chicago Fire Department, “Firefighter/EMT Application Frequently Asked Questions” (accessed October 8, 2015), www.cityofchicago.org/content/dam/city/depts/dhr/general/CFD-FAQs-Updated_082014.pdf; and City of Phoenix, Phoenix Fire Department, “Firefighter Hiring Process” (accessed October 8, 2015) www.phoenix.gov/fire/employment/firefighters/fire-fighter-hiring-process.
- St. Johns University, “EMT Original” (accessed October 8, 2015), www.stjohns.edu/academics/schools-and-colleges/college-pharmacy-and-health-sciences/emergency-medical-services/emt-original.
- Daniel A. Nigro, “A More Unified Department is a Better Prepared Department,” With New York Firefighters, v. 2 (2015) www.nyc.gov/html/fdny/html/publications/wnyf.shtml.