Unavoidable School Aid Cuts: Do the Least Harm by Targeting
In early 2007 newly elected Governor Eliot Spitzer and the State Legislature responded to a court mandate to provide every child in New York with a sound basic education by adopting a plan to increase state school aid by about $7 billion over the next four years. Much has changed since that multi-year commitment was made; perhaps most significant is the sharp downturn in the state's fiscal condition. While state education aid was increased $1.8 billion to $19.7 billion for fiscal year 2007-08, each subsequent year has seen a slow-down from the planned pace of added aid.
Now, for fiscal year 2010-11, Governor David Paterson has proposed an absolute cut in the amount of school aid. In the coming year he proposes to give local school districts about $1.1 billion less than they will receive this year, or about $20.5 billion. No one welcomes these cuts, but they are unavoidable. The budget gap for the coming year is estimated at $7.5 billion; with school aid projected in the baseline to be $21.6 billion out of a $78.4 billion total, it is not feasible to exempt this part of the budget from cuts.
Although it is unfortunate to have to cut school aid, it is positive that the proposed reductions are not across-the-board. The Governor has distributed them in a redistributive manner, and harm to the neediest districts could be further minimized by even greater targeting.
The Problem: Not How Much, but How Fairly, We Spend
The problem in New York has never been that we do not spend enough on education. Our per pupil spending is the second highest in the nation (behind New Jersey), and even before the 2007 commitment to increase significantly state aid, total education spending was rising rapidly.
The problem has been that these figures are averages. They mask gross disparities among districts across the state in how much they have to spend. In addition the added resources are not always used wisely; much of the money inflates costs without enhancing educational quality.
The Big and Growing Pie
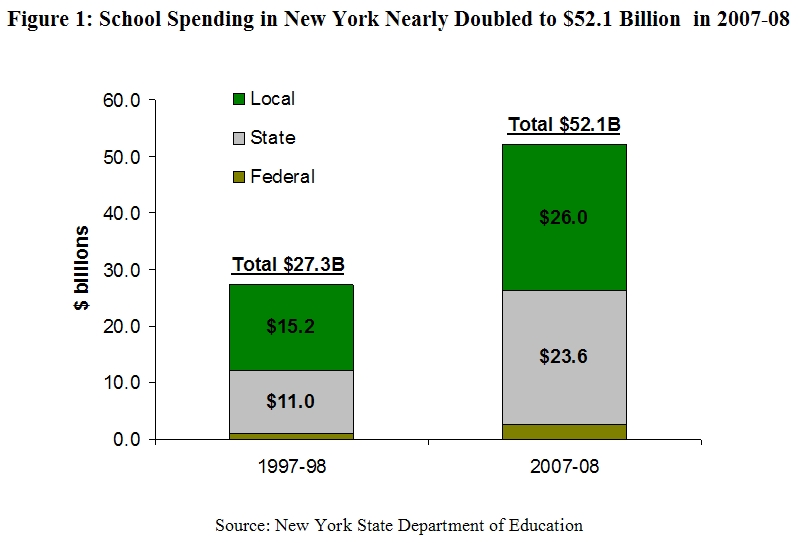
Total spending on education in fiscal year 2007-08 in New York State exceeded $52 billion. The State portion amounted to $24 billion, local districts raised nearly $26 billion, and the federal government supplied $2.6 billion. The state aid comprises fully 1 in 3 state tax dollars ($24 billion out of $65 billion). Similarly, local taxes levied for schools are about 1 in 3 dollars of all local taxes. It is also worth noting that New York's local tax burden is the highest in the nation and 76 percent above the U.S. average.
New York's education spending reached $52 billion through significant increases over the previous 10 years. Over that period school spending nearly doubled. Increases in state aid were larger than increases in local revenue, reflecting the State's commitment to increasing its share of total school spending. State aid increased from $11.0 billion to $23.6 billon, or 115 percent, while local aid increased $15.2 billion to $26.0 billion, or 71 percent. (See Figure 1.)
Where have the earlier decade's large expenditures gone? The available data covering 1996-97 to 2006-07 show that New York increased per pupil spending $7,860, from $9,777 to $17,636. About 58 percent, or $4,980, of the increase went to instructional spending. The remaining 42 percent went to administrative increases, construction costs, and other ancillary spending. Of the $4,980 increase in instruction, $2,870 or 58 percent went to salaries, 31 percent to fringe benefits, and 11 percent to other instructional costs. (See Figure 2.)
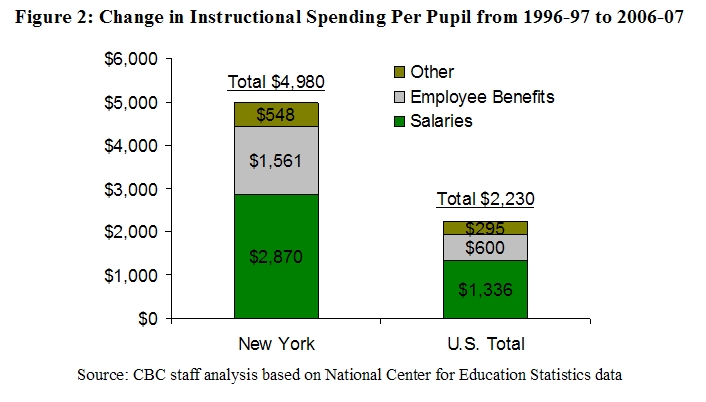
In comparison the increase in per pupil spending over the same period in the U.S. was $4,535, to $11,401. The increase in instructional spending was $2,230, or 49 percent. Salary cost increases comprised 60 percent of the increase in instructional spending and benefits 27 percent.
The fastest growth category for the U.S. and New York is employee benefits. For the nation the average annual growth was 7.3 percent. (See Figure 3.) New York's growth over the period was 8.2 percent; in other words, benefit costs in New York were growing 12 percent faster than in the nation. School districts in the U.S. spent 13 percent of the increase, or about $600 per pupil, on benefits, while New York spent about 20 percent or an additional $1,561 per pupil on benefits.
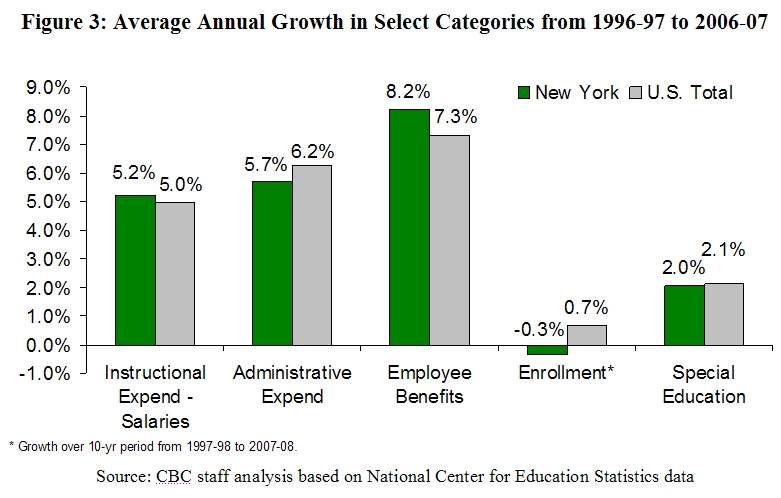
The increase in instructional spending did more than just increase teacher salaries. Modest gains in pupil-teacher ratios were made. The average pupil-to-teacher ratio in the U.S. fell from 18.8 to 15.8 from 1997-98 to 2007-08, a 16.1 percent reduction. New York's ratio over the period fell from 15.7 to 13.1, a slightly greater drop of 16.6 percent. (These ratios include special as well as general education enrollment, which drives the ratio down because special education classes typically have much lower ratios than general education classes.)
Has the added funding improved school performance? In recent testimony to the Joint Legislative Fiscal Committees, the State Education Department Commissioner David Steiner reviewed results over the last few years. Although New York's results on the National Assessment of Educational Performance tests since 2003 have been flat, there have been modest gains in the fourth grade math category; and modest increases in the number of students in grades 3 to 8 meeting Math and English standards since 2006. The Commissioner also reported slow and uneven progress in graduation rates, with persistently large gaps between race cohorts and slow and insufficient improvements in proficiency and graduation rates for English Language Learners.
The Unequal Slicing of the Pie
The basic problem with New York's system for school financing goes beyond the sometimes ineffective use of resources. Because of New York's heavy reliance on local taxes to finance schools there are large disparities in spending among poor and wealthy communities.
In 2006-07, the latest year for which district-by-district data are available, average per pupil expenditure from all sources - federal, state and local - was $18,365 statewide. (See Figure 4.) In the wealthiest 10 percent of districts the average was a whopping $28,754 per pupil. This is nearly double the average among the poorest 10 percent of districts, $16,463 per pupil.
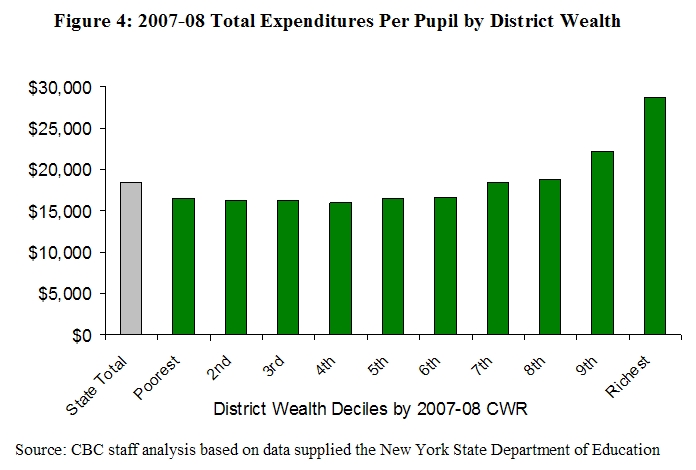
State aid plays a key role in shoring up the finances of the poorer districts. For the wealthier districts, the vast majority of their money comes from their ability to raise large amounts of property tax revenue with relatively low tax rates. In contrast, poorer districts levy higher tax rates to yield less money, and they depend heavily on state aid. State aid per pupil in poorer districts is four times that in wealthy districts - $14,000 vs. just under $3,500.
Targeted Reductions are the Right Strategy
Against this backdrop, the Governor's Executive Budget proposes modest and targeted reductions in school aid. The aggregate reduction of $1.1 billion is an average of about $400 per pupil.
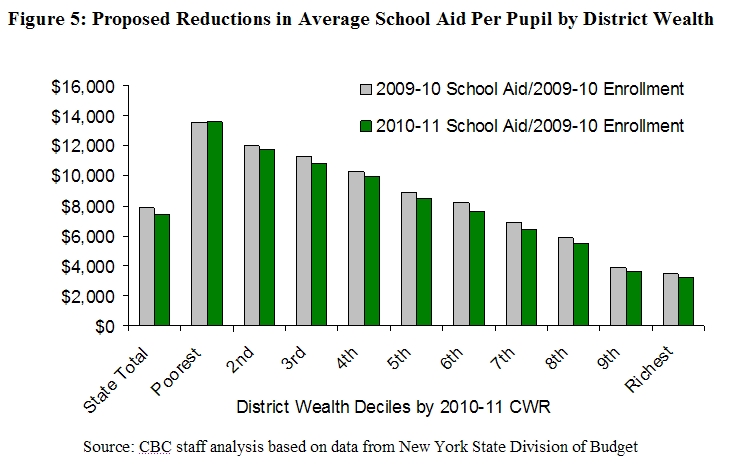
The overall impact of the reductions is that poorest districts most dependent on state aid are cut very little - or even receive increases. For example, Salmon River, a district in the North Country on the border with Canada that includes the Akwasasne Indian Reservation will see an increase of $500 per pupil. On the other end of the spectrum Scarsdale - often cited as an example of a well-to-do district - will see its aid reduced $110 per pupil. Aid for the district of Great Neck will go down by $182 per pupil. For the districts in the poorest 10 percent the decrease is $16 per pupil; for the wealthiest 10 percent it is $245 per pupil. (See Figure 5.)
Even greater targeting than proposed in the Executive Budget is desirable. The wealthiest districts in the state - the 136 that comprise the top two deciles on the state's combined wealth measure shown above - receive $900 million in state aid or an average of $3,678 per pupil. If this amount were halved, then all the cuts in aid to districts in the six poorest deciles - or 406 districts - could be restored. For the districts in the two wealthiest deciles the cuts would range from 6 to 9 percent of total spending, reducing the per pupil amounts to $20,285 in the second highest decile and $27,024 in the wealthiest group.
New York should honor its commitment to provide all students a sound basic education, but the approach it follows should be re-evaluated in light of a challenging revenue outlook. The limited available funding should be targeted to the neediest schools and pupils; the question is how best to support them. We need to invest wisely, not profusely.
By Elizabeth Lynam and Selma Mustovic